By Steve Goddard
Summer has come to a premature and frosty end at Santa’s workshop.
")
http://psc.apl.washington.edu/northpole/webphotos/noaa2.jpg
It has been the coldest summer on record north of 80N, and temperatures have dropped below freezing ahead of the average date.
")
The entire ice covered region is now below freezing.
")
http://www.esrl.noaa.gov/psd/map/images/fnl/sfctmp_01.fnl.gif
It also appears that the summer melt season will be the shortest on record. The maximum was reached very late in March, and it appears likely that we are headed for an early minimum.
")
Mark Serreze at NSIDC has stated :
As the climate warms, the summer melt season lengthens …”
He was also reported as saying :
Mark Serreze of the center forecast the ice decline this year (2010) would even break 2007’s record.
Another interesting fact is that we are almost certain to see a large increase in the amount of multi-year ice (MYI) next year. The reason being that almost all of the 1-2 year old ice (turquoise) in the NSIDC map below will become classified as MYI next spring.
")
We have seen a remarkably rapid recovery from the 2008 low volume.
PIOMAS continues to report record low volumes of ice, despite all evidence to the contrary. The image below shows in red how far off the mark their August 15 forecast was. Their modeling error will get much worse over the next two weeks – because they model much of the thick multi-year ice in the Beaufort Sea and Arctic Basin as only a few tens of centimetres thick.

With the cold temperatures, ice area loss has almost stopped.

http://arctic-roos.org/observations/satellite-data/sea-ice/observation_images/ssmi1_ice_area.png
However, ice extent continues to drop – because the Arctic Oscillation has turned negative and winds are compacting the ice towards the pole. This bodes well for continued growth of ice in 2011.
")
http://www.ijis.iarc.uaf.edu/seaice/extent/AMSRE_Sea_Ice_Extent.png
PIPS shows average ice thickness increasing, due to the compression of the ice.
")
There has not been a lot of ice loss during August. The modified NSIDC image below shows in red, areas that have lost ice since August 1. Note that the Greenland Sea appears to have lost ice. This is due to the fact that there has been very little transport out of the Arctic Basin through the Fram Strait, which again bodes well for ice gain in 2011.

The modified NSIDC image below shows ice gain since 2007.

NSIDC maps continue to show more gain (16%) than their graphs (10%.) I have not been able to get a satisfactory explanation from them about the cause of that discrepancy. DMI shows a 25% gain in 30% concentration ice over 2007.
My forecast (dashed line below) minimum of 5.5 million (JAXA) continues to look conservative. It all comes down to what the winds do over the next few weeks. If the winds keep compressing the ice, the minimum may go a little below 5.5. If the winds quiesce, the minimum may come in a little above 5.5 – which is looking like a pretty good number right now. Some people at NSIDC started out with a 5.5 forecast this year, but seem to have backed away from it since.

Academic theories about the Northwest Passage becoming a commercial shipping opportunity appear pretty clueless.
“The plans that you make can change completely,” he says. This uncertainty, delay, liability, increased insurance and other costs of using the Northwest Passage are likely to deter commercial shipping here. A ship with a reinforced hull could possibly make it intact through the passage. But if it got stuck, it would cost thousands of dollars for an icebreaker like the Amundsen to come to the rescue. So even if the Northwest Passage is less ice-choked than before, the route may not become a shipping short-cut in the near future, as some have predicted.
The South Pole will almost certainly set a record for most sea ice this season. It is almost there, and there are still several months of growth remaining.
")
http://www.iup.uni-bremen.de:8084/amsr/ice_ext_s.png

http://nsidc.org/data/seaice_index/images/daily_images/S_daily_extent.png
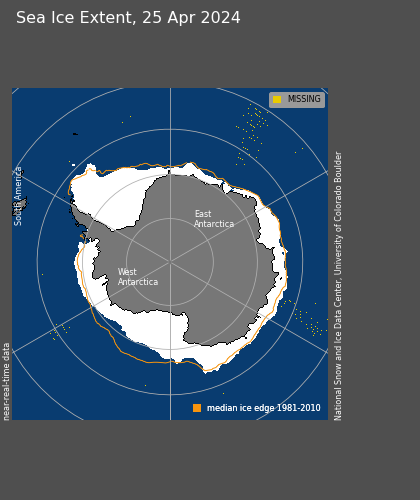
As seen below, the symmetry between the North and South Pole is impressive through the satellite record. They always seem to move opposite each other and produce an approximately constant amount of sea ice. It would be nice if the experts focused on solving this relationship rather than making up forced explanations like the “Ozone Hole” – which has just started forming for the year and will be gone before Christmas.

UIUC North/south anomalies overlaid on top of each other.
http://arctic.atmos.uiuc.edu/cryosphere/IMAGES/seaice.anomaly.arctic.png
http://arctic.atmos.uiuc.edu/cryosphere/IMAGES/seaice.anomaly.antarctic.png
(Note to posters and ice experts. Before you embarrass yourself making comments about how seasons are out phase at opposite poles, remember that this is normalised data and the period is in excess of 30 years.)
Conclusions:
The “long term trend” (30 years) in Arctic ice continues to be downwards, and would be even if the ice minimum was a record high this summer. But the three year trend shows strong growth of extent, thickness and age. Meanwhile, Antarctic ice is blowing away the record books. Yet the press continues to spread massive disinformation about the state of ice at both poles. Who could possibly be responsible for that?
Sponsored IT training links:
Get COG-112 materials along with 352-001 dumps to practice and pass 000-977 exam in timely and cost saving manners.
PIOMAS continues to report record low volumes of ice, despite all evidence to the contrary.
…………………………………………………………………………………………………………………….
PIOMAS shows the McClure Straits open. McClure Straits location here:
http://img801.imageshack.us/img801/7357/arctic.gif
This PIOMAS computer animation that runs from March to September 2010 shows the McClure Straits opening in July, completely open all of August, and begins to close, but not completely, in September. This computer animation was made using the PIOMAS hypothesis.
http://psc.apl.washington.edu/zhang/IDAO/z.gif
Data from August 13, 2010 shows the McClure Straits are not open
http://img580.imageshack.us/img580/8068/arctic8132010.png
The PIOMAS hypothesis is wrong.
I feel sorry for the penguins. They really have to walk a lot this year.
Letter to the prime minister of Britain:
.
Mr David Cameron P.M.
Westminster
Sir,
Still think that the world’s sea ice is ‘melting’ and rapidly disappearing??
Actually, Antarctic sea ice is now at its greatest ever ‘recorded’ extent.
Antarctic sea ice extent:
http://climateinsiders.files.wordpress.com/2010/08/ice_ext_s-2.png
But you will not tell the public this?
Nor will the BBC or the newspapers?
It is against your Warmist religion to tell the truth?
The public should be treated like mushrooms (kept in the dark and fed bullshit) ?
I thought only the former USSR fed their public pure propaganda – are we now worse than the USSR?
And you may not know it, but Arctic sea ice is recovering well from its previous minimums.
Arctic sea ice extent:
http://climateinsiders.files.wordpress.com/2010/08/ssmi1_ice_area.png
And you may not know it, but it has been the coldest Arctic summer ever on record.
Arctic sea ice report:
http://wattsupwiththat.com/2010/08/15/sea-ice-news-18/
Want to pet some more huskies? Or should you join the real world at last?
Sincerely,
Ralph
The proximity of this post, which suggests the Arctic cold to be a part of a long term trend, with that of the Russian heat wave, whose cause is dismissed as weather, might be interpreted by some “warministas” as an observational bias.
latitude says:
August 15, 2010 at 6:41 am
Morning Gates
Snigger, it looks like the “canary” decided to keep it’s mouth shut.
Everybody lives, yeah!
How many wheels does this wagon have?
Yet another Sea Ice News with no MODIS satellite images or high-resolution ice concentration maps, such as the ones by Cryosphere Today or the University of Bremen. Too bad, they look interesting.
Steven Goddard, how do this year’s air temperatures compare to 2007, 2008 and 2009 around the same date? Not just the DMI modeled temperature above 80N, but the entire Arctic. That should give some perspective to your assertion that “the summer melt season will be the shortest on record”. You could be right, but perspective is never a bad thing, is it?
Cold nasty winter ahead IMHO. I feel we are one Volcanic eruption away from a
mini ice age..
Steve,
Another very well cherry picked update. Just last week you were asking whether or not we’d end up this year closer to 2005 or 2009. Now of course, we are looking at how close we’ll come in extent to 2008 (since as of today, we are still below 2008).
You keep bringing up the DMI temp data, yet all the melt right now is really based on ice that has diverged over water that is warmer than average:
http://polar.ncep.noaa.gov/sst/ophi/color_anomaly_NPS_ophi0.png
It is the water temps that drive the ice loss this time of year, though I know many readers here really believe everything you say, and that’s fine, but the DMI temps are not that critical and IMO your characterization of the general state of Arctic Sea ice is far off the mark. Eariler this season you were trying to compare 2010 to 2006, and look where that’s gone. Next, you were trying to compare it to 2005, and look where that’s gone. Of course, 2009 is the next mark on your target, and it looks like there is a very good chance now that 2010 extent will certainly be be lower than 2009. Of course that will mean that there will not be a third year in a row of a “recovery”, but I suppose that the AGW skeptics will have to start talking about a “Recovery Spiral”
In all your updates you seem to have completely failed to mention the entire issue of divergence in the ice that occured at the end of July and into August. Instead, you continually equated a slow down in the extent drop during this period of divergence with a slow down in melting, which is simply flat wrong. Both area and extent drop will slow down during this time, which has been happening more frequently as the general ice thickness has fallen over the past few years. Diverged ice lowers the concentration, though the area and extent drops will slow down. And BTW, it is some of this diverged ice, that doesn’t fully melt by the time the freeze up starts in September that will go on to become the much ridiculed “rotten ice”, in David Barber’s use of the term.
The real race now is whether or not 2010 will finish below 2008 or not. This is the most interesting race left. 2010’s melt looks most similar to 2008 here in the final weeks of the melt season. 2008’s low was hit on September 9th, but right now, I see the 2010 melt season lasting longer than that, with the low not being set until Sept. 20th-25th. It is these few extra weeks of melting that could make the difference between 2010 beating out 2008 or not.
You are right about one thing, this year’s melt did not show any change in course to the longer term downward trend in Arctic summer sea ice loss, and moreover, the sea ice spent most of the summer at record low, or 2nd lowest extents, only behind 2007.
Steven Goddard has said 2010 is tracking similar to 2006. 2006 flattened:
http://img411.imageshack.us/img411/8732/amsre8132010.png
If 2010 flattens it could be above 5.5 in JAXA. As Steven Goddard says it comes down to the winds.
I’m still looking for 2005 to be crossed in DMi.
(Sort of on topic – please Mr. moderator?) I watched Gavin Schmidt, Jeffrey Sachs (econ Columbia) and (I forgot who) from the CATO institute talk about global warming on Fareed Zakaria’s “GPS show and was pleasantly surprised at the friendliness of the mini debate. Gavin stated that we can’t draw AGW conclusions from the Russian heatwave or even the cluster of events (Pakistan flood, European flood, Petermann Glacier calving, etc) but there is no doubt that the planet has been warming. There seems to be an official cooling of the rhetoric and hyperbole on the degree of warming and the disaster quotient. Schmidt was quite charming, stating that he was an optimist and that he was certain that America and other countries would rally around solutions before things got too far out of control. The Cato climatologist was also reasonable in that he said sure there has been a warming trend but it is not the trend toward near term disaster that has been stated by the UN. His main point was that the biggest crippler of our ability to deal with it if it became necessary, was the ludicrous idea of destroying the capital that could be needed by bleeding off trillions in taxation to fund useless solutions. He said that whatever new energy technologies that are going to be needed require massive investment in research and development – even if we wanted to we won’t be able to continue burning fossil fuels for more than a century anyway and this has nothing to do with the climate. Only Jeffery Sachs, the non scientist in the group was waxing strongly on the planetary disaster (why is it the butcher, the baker and the candlestick maker have the strongest conviction that disaster is at hand with the climate?).
Anyway, the more considerate tone, the mentioning of uncertainties, the attentuation of the former steep curves, the new research being done….. is a change from the scientific “love-in” of the past couple of decades. This has come about because of the scientific “sit-in” by those skeptical of CAGW. A relatively small handful of intelligent, questioning individuals who were rallying points for many others have succeeded in turning the massive tide and providing alternative ideas for the many to consider – and look at the swing in the polls on the subject. Surely Anthony Watts, among this few has done much more to deserve a Nobel Prize than the recent crackerjack prize winners of the past few years. I’m afraid even if the Hudson River starts accummulating multi-year ice, though, he won’t receive one.
Yngvar,
Not to worry the penguins have happy feet,
Walt Meier says:
August 15, 2010 at 8:37 am
For not being a forecaster, he does talk alot about the future.
http://climateprogress.org/2010/05/24/arctic-sea-ice-extent-volume-nsidc-record-steve-goddard/
Interesting that there are no recent comments on that thread. 😉
Walt Meier says:
August 15, 2010 at 8:37 am
Also, the article that says Mark Serreze forecast this year would break 2007′s record is not a direct quote and is incorrect. Mark is not a forecaster, so he didn’t forecast anything. Second, I’ve never heard him say that we would break the record; he may have said “we could break the record”, which was a possibility.
Walt, have you ever heard Serreze say “we could see a continuing increase in Arctic sea ice”? I didn’t think so. Of course, it was also a “possibility”. Until NSIDC starts producing unbiased press statements their credibility will be questionable. And that affects your reputation as well.
Fortunately, this debate will soon be over once we start getting reliable satellite data.
That is, unless some start trying to compare it to the currently unknown sea ice situation.
Brad says:
August 15, 2010 at 7:19 am
Ahhh, but no need to worry, the folks funded by our tax dollars continue to push the AGW meme – why in the world would the videos available only show the period to 2006, and only in the Arctic? Hmmmm….why would that be….?
http://arctic.atmos.uiuc.edu/cryosphere/
So I sent this e-mail to them:
I would like to know if your web-site http://arctic.atmos.uiuc.edu/ has been updated recently. I only see information up to 2007.
As climate cycles vary with time, I am most interested in seeing where we are now and how the model projections are faring relative to observation.
Thanks.
Maybe they consigned the arctic to the “death-spiral” in 2007 and moved on to greener (because of increased CO2) pastures?
If I get a response, I will post it here.
Walt Meier says:
August 15, 2010 at 8:37 am
Also, the article that says Mark Serreze forecast this year would break 2007′s record is not a direct quote and is incorrect. Mark is not a forecaster, so he didn’t forecast anything.
………………………………………………………………………………………………………………….
If he is not a forecaster then will you get on tv and set the record straight that when he, Mark Serreze, the now head of NSIDC, said Arctic Ice is in a “death spiral” it had no validity because he is not a forecaster?
Mark Serreze is not a forecaster when the only thing that made him known was a forecast?
You take me for a fool?
Walt Meier says:
August 15, 2010 at 8:37 am
Also, the article that says Mark Serreze forecast …..I’ve never heard him say that we would break the record; he may have said “we could break the record”, which was a possibility.
“Could” is a relative term, isn’t it. The moon could turn toward the earth and crush the Lower 48 States.
When he made that forecast I am sure he wanted the reader/listener to infer that alarming things are happening in Arctic Ice because of ‘global warming’. But for someone in his position to be that far from reality in his statement, that lacking in understanding what is really happening in Arctic Ice, shows something is going on in that government agency other than informing the public about data.
Walt Meier says:
August 15, 2010 at 8:33 am
The idea of overlaying the Arctic and Antarctic Sea Ice Anomalies into one graph is MY contribution, as an image processor, to this whole mess. The purpose of my doing that was to highlight the transposition of the overall Arctic/Antarctic longterm anomalies from one pole to the other. i.e – at one time, the Arctic was at a higher than 1979-present overall anomaly than the Antarctic. They have swapped places. I’m sure you remember the Coming Ice Age scare of that time.
There is no Coming Ice Age scare over the Antarctic at present in this Post-Normal Science world.
This, Dr. Meier, is my handicraft: http://www.robertb.darkhorizons.org/seaice.anomaly.Ant_arctic.jpg
I have placed this graphic overlay work in numerous Sea Ice New updates, but until your post, I have not had anything more than a passing notice.
For that matter, the two anomaly wanderings are neither correlated nor in phase, yet they move over time relative to each other.
If you wish to take issue with what my handiwork says or does not say, please take that issue up with me, for I am it’s originator.
It’s my fault, not Steve Goddards.
Walt,
Mark Serreze is constantly being reported by the press as forecasting Arctic ice, and has been for many years. If that is not a role he is comfortable with, he should make that completely clear to the members of the press he is talking to. He certainly has Joe Romm believing that he is a forecaster.
Your north/south correlation isn’t valid because it is probably on too fine a granularity. The northern and southern hemispheres are 180 degrees out of phase (on an annual basis) with respect to freezing and melting. Try doing the same correlation using annual averages based on maximum-to-maximum in each hemisphere.
R Gates,
I have no idea what you are talking about. My forecast has never changed since day one.
Walt Meier says:
August 15, 2010 at 8:33 am
Steve,
What are the correlation numbers between the monthly Arctic and Antarctic anomalies?
Huh, looking at the graph anyone can there is a relation. You don’t see one?
http://img685.imageshack.us/img685/9959/uiucnorthsouth.jpg
Dr Walt Meiers says about his boss: “Mark is not a forecaster, so he didn’t forecast anything.”
That statement is ridiculous, and it shows the lengths to which underlings will go when they fear for their position. If we take Meiers’ statement at face value, then no one who is not a “forecaster” is allowed to forecast anything.
As a taxpayer, I demand a refund.
Richard M says:
August 15, 2010 at 10:16 am
have you ever heard Serreze say “we could see a continuing increase in Arctic sea ice”? I didn’t think so. Of course, it was also a “possibility”.
Interesting point. It is a possibility. Especially looking at what has been happening the last three years in Arctic Ice, the sun being quiet, and the slight cooling since 1998.
Well, my calculated guess at the minimum seems to have been a bit too optimistic this year at 6.12 Mkm2 by IARC extent graph. Since it has already scooted by that, my only hope would be to call an end to the summer melt today! Steve, seems you are more in line with the reality of the matter.
Günther Kirschbaum says:
August 15, 2010 at 9:20 am
how do this year’s air temperatures compare to 2007, 2008 and 2009 around the same date? Not just the DMI modeled temperature above 80N, but the entire Arctic.
What are the others?
I’m certainly no expert on polar ice, but I do have some simple observations:
1. The Earth dips and bobs in the plane of the ecliptic. As the planet dips and bobs through the plane of the ecliptic, it seems to me that slightly more or less solar radiation would strike each pole (axial pole, not magnetic), and that this would slightly increase radiation hitting one pole while slightly decreasing radiation hitting the other pole.
2. Although the tilt of the Earth with respect to the Moon is constant, it does not follow that the tilt of the Earth/Moon system with respect to the Sun is also constant. There’s got to be some degree of variability in the tilt of the Earth/Moon system (the center of gravity of this system) with respect to the Sun as the Sun’s gravity well drags the Earth/Moon system about the cosmos. This is similar to my point (1.) above.
So, my point would be: the relationship of ice on the axial poles has an inverse relationship due to the mechanics of the solar system. Total ice would be a factor of distance from the Sun and heat. Distribution of ice would be due to angle, and the angle doesn’t change significantly, only ever so slightly.