Readers may recall a story on WUWT from April titled: Solar Dynamics Observatory – STUNNING first images and movies
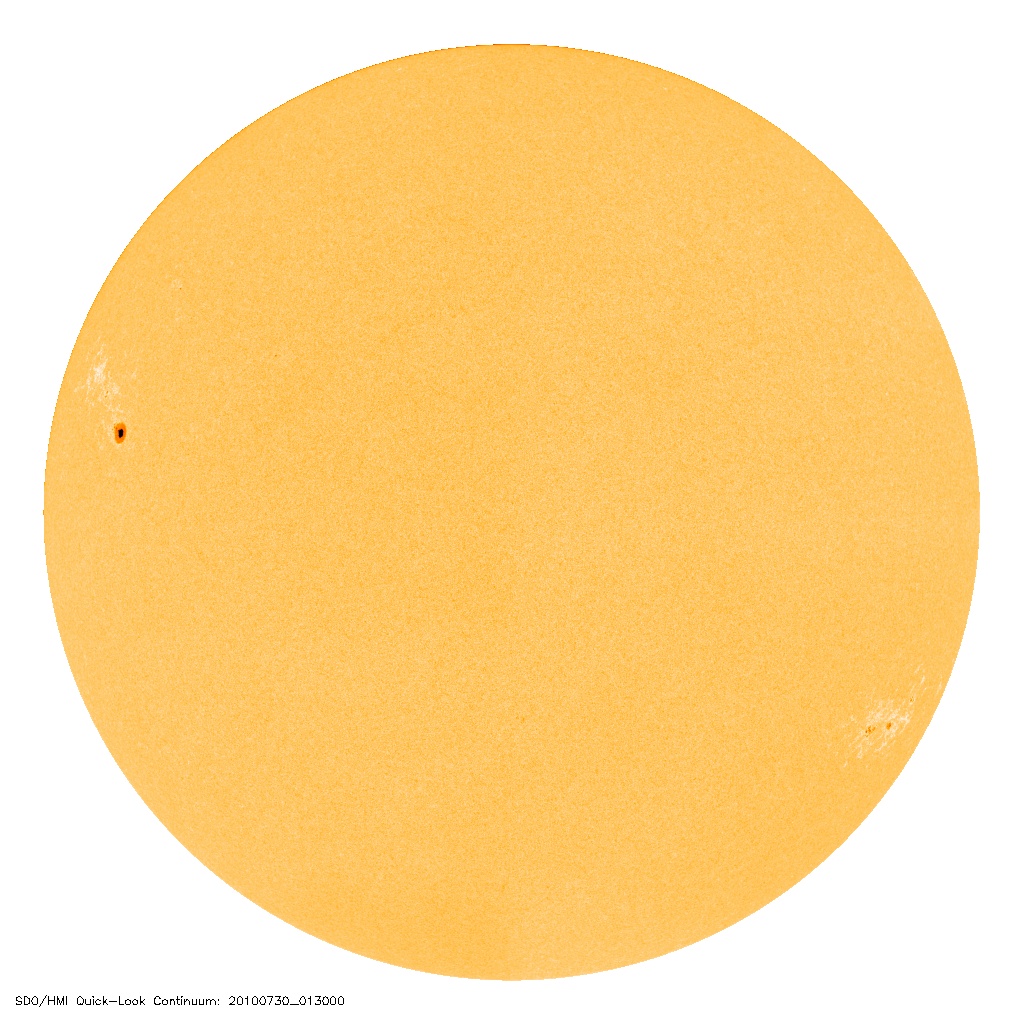
Now, SDO imagery of the sun is online. This week spaceweather.com has started using SDO sunspot imagery in place of the familiar SOHO MDI image on their left sidebar. See all resolutions: 4096, 1024, 256 The upside of the 4096 pixel image is that the detail is striking, the downside is that even tiny sunspecks are now visible in exquisite detail.

The real question now is; what will this new detail do to sunspot counts. As we saw in August 2008, when SIDC retroactively counted a sunspeck to snatch away a spotless month, will the SDO now be the new speckometer? Older telescopes and projection methods would never have seen the sunspecks we see today.
As we see with Geoff Sharp’s Layman’s Sunspot Count, both SIDC and NOAA’s counts are higher than the layman’s count. Now with SDO imagery, will even more miniscule sunspecks widen the gap between them? See the graph below comparing SIDC, NOAA, and LSC:

From Geoff Sharp’s website, here’s how the new Layman’s count works:
THE LAYMAN’S COUNT METHOD & HISTORY
There has been a lot of comments recently about the tiny specks that have been counted as sunspots. A tiny speck can get a daily count of 11 which severely skews the record. Also I have noticed on the SIDC record some days where the Sun is completely blank but the records show a sunspot count. NOAA is another magnitude higher than the SIDC, NOAA using a different method not meant to compare with the historical count. During times of high speck count we need a new standard to record sunspots that gives us a realistic measure of today’s activity verses the last Grand Minimum.
Robert Bateman a very motivated amateur solar enthusiast and myself started a thread at www.solarcycle24.com (which has unfortunately developed into an anti Landscheidt, Pro AGW forum) and soon devised a plan to come up with a reliable standard. We would use the existing SOHO 1024 x 1024 Continuum images and measure the pixels involved in a Sunspot. Initially it had to be determined what a standard sunspot should represent in size and density, to try and represent a minimum counter like Wolf may have done 200 years ago. After some deliberation and advise from Robert who also dabbles in Astronomy with his own equipment, we came up with a minimum standard.

To be counted, a sunspot or group must have 23 pixels which have a reading in the green channel of 0-70 for at least 24 hours.
All pixels in a digital image have a RGB reading which split out into separate Red, Blue, Green channels and can be easily measured and counted in one action using a freeware graphics program called GIMP.
So the standard was set, which now enabled us to go back over the records and weed out the offending specks and blank days.
The official Layman’s Sunspot Count is compared against the SIDC record which is considered conservative when compared with other institutions involved. Basically we use the same sunspot number as SIDC but replace them with zero on days that don’t make the grade. When the SIDC count is made up of two or more areas and if any of the area’s do not make the Layman’s Count, the overall SIDC daily count will be reduced by the areas that fail. Spots that count 23 pixels and over before midnight and then continue on to pass the 24 hour rule will take the SIDC value of that day. Existing Spots that have made the grade but measure less than 23 pixels at midnight are not counted on the next day.
===================================================
Unless solar science comes up with a way to deal with the advances in technology and properly merge it into the older human-optical record, the sunspot record will start looking like the surface temperature record, with upwards trends due to adjustments (or lack thereof).
I think Sharp and Bateman are on to something, and if you’ll provide me a graphic that isn’t drop shadowed onto a dark background, I’ll add it to the upcoming WUWT solar page with a link to yours. – Anthony
Leif Svalgaard says: July 30, 2010 at 11:14 pm
The sunspot counters strive very hard to use the same method as a 100 years ago. SDO will have no influence on the count. The only real difference with NOAA’s count is that NOAA does not multiply by 0.6. If one did that there is no difference between the various counts within the noise. I don’t see a problem.
Wolf did not really ‘reconstruct’ the Dalton minimum values as there was no data then. He tried to use auroral counts as a proxy, but we don’t really know within a factor of two what the sunspot number was then.
Leif, you know these guys personally… are they like really high on caffeine much of the time? Or what?
I have a suspicion that the duration of high or low sunspot numbers is more important than the actual numbers or the limit of their detection. For example, if you plot the duration of sunspots that are greater than, say, 100, you get distinct groupings.
The last 50-60 years enjoyed (if that is the right word) prolonged periods of time when sunspot numbers were in excess of this threshold. Although the records do not go back a long way, the recent activity seems to be unique in the dataset.
In the same way, you can plot the time during which sunspot numbers were below, say, 20 in number.
While there is an expected similarity between the duration and SSN graphs, the duration groupings show that sunspot cycles are themselves grouped in cycles.
I’m still playing around with different high and low thresholds. I’m sure a lot of people here can make much faster progress in looking at this duration idea and comparing it with other trends, such as temperature.
The duration aspect may be important in a Svensmark type mechanism. The longer the effect lasts, the more heating or cooling is built up.
Please, nobody tell the CRU, they will adjust the number of sunspots down to justify global warming. Mann will splice the data to give a hockey stick in the number of spots over time. The possibilities of this must be considered.
In regard to:
“RobW says:
July 30, 2010 at 9:51 pm …..
…In fact, I’m a bit surprised that the more active propagandists aren’t pushing this already.”
R Gates already stresses this. “It should be colder than it is, so therefore it’s warmer than it is.”
This new toy is the best to come around in a while. But as the more info comes in the more changes come. It is like building a airport around a MMTS station and then not taking that the jets have affected the local temperature. Just because one can look at something with better detail does not mean that the counts should change. To be consistent they still should be using the same methods that where in use 100 years ago to look at the sun for sunspot count with no change. Just like looking at a thermometer in which the surrounding have not changed in 100 years. This new toy just adds but should not change the count in anyway.
I hope Geoff and I have managed to get a particularly troublesome point across:
It is far better to measure than to count.
You can derive a count from measurements, but you cannot reliably derive a measurement from a count.
eg: I’m selling you a number of silver bars that weigh 5 lbs total. I’m charging you $900, do you like my offer?
as opposed to: I have 4 silver bars, and I’m charging you $2000 for them. How confident are you now?
Tjexcite says:
July 31, 2010 at 9:29 am
100 yrs ago, in 1910, Greenwich Royal Observatory was measuring umbra, whole spot and faculae with photoheliograms.
NeilT says:
July 31, 2010 at 2:09 am
Scientists have constantly claimed that solar output is a FACTOR in climate change but NOT a MAJOR factor in Human Driven Climate Change.
In fact if any of you science bashers had a simple lick of standard logic
Perhaps you could enlighten us with some of your standard logic how the sun plays any role in ‘Human Driven Climate Change’.
As a ham radio operator and DXer I only care about the 2800 MHz solar flux. They may be counting sun specs these days that distort the sunspot count compared to the past, but the solar flux is a measurement that hasn’t changed. The large swings in sunspot counts that I’ve seen in this cycle have not been accompanied by corresponding swings in the solar flux like I remember from previous cycles. I’ll believe cycle 24 is truly headed up when I see a steady climb in the solar flux. Numbers in the 70’s and 80’s are little more than bounces off the bottom in my book.
Actually since August 1, 2001, SDIC has been undercounting spots by about 12%. So, the sunspot number reported is TOO LOW recently. I gave a presentation on that at the recent SHINE meeting http://shinecon.org/Current%20Meeting.htm
Here is my contribution:
http://www.leif.org/research/SHINE-2010-Microwave-Flux.pdf
The notion that modern observers and organizations report a sunspot number that is too high is misplaced. This does not mean that adjustments of the very old data are not needed when we discover that such are justified by supplementary data, but there is no effort to ‘try to inflate the count’. There might be a layman effort on getting the count to be too low to support the notion that a Grand Minimum is coming.
And how are the corn prices going 🙂
comparing apples to brass
I think the “br” is superfluous.
Leif Svalgaard says:
July 31, 2010 at 2:53 pm
That is a very sore spot.
The revision of old data is where we see abuse taking place.
It’s better not to do such things.
Leif Svalgaard says:
July 31, 2010 at 2:53 pm
Actually since August 1, 2001, SDIC has been undercounting spots by about 12%. So, the sunspot number reported is TOO LOW recently. I gave a presentation on that at the recent SHINE meeting http://shinecon.org/Current%20Meeting.htm
Here is my contribution:
http://www.leif.org/research/SHINE-2010-Microwave-Flux.pdf
The notion that modern observers and organizations report a sunspot number that is too high is misplaced. This does not mean that adjustments of the very old data are not needed when we discover that such are justified by supplementary data, but there is no effort to ‘try to inflate the count’. There might be a layman effort on getting the count to be too low to support the notion that a Grand Minimum is coming.
You are all over the place Leif, when it suits your flat solar floor theory the sunspot count is 22% high. But when you want to use the L&P theory you make up your own F10.7 Flux values and state sunspots are moving away from flux and they are 12% too low.
A grand minimum will happen regardless of who is counting.
rbateman says:
July 31, 2010 at 6:02 pm
The revision of old data is where we see abuse taking place.
It’s better not to do such things.
Wolf himself adjusted his counts when he discovered that they were not correct, and one MUST adjust data that is known to be faulty. The ‘abuse’ notion is inappropriate.
Geoff Sharp says:
July 31, 2010 at 6:27 pm
You are all over the place Leif, when it suits your flat solar floor theory the sunspot count is 22% high. But when you want to use the L&P theory you make up your own F10.7 Flux values and state sunspots are moving away from flux and they are 12% too low.
It would be useful if you read the paper carefully. The 12% is what SIDC is lower than all the other sunspot counting organizations. The F10.7 values are not ‘my’ values, but is a composite agreed upon by the Japanese and Canadian observers. We have a paper coming out on this shortly.
A grand minimum will happen regardless of who is counting.
Indeed, eventually, but not this time.
ian middleton says:
July 31, 2010 at 3:18 pm
And how are the corn prices going 🙂
___________________________________________
Corn prices now depend on the whim of the cartels. It also depends on the country. If the nation has a lot of independent farmers the prices are very low to undercut the competition. Once the competition (independent farmers) is put out of business then the cartels can jack the prices up as high as the want since they have already driven out the competition. We already saw some of this in 2008 with prices doubling and food riots.
Some of these sites have a conspiracy slant but the facts are true so just ignore the tin foil hat stuff and look for the facts. Unfortunately it is difficult to find articles with a lot of info that are unbiased.
Global Food Cartel: Instrument for Starvation
Corporate Agriculture vs. Family Farmers
No End Seen to Cartel’s Destruction of Food Capacity
Independent Farmers Feel Squeezed By Milk Cartel
Control of food has been a military weapon for thousands of years. It was used by Stalin in the Ukraine and now it is being used again.
Leif Svalgaard says:
July 31, 2010 at 6:59 pm
Then you should prove that the individuals days were not counted/measured correctly, by making the drawings available.
The results need to be independently verifiable, else the historical data stands.
Leif Svalgaard says:
July 31, 2010 at 6:59 pm
A grand minimum will happen regardless of who is counting.
But you can help it come along by deliberately undercounting the spots [e.g. not count the small spots]. Perhaps that was the kind of ‘abuse’, Robert was referring to…
rbateman says:
July 31, 2010 at 8:07 pm
The results need to be independently verifiable, else the historical data stands.
As most of Wolf’s data is not based on drawings but on counts made by him or communicated to him, the data has to be independently verified by comparing with other things that directly depend on the sunspot number. A good example is the sunspot area. See http://www.leif.org/research/SPD-2009.pdf page 6. It shows a ~20% discontinuity in 1945 when Waldmeier took over the sunspot counting. You can, of course, claim that by chance the Greenwich observers changed their ways at just that time and that Waldmeier was correct and did not introduce a jump. Now, one swallow does not make a summer, so we look for more independent verifications and it turns out that there are at least six such. Again, you can claim that their historical records do NOT stand, but that only the SSN does. I’m sure that there are some people that would do just that [perhaps even you]. Me? I look at the total picture and incorporate all the solar data we have, coupled with whatever understanding we have of how they relate to each other.
When SC24 starts looking like this
ftp://fenyi.solarobs.unideb.hu/pub/HSID/Haynald/1903/19031009.jpg
or this
ftp://fenyi.solarobs.unideb.hu/pub/HSID/Haynald/1903/19030429.jpg
then I can say there is no Grand Minimum.
I don’t see SC24 doing things like that yet.
Leif Svalgaard says:
July 31, 2010 at 8:23 pm
No, Leif, I do not say the historical count is bad or the historical measurements are wrong.
I do ask for the drawings and the photoheliograms to examine digitally.
If one or both jumped in 1947, then the evidence should clearly indicate that for all to see.
Why leave doubt?
rbateman says:
July 31, 2010 at 8:48 pm
I do ask for the drawings and the photoheliograms to examine digitally.
If one or both jumped in 1947, then the evidence should clearly indicate that for all to see. Why leave doubt?
What you are saying is that the people who made the observations did not know what they were doing. The Greenwich data is available somewhere, I’m sure. The Zurich data was not based on drawings, but on counts. I’m sure one can find the handwritten counts somewhere, digitize the numbers and let everyone see that when Max wrote ’42’ it really looks like a handwritten ’42’. The people who made the observations did their utmost best to leave us the processed data. Why doubt them?
rbateman says:
July 31, 2010 at 8:48 pm
I do ask for the drawings and the photoheliograms to examine digitally.
Here http://www.leif.org/EOS/Wolf-XXXVIII.pdf Wolf explains [on page 6] the rationale for increasing all sunspot numbers before his own [starting in 1849] by 25%. This is the kind of historical record we have. On the following page he reminds us: “The comparison of the tables, and even more striking the curves constructed from them, shows yet again the parallel run of the amplitude of the diurnal variation of the magnetic needle and the frequency of sunspots”.
On page 21 you can see the format of Wolf’s data: for each day he gives two numbers like 4.7 for January 3, 1874. This means 4 groups with 7 spots, for a wolf number of 4*10+7 = 47. But since he had made the observations with his ‘pocket telescope’ he multiplies the 47 by 1.5 [his constant for that telescope] to get 70 [which you can find as the final result for Jan 3, 1874 on page 3. What you see here is the historical record.
Take another example: May 11, 1874. Here Wolf records ‘3.11’, i.e. 3 groups with 11 spots for R=41, which then is multiplied by 1.5 [his ‘pocket telescope’] for a final of 61 [he rounds down]. Greenwich for that day had:
http://solarscience.msfc.nasa.gov/greenwch/g1874.txt
1874 511.526 8500 1 0 58 0 100 0.957 265.4 248.7 -5.2 73.3
1874 511.526 8600 2 8 384 4 196 0.177 15.3 172.7 7.1 -2.7
1874 511.526 8700 7 98 807 52 427 0.328 104.1 156.7 -7.2 -18.7
1874 511.526 8800 7 0 27 0 44 0.951 294.1 244.8 21.9 69.4
and so on. The monthly means etc can easily be computed and compared [and I did that] to discover where jumps occur, and there is no ‘doubt’ as to these people doing the best they could: they could add, subtract, and even multiply.
Wolf had a threshold, he didn’t count the smaller spots/specks. Is this threshold known and was it used in mixed groups? ie as we have seen recently a group can be made up of a few large spots and also scattered with many specks, were the specks of a group counted?
Geoff Sharp says:
July 31, 2010 at 10:56 pm
Wolf had a threshold, he didn’t count the smaller spots/specks. Is this threshold known and was it used in mixed groups? ie as we have seen recently a group can be made up of a few large spots and also scattered with many specks, were the specks of a group counted?
The problem with Wolf’s threshold is that it is not quantified [or even quantifiable], not even by himself. In http://www.leif.org/EOS/Wolf-XXXVIII.pdf you can see that in 1874 July 12, Wolf counted 5 groups with total 15 spots, Weber counted 10 groups with total 108 spots. And the Greenwich catalog lists 4 groups.
For 1874 Jan 29, Wolf counted 4 groups with total 20 spots, while Weber saw 4 groups with 180 spots.
Wolfer argued that this was much too vague and advocated [which ALL reasonable observers today follow] to count everything that was visible. Differences between observers could then be handled by the ‘constant’. To put in a threshold is to bias the count from the get-go and is VERY BAD PRACTICE, but may serve your purpose well.