Readers may recall a story on WUWT from April titled: Solar Dynamics Observatory – STUNNING first images and movies
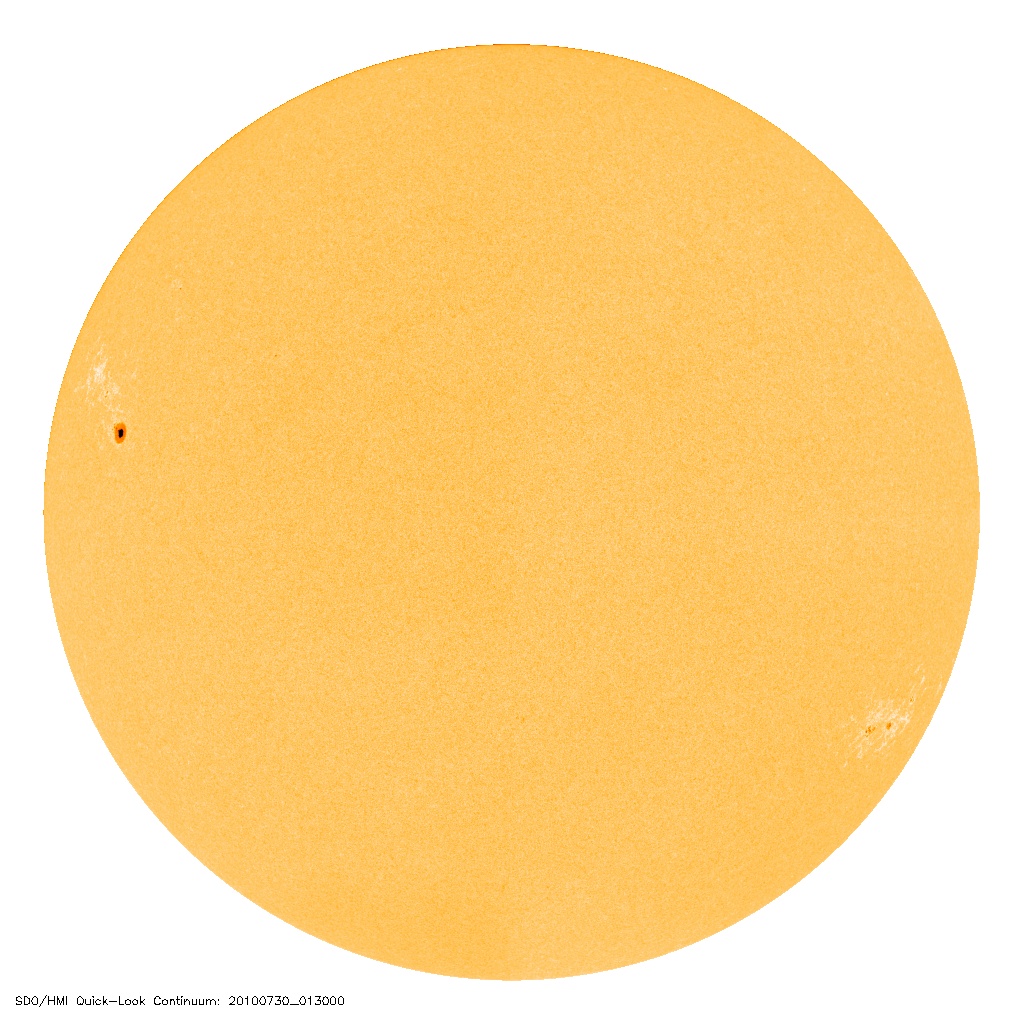
Now, SDO imagery of the sun is online. This week spaceweather.com has started using SDO sunspot imagery in place of the familiar SOHO MDI image on their left sidebar. See all resolutions: 4096, 1024, 256 The upside of the 4096 pixel image is that the detail is striking, the downside is that even tiny sunspecks are now visible in exquisite detail.

The real question now is; what will this new detail do to sunspot counts. As we saw in August 2008, when SIDC retroactively counted a sunspeck to snatch away a spotless month, will the SDO now be the new speckometer? Older telescopes and projection methods would never have seen the sunspecks we see today.
As we see with Geoff Sharp’s Layman’s Sunspot Count, both SIDC and NOAA’s counts are higher than the layman’s count. Now with SDO imagery, will even more miniscule sunspecks widen the gap between them? See the graph below comparing SIDC, NOAA, and LSC:

From Geoff Sharp’s website, here’s how the new Layman’s count works:
THE LAYMAN’S COUNT METHOD & HISTORY
There has been a lot of comments recently about the tiny specks that have been counted as sunspots. A tiny speck can get a daily count of 11 which severely skews the record. Also I have noticed on the SIDC record some days where the Sun is completely blank but the records show a sunspot count. NOAA is another magnitude higher than the SIDC, NOAA using a different method not meant to compare with the historical count. During times of high speck count we need a new standard to record sunspots that gives us a realistic measure of today’s activity verses the last Grand Minimum.
Robert Bateman a very motivated amateur solar enthusiast and myself started a thread at www.solarcycle24.com (which has unfortunately developed into an anti Landscheidt, Pro AGW forum) and soon devised a plan to come up with a reliable standard. We would use the existing SOHO 1024 x 1024 Continuum images and measure the pixels involved in a Sunspot. Initially it had to be determined what a standard sunspot should represent in size and density, to try and represent a minimum counter like Wolf may have done 200 years ago. After some deliberation and advise from Robert who also dabbles in Astronomy with his own equipment, we came up with a minimum standard.

To be counted, a sunspot or group must have 23 pixels which have a reading in the green channel of 0-70 for at least 24 hours.
All pixels in a digital image have a RGB reading which split out into separate Red, Blue, Green channels and can be easily measured and counted in one action using a freeware graphics program called GIMP.
So the standard was set, which now enabled us to go back over the records and weed out the offending specks and blank days.
The official Layman’s Sunspot Count is compared against the SIDC record which is considered conservative when compared with other institutions involved. Basically we use the same sunspot number as SIDC but replace them with zero on days that don’t make the grade. When the SIDC count is made up of two or more areas and if any of the area’s do not make the Layman’s Count, the overall SIDC daily count will be reduced by the areas that fail. Spots that count 23 pixels and over before midnight and then continue on to pass the 24 hour rule will take the SIDC value of that day. Existing Spots that have made the grade but measure less than 23 pixels at midnight are not counted on the next day.
===================================================
Unless solar science comes up with a way to deal with the advances in technology and properly merge it into the older human-optical record, the sunspot record will start looking like the surface temperature record, with upwards trends due to adjustments (or lack thereof).
I think Sharp and Bateman are on to something, and if you’ll provide me a graphic that isn’t drop shadowed onto a dark background, I’ll add it to the upcoming WUWT solar page with a link to yours. – Anthony
What is hilarious is the implication that these newly found sun spots confirm global warming. LOL. For years Hansen et al. said that the sun had little to do with climate. Now we will receive a plethora of ‘scientific’ thought on how the newly warming sun will compound the CO2 greenhouse effect.
Dusty says:
July 30, 2010 at 6:14 pm
But if someone wants to compare today with 100 years ago, that someone HAS to use the same methodology as was used 100 years ago. Otherwise they are comparing apples to brass.
The sunspot counters strive very hard to use the same method as a 100 years ago. SDO will have no influence on the count. The only real difference with NOAA’s count is that NOAA does not multiply by 0.6. If one did that there is no difference between the various counts within the noise. I don’t see a problem.
Wolf did not really ‘reconstruct’ the Dalton minimum values as there was no data then. He tried to use auroral counts as a proxy, but we don’t really know within a factor of two what the sunspot number was then.
“what will this do to the sunspot count?”
Does it matter? The sun is behaving normally. It is the people who are going beserk.
IBLS ( in before Leif Svalgaard ). Would someone please send a crashcart over to his house please, stat! 🙂
Seriously though, establishing a comparable baseline to the historical earth based optical observations is an excellent idea, a no-brainer. The fact that there is any controvery proves that many modern scientists have no common sense. Good job Robert and Geoff!
Sadly we will have to wait another 30 months to really get a feel for this cycle 🙁 I suggest people bookmark your ongoing graph, the direct url is …
http://www.landscheidt.info/images/sc5_sc24.png
It is nicely done, clearly labelled with good line/color selection. So clear in fact that you probably could fit all the cycles on there if you felt like it.
I have one question though, as I have noticed how fast the sunspots rotate out of view on that little widget here at WUWT. Is it not possible that during the 1600-1700 timeframe when there were very few eyeballs actually observing spots that a week’s worth of cloud cover could have allowed some spots to have been missed? So theoretically your Layman count could end up being a just tad higher than that of a 17th century style observation (but of course you will still be way closer than the ultra high-tech count-every-spec approach).
Perhaps as an experimental ‘control’ a few actual optical telescopes should be erected and utilized at the same locations as those used by those early pioneers.
The SDO sunspot images are very nice indeed, and a welcome supplement to the old SOHO images. However, I would not say that images such as the 4096 image is particularly detailed. The image size is big, but that is not the same as resolution.
Many amateur astronomers has for years been able provide similar resolution for sunspot images (admittedly with a smaller field of view), using standard amateur equipment, a webcam and free software. See for example my voyage to sunspot 649, August 12, 2004. These are simple backyard images.
What will SDO do to sunspot counts? Not much if people go by the rules. The sunspot count is not supposed to be inferred from images taken from space. Sunspot counts are supposed to be based on visual observations from the ground, using small refractor telescopes like Wolf used. Somehow I suspect that the count is more influenced by ground based observatories that may be counting spots in images, and that is a whole different game compared to visual observation. I have tried both.
Sunspots are a (pretty accurate) proxy for magnetic activity. Imagine that instead of having the zero base at the bottom of the sunspt cycle graph, a zero line through the approximate middle of the graph. Now you have something that looks like an alternating current graph. An AC will, at least here on earth, transfer energy from one coil (iron core helps) to another. What if the oscillations in solar magnetism could directly transfer energy to the earth through the magnet field in a similar same way. The frequency of the oscillations (sunspot cycles as a proxy) controls the efficiency of the transfer of energy…slowing the oscillations to the equivilant of DC cuurent, no energy is transfered…..just a thought.
rbateman says:
July 30, 2010 at 10:58 pm
Geoff:
The SDO images that Anthony links to, Red Channel gives the umbra, Blue Channel gives the Whole Spot, and Green Channel gives both.
Hi Robert, I have been waiting for the SDO continuum images to be measurable, the SDO website is down me now, but perhaps they are getting close to something.
So, let me see if I get this: The whole idea behind an artificially high count is nought but to dismiss the matter of the current Solar minimum as having an affect upon Earth’s weather.
Whereas priorly, Sunspots were defined in a specific way understood by all whom were engaged in that field of endeavor, and because the current low number of those —conventionally counted— spots is seen as an indicator of likely affect, then those who’ve connived to counting what amounts grains of dust in order to influence matters, will now declare that there really is ‘no minimum’ and use that to detract from the argument put forth that a minimum is actually taking place, and having real affect.
Isn’t that kinda sorta the same thing Mr. Mann did with the tree rings? He used them to erase the existence of the Medieval Warm Period and the follow-on Little Ice Age from the climate record.
But then when the ‘decline’ started to go against even his own prognostication, why he ‘married’ the instrument record to the tree ring record and got his hockey stick. Yeah!
So then, I see the very same thing happening here: By counting spurious blemishes on the Sun’s photosphere, and using them to artificially inflate the number of actual spots, the argument that there’s a minimum happening will be dismissed.
So, I make the following prediction: With that artificial count in hand, there will no doubt be a paper forthcoming which will thence declare that:
[1] No deep minimum is happening
[2] No minimum in the past has ever affected Earth’s climate and weather patterns
[3] Because of the higher count now made possible by ‘better’ technology, that the Sun is actually behaving just as it always has, and is in fact a steady-state source of energy, have little —if any— radical effect upon the Earth’s climate and weather, much beyond solar flares.
[4] Any further talk about a Solar minimum will thence be dismissed as just so much pseudoscience put forth from the ‘deniers.’
So, by attempting to take away our argument, they will expose their real mission and purpose.
Whilst I never expected to get any kind of rational debate on this site I’m still amazed at the dogged determination of some people to trash “any” science.
In fact if any of you science bashers had a simple lick of standard logic, much less higher science; you would realise that these results Intensify the current climate conclusions rather than deny them.
[snip]
Point1: MORE solar output is being reported for the SAME results monitored on the sun
Point2: It is being reported that we are at the LOWEST solar output and solar minimum than the Maunder Minimum.
Yes that is the LOWEST output with MORE output being reported.
Then we come to the second part.
We are reporting the highest temperatures ever recorded by humans
We are reporting more “ice” loss (volume) than ever seen before
People who grew up in hot countries and live with drought all their lives are dying of the excess heat.
Scientists have constantly claimed that solar output is a FACTOR in climate change but NOT a MAJOR factor in Human Driven Climate Change.
I’m just waiting for the solar output to peak in this 11 year cycle then we won’t have all these arguments about area/extent/volume. Because we won’t have any arctic ice in summer and the only two things we’ll be worried about is how much solar energy that open ocean can suck up and how little ice we have in WINTER.
The only “guaranteed” way to replicate Wolf’s results and then map them to curernt equipment is to buy/build the exact same equipment Wolf used and then get Wolf to interpret the results. Because if he had left an exact formula, there wouldn’t be statements like
“to try and represent a minimum counter like Wolf may have done 200 years”
Try? May? All the hot air about KNOWING and being CERTAIN above and the statement is TRY and MAY.
The IPCC is MUCH more certain than TRY and MAY.
Welcome to the world of science.
There is a reason why this site is called wcwt by people who tell the truth and know how to reason logic.
Leif Svalgaard says:
Well, I also don’t see a problem, but I see a potential problem. One thing that has been standing out over the last few years is dishonest use of raw data for confirmation bias. Since it’s so much easier to see smaller specks, some people seem to want to include them in a count.
Obviously there is nothing wrong with that, increased resolution means increased details. The problem is when it comes to comparing data gathered with new technology to data gathered with old technology. They are not compatible.
The same thing is happening in some other fields due to film vs. digital imagery. Film is grainy, dirty, warm, and analog, subject to vagaries, discontinuities and some randomness. Digital equipment can be extremely precise with very well understood spectrum response and repeatability in image gathering. If you want to compare a digital image with a film image you have to dirty it up and step away from the new technology, add grain, add randomness, etc.
Sometimes new data gathering techniques make us completely forget about the uncertainty of older techniques, and we tend to assume that quality of data was always as good as what we’ve become accustomed to.
Great work Rob and Geoff. Thanks for highlighting it Anthony.
Two points.
A. Anthony, would you please arrange a sun page, along the lines of your excellent polar ice page? Including please Lief’s graphs as updated (I think the ones I have an address for are rather spasmodically updated).
B. For most of us it’s a no-brainer to have the modern counts expressed in a way that enables some sort of comparison with the earlier max/minima. So Spots, Specks, Motes whatever. Equally obviously the new high res views is a must: it may enable someone to work out the underlying causes of sun thingies.
Geoff and Robert
GREAT WORK
SDO and SOHO images aren’t used for sunspot count als already mentioned many times here. Really disappointed in this articles. Looks a lot like AGW panic.
This is a simple matter of setting a standard apparent angular size for sunspots in arc-seconds, based on the angular resolution of instruments used in the past to count them. If the angular size of a spot measures or exceeds “X” arc-seconds, then it should count. Nothing could be simpler jeez.
The image below is the last one I photographed, back in 2005 – Sunspot #822 using a 76 mm telescope:
http://www.josesuroeditorial.com/photos/56566196_ynhWc-X3-1.jpg
NeilT says:
“We are reporting the highest temperatures ever recorded by humans
We are reporting more “ice” loss (volume) than ever seen before
People who grew up in hot countries and live with drought all their lives are dying of the excess heat.”
All three of those statements are wrong.
Vostok, Law Dome, etc., show much higher temperatures in the geologic record.
The Arctic has been ice-free in pre-SUV times.
A 0.7°C increase in global temperature over the past 150 years is not killing anyone from the “excess heat.”
Kirk Myers says:
July 30, 2010 at 7:32 pm
Geoff Sharp’s Landscheidt.org is a must-visit site. It offer a nice graphical comparison chart of SC5 (1798), SC14 (1902) and SC24 (2008) sunspot counts. Currently, SC24 numbers are tracking just under the SC5 count. SC5 marked the beginning of the Dalton Minimum (1790 -1830) and much colder global temperatures
SC5 began in May 1798, See http://en.wikipedia.org/wiki/List_of_solar_cycles
so I’m not sure how SC5 marked the beginning of soething which began in 1790. On the subject of much colder temperatures during the Dalton Minimum, in this paper by David Archibald
http://www.davidarchibald.info/papers/Solar%20Cycles%2024%20and%2025%20and%20Predicted%20Climate%20Response.pdf
there is a graph by on Page 5 which shows 1770-1840 temperature data plots of CET, De Bilt and Oberlach. De Bilt and CET shoew tmepratures were just as low in the mid 1780s as they were throughout the Dalton Minimum period. Oberlacjh deos have a slightly sharper dip but this seems to coincide with the Tombura eruption in 1815.
It seems that, in the late 18th and early 19th centuries, earth’s climate was responding a decade or so before a solar grand minimum. I suppose you could call it a sort of negative lag time. Though, if we look at the CET record over a longer period. e.g.
http://hadobs.metoffice.com/hadcet/
We note there is nothing particularly remarkable about the 1790-1820 period. It’s the same story when we look a to other records such as Uppsala. Temperatures were half a degree or so below par in the early 19th century but that wasn’t unique to that period.
Thank you Rob and Geoff.
[youtube=http://www.youtube.com/watch?v=U6tV11acSRk&hl=en_US&fs=1]
NOAA starts counting anything when it is a slow hurricane season.
I wonder what they will count this year?
They also have a habit of rounding up if they need another hurricane on the books.
I wonder how they made this the hottest global year on record when we had a very cold winter and each month in the USA was not the top ranking for this decade?
I wonder if somewhere in the world is some global warming alarmist is rubbing the thermometer?
It is easy to have a high Accumulated Cyclone Energy count when the hurricanes float around at sea. Seems like a bogus formula.
Hmmm!
Paul Pierett
RobW says:
July 30, 2010 at 9:51 pm
That was a rhetorical question right? Of course the team and co. will use the never before observable pin pricks in the count.
Why would they do this? I cannot see the logic. Surely they’d like to take the opportunity to show that even with a low sunspot count we still get high temperatures. In fact, I’m a bit surprised that the more active propagandists aren’t pushing this already.
The “tiny tims” of sunspots has arrived. I sure hope some group carries on with the old ways. Splicing data sets as technology changes has it’s downside.
Geoff and Robert deserve our gratitude for this effort. Elitism is seemingly on the defensive everywhere?
Love the current initiative. Great work.
I think the future sunspot count should be done using the most accurate method. That said, it should also be done the way we’ve been doing it for the past 4 or so decades so we have a running record based on the same criteria.