By Steve Goddard
July 4, 2010. Celebrating independence from traditional sources of polar ice news.
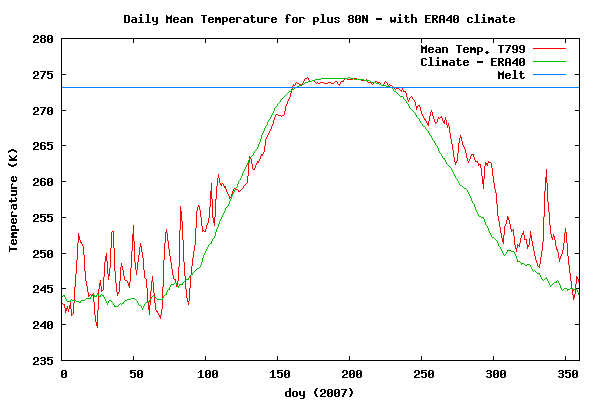
Last week we discussed the importance of wind in determining the summer minimum. In 2007, the winds blew consistently from the south and compacted the ice towards the North Pole. This led to a tremendous amount of news coverage claiming that the Arctic was heating and melting. In fact – the spring and summer of 2007 was slightly cooler than normal for about half of the melt period north of 80°N, according to DMI (below)

http://ocean.dmi.dk/arctic/plots/meanTarchive/meanT_2007.png
Around mid-June of this year, the winds in the Arctic set up in a similar pattern – spiraling inwards and pulling the ice away from the coast. This led to an early decline in ice extent inside the Arctic Basin.

Towards the end of June, this pattern reversed and now the winds are circulating counter clockwise – pushing the ice towards the coasts. As a result, there has been very little change in extent inside the Arctic Basin over the last week.

You can see the changes in extent in the modified NSIDC map below. Areas marked in red show extent loss since June 27, and green shows extent gain.

Most of the ice loss over the last week has been in the Hudson Bay, which nearly melted out a few days ago. As a result of the Hudson Bay being depleted of ice and the changes in wind, we have seen the JAXA and DMI graphs take a break in slope.

http://ocean.dmi.dk/arctic/icecover.uk.php

http://www.ijis.iarc.uaf.edu/seaice/extent/AMSRE_Sea_Ice_Extent.png
Since July 1, there has been almost no ice loss in the Arctic Basin, as seen in the modified NSIDC image below.

The video below shows the wind and ice patterns over the last two weeks, culminating in a strong counterclockwise flow.
The modified NSIDC image below show differences between 2010 and 2007. NSIDC still shows 2007 ahead of 2010, but the differences are mainly in the Hudson Bay and other areas that normally have little or no ice in September. In the Arctic interior 2010 has more ice (green.)

Last week I made the forecast below for the remainder of the summer.
The image below shows current JAXA in pink vs. my forecast. So far, the forecast is right on track.

Temperatures north of 80N have been running slightly below normal for several weeks. The summer melt season is nearly half over. There are less than 60 days remaining of possible melt in the high Arctic.
")
http://ocean.dmi.dk/arctic/meant80n.uk.php
Temperatures in Barrow have also been running below normal. It appears quite possible that the landfast ice breakup date at Point Barrow will beat the record for the latest ever (July 10.)
Meanwhile down south, as Anthony pointed out, Antarctic sea ice is at a record high for the date.
")
Global sea ice is close normal.

http://arctic.atmos.uiuc.edu/cryosphere/IMAGES/global.daily.ice.area.withtrend.jpg
So what do the experts tell us?
The North Pole has become an island for the first time in human history.
Leading ice expert says entire Arctic Ocean sea ice may be gone sometime between August 8th and September of this year. (H/T to Tom Moriarity.)
Hopefully Lewis Pugh is waxing up his kayak to take advantage of the clear paddling to the North Pole next month.
On this July 4th, we celebrate the freedom provided by the Internet to propagate the accurate information which governments apparently don’t want us to know.
stevengoddard says:
July 5, 2010 at 3:31 pm
EFS_Junior
I think there is 100% probability that the minimum will be >= 0.
Now how about producing an actual prediction?
______________________________________________
I did.
3.9E+6 km^2 (sigma = 0.51E+6).
Since you don’t appear to understand probability of exceedance and CDF, it goed something like this;
There is a 50% chance (even money) that the Arctic sea ice extent minimum will be either above 3.9E+6 km^2 or below 3.9E+6 km^2.
There is a 68% chance (+/- one sigma) that the Arctic sea ice minimum will be between 4.4E+6 km^2 and 3.4E6+6 km^2.
So, for you, if you need a single number, than as stated above, that single number, for Arctic sea ice extent minimum, would be;
3.9E+6 km^2.
BTW, based on JAXA statistics (2003-2010 inclusive)..
Yes, I remember being taught that as a small child by the nuclear physicist who lived in our house. ;^)
Smokey says:
July 5, 2010 at 7:05 pm
stevengoddard,
Are you certain about that?
°
☺
Maybe!
The Heisenberg principle is sometimes misused as if it were an equivalent to the Observer Effect, which it isn’t.
David says:
July 5, 2010 at 3:08 pm
Curious Yellow says:
July 5, 2010 at 6:37 am
“You really need to take a closer look at how previous season melts have gone to spot the flaw in this argument. The bottom line is that where there has been a high early season ice loss, the ice loss from July onwards is always far lower. This year we have seen a very large early season ice loss so I predict a much slower rate of loss for the rest of the year.
It wouldn’t surprise me if the average daily ice loss for the remainder of the season is well below the 2003-2009 average and the minimum extent in the 5-5.3 million sq km range.”
———————
Yes, I did have a closer look, pondering the question, what constitutes an early melt season. So first I looked at 1 May to 30 June and two things stand out; 2003 and 2004 with a low melt of 2.8 and 2.35 million KM2 respectively. The other outstanding is 2010 with a melt of 4.24 million KM2. The years in between 2005-2009 had melts between 3.03 and 3.33 million KM2.
Okay, so this is not the earliest part, so I looked at start of melt season to 30 April.
Here again 2003 and 2004 and 2008 had the highest early melt of 1.97, 1.87 and 1.64 respectively. Strangely though, some people refer to 2006 as a reference for 2010 as to what may happen. Yet 2006 had an average start to 30 April melt of 1.33 and an average 1 May to 30 June of 3.03 million KM2. Indeed, 2006 had the lowest melt of 3.5 million KM2 between 1 July and end of melt. However, the association of an early melt followed by a slowing late melt does not seem to be correct. I think that years prior to 2007 had much more multi-year ice than 2010 which is now affecting the melt pattern. Also, the late melt start of 2010 needs some qualification; if compared with the melt start date of 2009, March 5, 2010 started 25 days later. However, on March 5 2010 the extent was 14.31 million KM2 and on March 31 14.4 million KM2, a difference of 90,000 KM2 or a days melt. Perhaps less, because this late March ice must have been very thin indeed.
stevengoddard says:
July 4, 2010 at 11:45 pm
Anu,
The Arctic summer is nearly half over.
http://climateinsiders.files.wordpress.com/2010/07/meant_2010-4.png
Meteorological summer starts on June 1 and ends in August.
I guess you missed the part of my post which showed that in 2007, the Arctic melt continued throughout the actual summer, into autumn.
And in 2009, Arctic melt continued until September 13 – again, following actual summer. Arctic sea ice doesn’t really care what meteorologists call “summer”, and melt continues until about the autumn equinox.
http://iup.physik.uni-bremen.de:8084/amsr/ice_ext_n.png
See how the ice always continues to melt into September, and in recent years, even later into September ?
http://earthobservatory.nasa.gov/IOTD/view.php?id=42456&src=eoa-iotd
I’m sorry that you are confused about my prediction. Most people here don’t have difficulty understanding simple graphs.
If your second prediction is your final one, that’s fine, but your comment leads me to believe you will be fine tuning your “prediction” all summer:
You seem to be really nervous that I will be correct.
I’m just hoping you keep predicting a summer minimum above that of 2009, so I can give you grief this autumn. If you keep changing your “predictions” to be closer to mine every few weeks, it won’t be fun if we are both correct in late September.
stevengoddard said
July 5, 2010 at 12:02 pm
NSIDC 2010 will cross over 2007 tomorrow or Wednesday. Make a note!
You’ve jinxed it again like you did in March. Jaxa just took a 100k+ drop so I think NSIDC’s 5 day average will keep it parallel for a short time yet. 2007 has some big days from the 10th onwards so I’d estimate this weekend.
Andy
Anu
Sorry. You are misrepresenting what I said, and I have no respect for people who do that.
Anu:
Sept 2007 had a Lower minimum later in the month:
from JAXA extent: http://www.ijis.iarc.uaf.edu/seaice/extent/plot.csv
09,13,2007,4323750
09,24,2007,4254531
Extent Update: 2010 widening its lead on 2007 again:
Comparing _____2007___ to___ 2010
Ahead July 4 _____ no_______ 222,813 km2
Daily Change:
July 4-5 ___ – 89,844 _____-102, 969
July 5-6 ___ – 93,125 _______ ? ?
Biggest Gains relative to Average, were in the Laptev Sea/New Siberian Isand area, where the Great Polynnya of 2007 expanded from.
And the Wrangel Island area East of the Bering Strait Open water, which has expanded North rather than NW & thus is lagging 2007 there.
>> Central Basin continued its INCREASE (!) in Ice, presumably because of the high Winds this year.
If my prediction is right, the minimum should occur on 8th August (!)
Looks like my forecast may have been too conservative.
[youtube=http://www.youtube.com/watch?v=rJVhVD83plE]
stevengoddard says:
July 5, 2010 at 10:40 pm
Anu
Sorry. You are misrepresenting what I said, and I have no respect for people who do that.
I blockquoted your entire comment.
If you can’t write what you mean, and have it remain online for people to read days and months later, you shouldn’t be blogging.
Dr. Hansen has no respect for people like you, but he still writes clearly and explains his past statements.
Anu,
What is it that you are trying to accomplish? You aren’t saying anything even remotely interesting to the vast majority of readers. The rest of us are discussing science here.
Charles Wilson says:
July 5, 2010 at 10:43 pm
Anu:
Sept 2007 had a Lower minimum later in the month:
from JAXA extent: http://www.ijis.iarc.uaf.edu/seaice/extent/plot.csv
09,13,2007,4323750
09,24,2007,4254531
Yes, I mentioned the last day of 2007 melt in my comment :
Anu says: July 4, 2010 at 11:28 pm
My comment Anu says: July 5, 2010 at 9:38 pm mentions the last day of 2009 summer melt. The last day bounces around a bit in mid to late September.
http://earthobservatory.nasa.gov/IOTD/view.php?id=42456&src=eoa-iotd
The trend is for the melt season to get longer and longer.
p.s.
Good luck with your prediction on the Arctic summer sea ice minimum – unlike everybody else commenting on WUWT, you put together a reasoned prediction and submitted it for the world to see:
http://www.arcus.org/search/seaiceoutlook/2010/june (click Pan-Arctic tab)
http://www.arcus.org/files/search/sea-ice-outlook/2010/06/pdf/pan-arctic/wilsonjuneoutlook.pdf
I’m just predicting less than 2009 (I don’t think 2008 and 2009 are part of a new “up cycle” as some people say, just annual variability on the downward trend) – I think your prediction of 1 million sq km is too low, but I respect you for making a prediction and not changing it every few weeks.
Anu,
I get it. You have realized that my forecast of 5.5 is likely correct, so you are trying to make up some BS claiming I keep changing it.
Two problems with that. 1. It is an incredibly lame idea. 2. The only forecast I have made is 5.5.
stevengoddard says:
July 6, 2010 at 10:49 am
Anu,
I get it. You have realized that my forecast of 5.5 is likely correct, so you are trying to make up some BS claiming I keep changing it.
It’s not like the Internet forgets what you say, Steve (even if Anthony starting deleting old threads, which as far as I know he never does, Google cache will still have it).
I’ll let the reader decide if your “Conclusion” was a “prediction” or not:
(and yes, there are no guarantees in predicting the future, fine)
It wasn’t a bad prediction for you, since you seem to feel 2007 was just ‘unusual weather’, and 2008 and 2009 are “recoveries” from that unusual year. Expecting a return to the 2003/2006 levels (close to 6 million sq. km.) would be logical for you, given your dismissal of global warming.
My prediction has always been “less than 2009” for the opposite reason:
http://nsidc.org/images/arcticseaicenews/20091005_Figure3.png
I think the downward trend caused by global warming is continuing, and the years scatter above and below the trendline – the probability is very high that 2010 will be lower than 2009. If I am wrong in late September, I will gracefully admit it, and not try to weasel out with some excuse like “but the wind didn’t do what I expected from August 23 to 29!”
Two problems with that. 1. It is an incredibly lame idea. 2. The only forecast I have made is 5.5.
If you stick with your revised 5.5 million sq km prediction, that will be fine with me. I’ll let the first “Conclusion” prediction slide. You are still predicting a summer minimum higher than in 2009, and I am predicting one lower than in 2009. You are putting some faith in the PIPS 2.0 ice thickness model and your understanding of unpredictable winds compacting low concentration sea ice, and I can respect that. Disagree, but respect.
Perhaps I misunderstood your comment of I see no reason to raise my estimates yet. I will evaluate again in two weeks.
If you stick with your prediction of 5.5 million sq km for the whole summer, then I can look forward to you being embarrassed in late September, which will make it more fun to keep tabs on the summer Arctic melt.
IARC-JAXA:
09/13/2009 (lowest day of summer melt) was 5,249,844 sq. km.
There you go again – “updating my predictions”.
I hope you are not going to weasel out of your 5.5 million sq km prediction by summers end.
But I suppose if you return to your original 6 million sq km prediction in the next few days, no harm, no foul.
Just don’t jump on my bus and start “predicting” less than 2009.
Anu
Your rhetoric becomes more desperate and more lame every day.Why do you bother?
stevengoddard says:
July 6, 2010 at 10:27 am
Anu,
What is it that you are trying to accomplish? You aren’t saying anything even remotely interesting to the vast majority of readers. The rest of us are discussing science here.
—————————
I have come to this site quite recently in order to get an insight into climate change d[~snip~ Try again without using the inappropriate D-word. ~dbs, mod.]
Casper says:
July 6, 2010 at 1:47 am
If my prediction is right, the minimum should occur on 8th August (!)
—————————
Just as well you used the illusionary ‘if’, supported with the wishful ‘should’.
AndyW says:
July 5, 2010 at 10:08 pm
stevengoddard said
July 5, 2010 at 12:02 pm
NSIDC 2010 will cross over 2007 tomorrow or Wednesday. Make a note!
You’ve jinxed it again like you did in March. Jaxa just took a 100k+ drop so I think NSIDC’s 5 day average will keep it parallel for a short time yet. 2007 has some big days from the 10th onwards so I’d estimate this weekend.
————————-
What crosses a line today may cross back tomorrow. Is this really sensible, seems like gloating to me. Series of high melt days are not predictable; they are at the command of the weather, currents and temperature.
Here’s a different perspective looking at 2009.
To melt the first million KM2;
Took 2009 48 days and 2010 26
The second million
2009 23 days – 2010 13 days
The third million
2009 16 days – 2010 15 days
The fourth million
2009 20 days – 2010 15 days
The fifth million
2009 14 days – 2010 15 days
The sixth million
2009 12 days – 2010 12 days
Between 31 March and 6 July 2010 melted 5.96 million KM2
Over the same period 2009 melted 4.85 million KM2
Difference 1.09 million KM2
The 2009 melt started 5 March, 26 days earlier than 2010 and during these days the melt was 447,000 at an average of 17,000 KM2/day
This melt season 2010 has melted 5.96 million KM2 @ur momisugly 61456 KM2/day (97 days)
2009 melted 5.29 million KM2 @ur momisugly 43037 KM2/day (123 days)
As I said lines that are crossed, can be re-crossed. Seems to me that it is still a question as to whether the minimum will be between 2007 and 2008, with still an outside possibility of ending below 2007. 4.33 still seems reasonable.
Curious Yellow says:
July 7, 2010 at 5:00 am
stevengoddard says:
July 6, 2010 at 10:27 am
Anu,
What is it that you are trying to accomplish? You aren’t saying anything even remotely interesting to the vast majority of readers. The rest of us are discussing science here.
—————————
I have come to this site quite recently in order to get an insight into climate change d[~snip~ Try again without using the inappropriate D-word. ~dbs, mod.]
————————–
Censored? What’s good for the geese is not good for the gander?
I get the message. Still curious though. Last post.
[Reply: The rules are in the Policy on the mast head. “Censored” refers to government action. Like GISS/RealClimate’s policy. ~dbs]