By Steve Goddard
July 4, 2010. Celebrating independence from traditional sources of polar ice news.
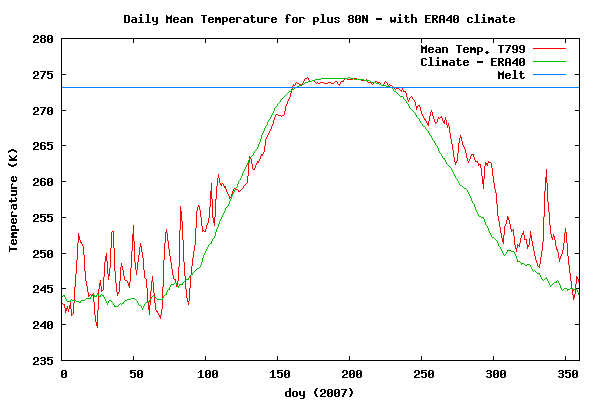
Last week we discussed the importance of wind in determining the summer minimum. In 2007, the winds blew consistently from the south and compacted the ice towards the North Pole. This led to a tremendous amount of news coverage claiming that the Arctic was heating and melting. In fact – the spring and summer of 2007 was slightly cooler than normal for about half of the melt period north of 80°N, according to DMI (below)

http://ocean.dmi.dk/arctic/plots/meanTarchive/meanT_2007.png
Around mid-June of this year, the winds in the Arctic set up in a similar pattern – spiraling inwards and pulling the ice away from the coast. This led to an early decline in ice extent inside the Arctic Basin.

Towards the end of June, this pattern reversed and now the winds are circulating counter clockwise – pushing the ice towards the coasts. As a result, there has been very little change in extent inside the Arctic Basin over the last week.

You can see the changes in extent in the modified NSIDC map below. Areas marked in red show extent loss since June 27, and green shows extent gain.

Most of the ice loss over the last week has been in the Hudson Bay, which nearly melted out a few days ago. As a result of the Hudson Bay being depleted of ice and the changes in wind, we have seen the JAXA and DMI graphs take a break in slope.

http://ocean.dmi.dk/arctic/icecover.uk.php

http://www.ijis.iarc.uaf.edu/seaice/extent/AMSRE_Sea_Ice_Extent.png
Since July 1, there has been almost no ice loss in the Arctic Basin, as seen in the modified NSIDC image below.

The video below shows the wind and ice patterns over the last two weeks, culminating in a strong counterclockwise flow.
The modified NSIDC image below show differences between 2010 and 2007. NSIDC still shows 2007 ahead of 2010, but the differences are mainly in the Hudson Bay and other areas that normally have little or no ice in September. In the Arctic interior 2010 has more ice (green.)

Last week I made the forecast below for the remainder of the summer.
The image below shows current JAXA in pink vs. my forecast. So far, the forecast is right on track.

Temperatures north of 80N have been running slightly below normal for several weeks. The summer melt season is nearly half over. There are less than 60 days remaining of possible melt in the high Arctic.
")
http://ocean.dmi.dk/arctic/meant80n.uk.php
Temperatures in Barrow have also been running below normal. It appears quite possible that the landfast ice breakup date at Point Barrow will beat the record for the latest ever (July 10.)
Meanwhile down south, as Anthony pointed out, Antarctic sea ice is at a record high for the date.
")
Global sea ice is close normal.

http://arctic.atmos.uiuc.edu/cryosphere/IMAGES/global.daily.ice.area.withtrend.jpg
So what do the experts tell us?
The North Pole has become an island for the first time in human history.
Leading ice expert says entire Arctic Ocean sea ice may be gone sometime between August 8th and September of this year. (H/T to Tom Moriarity.)
Hopefully Lewis Pugh is waxing up his kayak to take advantage of the clear paddling to the North Pole next month.
On this July 4th, we celebrate the freedom provided by the Internet to propagate the accurate information which governments apparently don’t want us to know.
Spartacus:
I thought the earth’s “nutation” refered to the warm-earthers’ brain anomalies. Now you have enlightened me that it is a bona fide scientific term.
But…”I’m Spartacus!”
Steve Goddard said in update 12:-
Last week we discussed the importance of wind in determining the summer minimum. In 2007, the winds blew consistently from the south and compacted the ice towards the North Pole.
How much was compacted compared to being melted in situe by the southerly warm winds? Your sentence seems to indicate it is just the direction of the wind that caused the reduced extent on the Siberian side.
Andy
Marlene Anderson:
July 4, 2010 at 12:33 pm
Maybe this video will help you understand a little more about weather in Canada. El Nino made it warm in Vancouver (and in the western 1/2 of Canada) for the Olympics. And if La Nina develops it will be a cold winter there; the opposite of last year.
Steve,that’s not ‘symmetrical’, and most importantly,nowhere in the text does Hansen use those words. You must consider the text as well as figures…and the fact that model inputs are more refined two decades later.
stevengoddard says:
The summer melt season is nearly half over. There are less than 60 days remaining of possible melt in the high Arctic.
Sure, it might seem like the Summer is half over, but it’s only psychological, Steven. Probably related to the World Cup.
Summer started June 21 in the N. hemisphere. Day 172 of the year:
http://www.soils.wisc.edu/cgi-bin/asig/doyCal.rb
You posted on July 4: day 185 of the year.
13 days is not “The summer melt season is nearly half over”. Unless you stretch the meaning of “nearly”…
Autumn starts September 23 this year, btw. Day 266. 81 days from July 4.
There are less than 60 days remaining of possible melt in the high Arctic.
The last day of summer melt vary slightly summer to summer – in 2007, it was September 24 – day 267.
That would be 82 more days of “possible melt”.
Did this occur in the “high Arctic” ?
Here’s September 20:
http://iup.physik.uni-bremen.de:8084/amsredata/asi_daygrid_swath/l1a/n6250/2007/sep/asi-n6250-20070920-v5_nic.png
And now September 24:
http://iup.physik.uni-bremen.de:8084/amsredata/asi_daygrid_swath/l1a/n6250/2007/sep/asi-n6250-20070924-v5_nic.png
Yup, definite melt above the 80° N latitude. The sun warmed ocean water causes bottom melt, and together with sunlit top melt, the summer-thinned ice disappeared up to September 24. In the high Arctic. Oh yeah, and the wind was blowing, somewhere…
I wouldn’t want you to miss the dramatic end of the 2010 melt season.
Mark your calendar.
My prediction is still “less sea ice extent minimum than in 2009, IARC-JAXA measured”.
Are you still predicting
same as 2003 and 20065.5 million sq km ? Or are you going to make your “real” prediction on September 15 ?stevengoddard says:
July 4, 2010 at 6:15 pm
Gail,
I’m going to write up an article pointing out how important high concentration is towards limiting the summer minimum.
This is how I misread that line at first 🙂
I can imagine Steven trying to concentrate on limiting the summer minimum:
http://access.nuim.ie/files/images/hand_head.jpg
Good luck with that.
Works with goats.
Anu,
The Arctic summer is nearly half over.
http://climateinsiders.files.wordpress.com/2010/07/meant_2010-4.png
Meteorological summer starts on June 1 and ends in August.
I’m sorry that you are confused about my prediction. Most people here don’t have difficulty understanding simple graphs.
[youtube=http://www.youtube.com/watch?v=RweRX-U3zv8]
You seem to be really nervous that I will be correct.
Nick
Hansen predicted North Pole at +2.0-2.5 and South Pole at +2.0-2.5 in “2010s”. That is symmetrical, and a far cry from South Pole cooling.
He was wrong.
Lets Put the Melt in Perspective with NUMBERS:
Numerically, Sea Ice Extent: http://www.ijis.iarc.uaf.edu/seaice/extent/plot.csv
Comparing _____2007___ to___ 2010
Ahead June 30____ no_______ 569,532 km2
Ahead July 4 _____ no_______ 209,688
Monthly Melt Average:
June 1-30 ___ -65,150/day __ – 75,496 square km
Jun30-Jul31__ -98,610/day _____ ?
7/31-minimum = 6,409/day _____ ? (55 days in 2007)
Daily Loss in Extent:
June 30-7/1 _ – 169,061_____ – 56,093
July 1-2 ___ – 162,031_____ – 82,969
July 2-3 ___ – 201,875_____ – 47,656
July 3-4 ___ – 130,937 _____ – 91,563
July 4-5 ___ – 89,844 _______ ? ?
July 5-6 ___ – 93,125
July 6-7 ___ – 81,650
July 7-8 ___ – 74,844
… 2010 got way ahead from Melting off Hudson Bay early, but then 2007 did, so it over halved the margin.
2010 is still the record.
So this is Steve’s ‘ running a little ahead of my projections ” – – You forecasted ABOVE NORMAL Steve
— A RECORD LOW is a ‘Little bit ahead’ ?.
But the Real News is in the yellow area in the first Ice Concentration Chart
— the SPECTACULAR “swing” of the densest Ice from looking like a long line stetching Westwards to one almost North-South. A little clearer here: http://iup.physik.uni-bremen.de:8084/amsr/amsre.html
If it continues this swing, the thickest ice will have Pushed itself AND THE MEDIUM ICE IN THE MIDDLE BASIN — both — out into the North Atlantic. Leaving little but Thin Ice.
On the Other Hand, it could wipe out the New Siberian Islands Polynnya that caused most of the Melt in 2007.
And in reference to that: look at the Sea Surfacce temps in 2010: 2007 reached over 4 degrees C in just 1 area in (late) August ,but much of all 3 of 2010’s Polynnya are Already over 4 !!
http://iup.physik.uni-bremen.de:8084/amsr/amsre.html << ARCTIC SeaSurfaceTemp click lower left & click: Anomaly, upper left
Compare 2007 Sea Surface temp anomaly http://www.arctic.noaa.gov/reportcard/figures/Fig5c2_2008.jpg
PS: here is the Barrow Radar, conveniently marking the Narl site, which has the only sea ice on the map (ugh) !
Remember though, a bright reflection is a Pressure Ridge & this drowns out the returns from flat ice, nearby. http://ak.aoos.org/data/ice/radar/BRWICE/staging/radar/SIRwebimg.png
Gail Combs says:
July 4, 2010 at 4:12 pm
“The ice pack looks like Swiss cheese,” agreed Mark Serreze, a senior research scientist at the National Snow and Ice Data Centre in Boulder, Colorado.
I guess he didn’t bother to actually look at the data.
—
Where is the problem? Of course he didn’t mean an Emmentaler:
http://upload.wikimedia.org/wikipedia/de/3/38/Emmentaler_Premier_Cru.jpg
he surely meant a Gruyere:
http://upload.wikimedia.org/wikipedia/de/6/6c/Le_Gruyere_Premier_Cru.jpg
😉
Phil. says:
July 4, 2010 at 5:06 pm
wayne says:
July 4, 2010 at 3:27 pm
Do you know of any publically downloadable dataset that gives you the total sea ice area without some xx% cutoff involved. Seems to form a specified cutoff limit on the data, the entity that holds the original data must know the total sea ice to begin with. Have you ever found such a raw dataset? The answer might by simply ‘no’ or ‘none’ for I have not found one but have been looking.
Try here:
http://arctic.atmos.uiuc.edu/SEAICE/arctic.historical.seaice.doc.txt
Thanks for the ref Phil., got that up and running. That 850+ MB file is really detailed & noticed the caveats. However, I was really looking for something more up-to-date, within months, since that file only spans Jan. 1870 to Oct. 2008.
I am impressed with Steve Goddard.
He is facing an elephant in the room called al Gore. With al Gore’s power point slides, poley bear pics, maps of Florida under water, it isn’t easy for a real scientist. Oprah is the next elephant in the room with her GREEN talk show coming up. She can bring in the weapons of Dr Phil and various shamans and teachers of alternative religions to fortify the Green spiritual movement.
Don’t worry Steve. They won’t fly their massive carbon consuming aircraft to Antartica to tape shows. They can use arctic pics as backgrounds in their studios.
If the June temp. in the Pacific sector of the Arctic is a good indication,
http://www.esrl.noaa.gov/psd/cgi-bin/data/timeseries/timeseries.pl?ntype=1&var=Air+Temperature&level=2000&lat1=90&lat2=68&lon1=90&lon2=225&iseas=1&mon1=5&mon2=5&iarea=1&typeout=2&Submit=Create+Timeseries
We’re headed for a September minimum almost certainly below 2009, likely below 2008, and possibly below 2007. This seems to have some merit, notice how the very cold June in 1996 led to very high survival of the ice pack and warm Junes of 1990, 1993, and 2005 led to heavy melting. And the warmest June of all was in 2007…and we all know what happened that year. This year we had the fourth warmest June since 1948, behind 2007, 1953, and 2005. So I say the implications are clear. Warm June = widespread melt ponds and ice albedo feedback get going early.
The average melt for July over 2003-2009 rounded to nearest thousand was 92000 KM2 p/d. For August this was 53000 KM2. (No full month for September, so not calculated)
The average melt for the 2 months July+August was 66,000 KM2.
Using just the averages and adding an adjustment for for September, I anticipate the minimum extent for 2010 to be be 4.34 million KM2. Even though 2006 and 2007 were unusual years, my bet is on just the simple averages, not anticipating another unusual year.
Steve, according to your forecasted melt, would 2010 sea ice beat 2002 and 2005?
Anu
For your information; in this part of the Northern Hemisphere, (England), June 21 is usually referred to as “Midsummer Day.”
A belated but sincere Independence Day greeting to our American cousins. Keep on fighting the good fight.
[Reply] Solstice falls on the 21st. Midsummers day is the 24th. RT – Mod
Curious Yellow says:
July 5, 2010 at 6:37 am
The average melt for July over 2003-2009 rounded to nearest thousand was 92000 KM2 p/d. For August this was 53000 KM2. (No full month for September, so not calculated)
The average melt for the 2 months July+August was 66,000 KM2.
Using just the averages and adding an adjustment for for September, I anticipate the minimum extent for 2010 to be be 4.34 million KM2. Even though 2006 and 2007 were unusual years, my bet is on just the simple averages, not anticipating another unusual year
________________
Very logical, and probably a decent estimate. I’m currently sticking with my 4.5 million sq. km, that I’ve been putting out since March, but will make a final forecast later in July when I see how the Arctic Dipole Anomaly is behaving.
Henry chance says:
July 5, 2010 at 6:23 am
I concur with what you said about Steve.
I would caution anyone who is wont to compare Steve with James Hansen. Hansen is motivated by greed and power, not scientific inquiry. The Climategate emails have proven this; thus Hansen has disqualified himself completely from any scientific debate, whether about ice, or climate, or the physics of pogo sticks. Steve is looking seriously at the science in an honest and inquisitive way. As a scientist myself, I appreciate his willingness to accept arguments and question his own arguments’ validation.
All of us here who recognize that there is a probability that we are entering a catastrophic climate of cooling know that this would be a hardship causing many to starve and perish. None of us look forward to other than a “normal” climate around the globe and will not delight in seeing an ice age dawn.
Especially since the Gores, Hansens, Manns, Jones, and the warm-earth cabal have made the world unprepared and unexpectant of a cold climate.
The Piltdown Man hoax was by-and-large a victimless crime. The AGW criminals have cultivated billions of potential victims.
This quote is apropos:
Robin: “Boy! That was our closest call ever! I have to admit that I was pretty scared!”
Batman: “I wasn’t scared in the least.”
Robin: “Not at all?”
Batman: “Haven’t you noticed how we always escape the vicious ensnarements of our enemies?”
Robin: “Yeah, because we’re smarter than they are!”
Batman: “I like to think it’s because our hearts are pure.”
bubbagyro
Thanks for the kind words. I honestly believe that Hansen believes everything he says. He just got confused by the 1998 El Nino, and hasn’t been able to recover his thought process since.
@Steve Goddard
Yes, but they are rotten winds
Speaking of icebreakers, this $10 million NASA, “ICESCAPE,” study is noteworthy:
http://www.nasa.gov/home/hqnews/2010/jun/HQ_10-135_NASA_ICEBREAKER_Voyage_Begins_June_15.html
In regard to Robert E. Phelan’s question (July 4, 2010 at 12:23 pm), perhaps we could write and request they also study the impact their presence in the Arctic has on ice extent. It is a question that deserves further investigation.
Elizabeth
Those icebreakers are a classic case of the Heisenberg principle. The process of measurement alters what is being measured.
Steve:
So Hansen is a dupe not a stooge?
bubbagyro
Put yourself in Hansen’s place.
He forecast a big rise in temperatures in the 1990s. For about six months it happened (before it plummeted back down.) During those six months he convinced himself he is a climate god, and has been oblivious to the fact that temperature trends have fallen far below even his most conservative forecasts.
He plays coach and referee, and always makes sure he keeps his results newsworthy. Like “0.001 degrees above the old record.”
The DMI plots since 1979 show the summer temperatures always just above freezing. Is this indicative of anything? Melting ice will always keep the temperature at this point.