By Steve Goddard
July 4, 2010. Celebrating independence from traditional sources of polar ice news.
Last week we discussed the importance of wind in determining the summer minimum. In 2007, the winds blew consistently from the south and compacted the ice towards the North Pole. This led to a tremendous amount of news coverage claiming that the Arctic was heating and melting. In fact – the spring and summer of 2007 was slightly cooler than normal for about half of the melt period north of 80°N, according to DMI (below)

http://ocean.dmi.dk/arctic/plots/meanTarchive/meanT_2007.png
Around mid-June of this year, the winds in the Arctic set up in a similar pattern – spiraling inwards and pulling the ice away from the coast. This led to an early decline in ice extent inside the Arctic Basin.

Towards the end of June, this pattern reversed and now the winds are circulating counter clockwise – pushing the ice towards the coasts. As a result, there has been very little change in extent inside the Arctic Basin over the last week.

You can see the changes in extent in the modified NSIDC map below. Areas marked in red show extent loss since June 27, and green shows extent gain.

Most of the ice loss over the last week has been in the Hudson Bay, which nearly melted out a few days ago. As a result of the Hudson Bay being depleted of ice and the changes in wind, we have seen the JAXA and DMI graphs take a break in slope.

http://ocean.dmi.dk/arctic/icecover.uk.php

http://www.ijis.iarc.uaf.edu/seaice/extent/AMSRE_Sea_Ice_Extent.png
Since July 1, there has been almost no ice loss in the Arctic Basin, as seen in the modified NSIDC image below.

The video below shows the wind and ice patterns over the last two weeks, culminating in a strong counterclockwise flow.
The modified NSIDC image below show differences between 2010 and 2007. NSIDC still shows 2007 ahead of 2010, but the differences are mainly in the Hudson Bay and other areas that normally have little or no ice in September. In the Arctic interior 2010 has more ice (green.)

Last week I made the forecast below for the remainder of the summer.
The image below shows current JAXA in pink vs. my forecast. So far, the forecast is right on track.

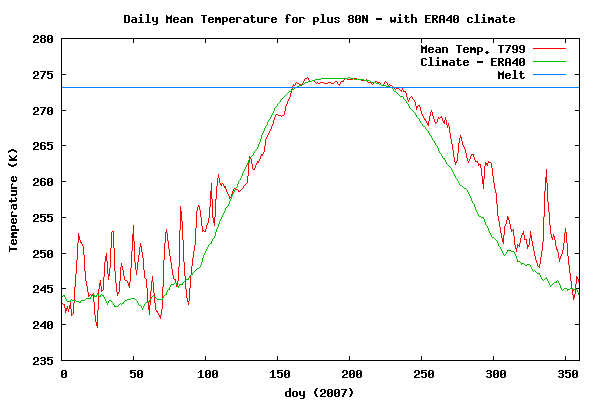
Temperatures north of 80N have been running slightly below normal for several weeks. The summer melt season is nearly half over. There are less than 60 days remaining of possible melt in the high Arctic.
")
http://ocean.dmi.dk/arctic/meant80n.uk.php
Temperatures in Barrow have also been running below normal. It appears quite possible that the landfast ice breakup date at Point Barrow will beat the record for the latest ever (July 10.)
Meanwhile down south, as Anthony pointed out, Antarctic sea ice is at a record high for the date.
")
Global sea ice is close normal.

http://arctic.atmos.uiuc.edu/cryosphere/IMAGES/global.daily.ice.area.withtrend.jpg
So what do the experts tell us?
The North Pole has become an island for the first time in human history.
Leading ice expert says entire Arctic Ocean sea ice may be gone sometime between August 8th and September of this year. (H/T to Tom Moriarity.)
Hopefully Lewis Pugh is waxing up his kayak to take advantage of the clear paddling to the North Pole next month.
On this July 4th, we celebrate the freedom provided by the Internet to propagate the accurate information which governments apparently don’t want us to know.
I think you got something pretty solid there Steve. Often we are proposing maybes or subtle correlations but this is more solid based on real phenomenon that we can monitor. Good stuff.
The forecast though depends on the forecast of conditions (and the winds in this specific case). And I also wonder if there is something similar for the Antarctic ice – it should be even more succeptible to wind directions/conditions.
Mr/Dr/Prof Goddard (apologies for not knowing your proper salutation)
This clearly will not do. You are not creating newsworthy copy.
How can the world keep going if all Prime Ministers are not sex-crazed incompetents who will murder a million people to earn a few million dollars in their retirement?
How can climate scientists carry on their profession if there’s not too much to worry about?
How can polar bears mate if a high percentage of them don’t die each summer due to lack of ice? I mean: you gotta keep them hungry and that means making sure the nearest woman is 1000 miles away!
And all this stuff about wind: this is only useful if it’s hurricanes, tornados and newsworthy disasters. All this wind causing a return to normality isn’t what the Press want to hear.
You gotta understand man: Wimbledon just had 13 days without rain. The end is nigh! It can only be global warming man…….
It’s just rained in Scotland. This is bad news man as it might mean we can’t report a disastrous drought soon. It’s also rained in NW England to break the drought there, which is bad news for the doomsday merchants, although I’m sure the farmers aren’t complaining……..
Can’t you just be like the rest of the nice folks who feed the Press what they want?
I mean, life would just be SO MUCH MORE COMFORTABLE FOR YOU IF YOU DID!!
I seems to me that if you add up the Arctic sea ice at over 8 sq. million km and the Antarctic at over 15 sq. million km you get a total of 23 sq. million km. The global sea ice chart says 20 sq.million km. Were is my math mistake?
I’ve never quite understood the fascination with arctic sea ice extent. Even if all the ice melts, so what? It doesn’t confirm the AGW hypothesis. The arctic ice cap has melted in the past, and it will melt again in the future — without the help of mankind (assuming we are still around.)
Five or 10 years down the road, we won’t be musing about arctic sea ice. We’ll be complaining about the onset of colder winters (and increasing energy costs) and wondering if we’re on the brink of another Dalton Minimum or Maunder Grand Minimum.
A warming earth is the least of our worries.
stevengoddard says:
July 4, 2010 at 12:45 pm
wayne
The video is of 2010.
OK, 2010, but the same question applies for any year, when ice is spread thin due to a reversal of the wind circulation pattern, is it still counted if then less than the 15% or 30% or whatever the cutoff percentage is? Have always wonder that and haven’t come across a reference to that.
One of your links to the Norway conference of the IPY mentions 50,000 scientists up in the arctic for 30 months! One of them, Barber of Manitoba U, who was a geographer about a year ago is now an arctic ice specialist. (Geographer is one of those ancient crafts like alchemy that keeps hanging in there. When I studied geography it was all about maps, the highest mountains and where coffee and cotton are grown and the like). He recounts zipping all over the Beaufort Sea in an ice breaker and all he could find was rotten ice up to 14 meters thick. D’ya think 50,000 scientists boring holes, charging around in icebreakers and burning heating, cooking aviation and av gas might have created a UHI effect. I’d watch out for this crowd. They have the tools, the funds and the agenda to turn a lot of ice loose for the Fram Strait ice chute
stevengoddard says:
July 4, 2010 at 12:38 pm
R. Gates
The actual trend line is tracking slightly above mine. I am concerned that my forecast is too conservative, given the change in wind patterns.
______
Then you may want to adjust your prediction for the final September extent upward I would guess. I’m quite comfortable with my long standing forecast of 4.5 million sq. km. for now. I don’t think we’ll see a big July “bump up”, but rather, a July-August “bump down”, based on Arctic SST’s and the Dipole Anomaly.
wayne
The ice in 2010 is the most concentrated on record. A little spreading is not going to cause much to drop below the 15% or 30% cutoffs.
R. Gates
I see no reason to raise my estimates yet. I will evaluate again in two weeks.
Mike says:
July 4, 2010 at 12:16 pm
Happy 4th. Here is a more informed overview of Antarctic climate:
Mike, I think not, not when it talks about accellerated sea level rise when in heats up. With highest summer temps in the mid minus teens (and colder in the center) it will take many hundreds of years of IPCC predicted warming before the antartic itself begins to melt (melting sea ice doesn’t raise sea levels). Furthurmore, this was only predicted using their computer “models” which seems only to be showing the result they clearly wanted show after they feed it data to to make it so not withstanding the fact that quite a few computer modellers question the accuracy and validity of them.
paul revere says:
July 4, 2010 at 1:04 pm
I seems to me that if you add up the Arctic sea ice at over 8 sq. million km and the Antarctic at over 15 sq. million km you get a total of 23 sq. million km. The global sea ice chart says 20 sq.million km. Were is my math mistake?
You’re summing extent and comparing it with total area, the correct areas are 6.60 and 13.38 Mm^2 = 19.98 Mm^2.
Bill Illis
I think that Antarctica is dominated by downslope (warming) winds away from the pole, which is what makes recent claims about winds causing the ice gain somewhat “puzzling.”
Bill Illis says:
July 4, 2010 at 12:58 pm
I think you got something pretty solid there Steve. Often we are proposing maybes or subtle correlations but this is more solid based on real phenomenon that we can monitor. Good stuff.
The forecast though depends on the forecast of conditions (and the winds in this specific case). And I also wonder if there is something similar for the Antarctic ice – it should be even more succeptible to wind directions/conditions.
**************************************************************************
Bill, Antarctic ice has a land anchor in the center, while the Arctic ice has the land anchor on the edges. Currents flow under the Arctic ice, causing it to twist, flow and break. The winds can the blow the loose ice around. In contrast, the ice in Antarctica has currents rubbing against the outer edges, breaking off pieces that can then float away. The central core is not affected. Ice continues to grow outward, even though the edges get broken off.
Mike said on July 4, 2010 at 12:16 pm:
“Current Understanding of Antarctic Climate Change
Fall 2007”
Well that just about says enough right there. Current as of 2007, guess a more recent update would be too inconvenient.
Love that logo:
I’m certain everyone from GE to Pachauri would agree with that, and that it is quite profitable too (for them at least).
Ah, internet memes. Serious Business? O RLY? 🙂
paul revere says: July 4, 2010 at 1:04 pm
“I seems to me that if you add up the Arctic sea ice at over 8 sq. million km and the Antarctic at over 15 sq. million km you get a total of 23 sq. million km. The global sea ice chart says 20 sq.million km. Were is my math mistake?”
You are confusing Extent with Area. Global Sea Ice Area chart;
http://arctic.atmos.uiuc.edu/cryosphere/IMAGES/global.daily.ice.area.withtrend.jpg
is a combination of Antarctic Sea Ice Area;
http://arctic.atmos.uiuc.edu/cryosphere/IMAGES/seaice.area.antarctic.png
and Arctic Sea Ice Area:
http://arctic.atmos.uiuc.edu/cryosphere/IMAGES/seaice.area.arctic.png
The frightening models we didn’t even dare to talk about before are now proving to be true,” Fortier told CanWest News Service
I am laughing so hard there are tears rolling down my cheeks! I have a “frightening model” of Godzilla on my bookshelf watching over me, endearing me to enjoy this beautiful sunny long weekend. Cheers!
stevengoddard says:
July 4, 2010 at 1:14 pm
wayne
The ice in 2010 is the most concentrated on record. A little spreading is not going to cause much to drop below the 15% or 30% cutoffs.
Yes, I know that Steve, but I was more wondering if the data numbers, the actual data you download from IARC-JAXA, has a certain percentage cutoff removed from the numbers downloaded? I know the displayed chart and drawn maps do, but does the actual data also ignore that certain class of diffuse ice?
That class of ice is usually around the very edges but if the wind pattern reverses, a large amount of ice can then move out to the clear sea and drop below that cutoff percentage, see my question, is it in the numbers, not the displayed graphics?
Is that what “Please note that only the sea-ice pixels in the browse image are counted for estimating the values of sea-ice extent, and thus sea ice outside the image is not taken into account in this data.” is saying? It seems that to me. So the data downloaded is not the REAL data of TOTAL sea ice.
wayne
The JAXA and NSIDC definition of extent is is a grid cell with 15% of the area covered with ice. DMI uses 30%. So yes, all extent data already has this factored in.
Inuit have several words for winds at the Arctic:
Rhys Jaggar
Here an great expert predicting the demise of skiing in Scotland, months before their coldest and snowiest winter on record.
http://news.scotsman.com/latestnews/Skiing—is-.4962678.jp
strange that Steven keeps mentioning barrow, but still has not corrected his false claim at the start of his first barrow post.
he wrote on the 26th of June:
In my last post, we discussed how there has been no visible change in the landfast ice near Barrow, AK. during the last week.
but we can see on the webcam pictures over those days, that the landfast ice on the beach of barrow is disintegrating and basically vanishes on the day of the post (actually one day earlier even.)
http://ak.aoos.org/op/webcam_archive.php?region=AK&name=Barrow&db=ABCam&yr=2010&mo=07&dy=04
Steven did even link a photo from the webcam, obviously in the entirely false believe, that the fog in the picture was hiding the ice.
the error is easy to check: look at the picture for 25th June, and 27th. and check the pictures before the 25th, to see the non-VISIBLE CHANGE.
REPLY: Strange also, that you never mention or retract your “surge” of failures with the now extinct blog “seed of doubt Iraq”. All that survives of that period of FAIL is your anonymous handle “SOD”. Losing your campaign against Iraq, you’ve now shifted to climate, and your logic and honor is no better. – Anthony
The North Pole has become an island for the first time in human history.
There is a high likelihood that this statement from September 2008 is history revision.
wayne says:
July 4, 2010 at 12:55 pm
Last I read some of the ice breakers (U.S. I think) are actually iced into their harbors and will not even be able get out this season!
And if that comes to pass, you can bet your stars & stripes the MSM won’t mention one word of it.
robert says:
July 4, 2010 at 11:45 am
‘off topic (but vaguely arctic related):
I’ve been checking activity near the Katla volcano’
_______________________________________________
Billy Liar says:
July 4, 2010 at 12:19 pm
If that scares you, take a look at the Tjornes fracture zone – large or the Reykjanes ridge. Many more and much stronger quakes in those areas.
_______________________________________________
Speaking of the Arctic and volcanoes, there is a nearby one in Russia that is on “yellow alert” Map of Russian volcanoes
EBEKO VOLCANO, Paramushir Island, Northern Kurile: 50o41’N,
156o01’E Elevation 1,156 m
AVIATION COLOR CODE IS YELLOW
PREVIOUS AVIATION COLOR CODE IS GREEN
Activity of the volcano increases. Ebeko volcano is not
monitored with seismic instruments. KVERT has satellite
monitoring and occasional visual messages about this
volcano. The danger of sudden ash explosions as high as 3 km
(9,840 ft.) ASL as well as ash falls at Severo-Kurilsk,
exists.
According to the data by local observers at Severo-Kurilsk,
activity on the volcano increases. Ash explosions at the
volcano began to occur from 03:53 UTC on July 02. A height
of ash column was about 1.8 km ASL. Ash plume extends to the
south-south-east – to Severo-Kurilsk. KVERT continues to
monitor the volcano.
““The ice pack looks like Swiss cheese,” agreed Mark Serreze”
No Mark, it’s your arguments which look like Swiss cheese.