“Steepest slope ever.”
By Steven Goddard
We have been hearing a lot about how the decline in Arctic ice is following the “steepest slope ever.” The point is largely meaningless, but we can have some fun with it. The Bremen Arctic/Antarctic maps are superimposed above, showing that ice in the Antarctic is at a record high and growing at the “steepest slope ever.” You will also note that most of the world’s sea ice is located in the Antarctic. But those are inconvenient truths when trying to frighten people into believing that “the polar ice caps are melting.”
There are several favorite lines of defense when trying to rationalize away the record Antarctic ice.
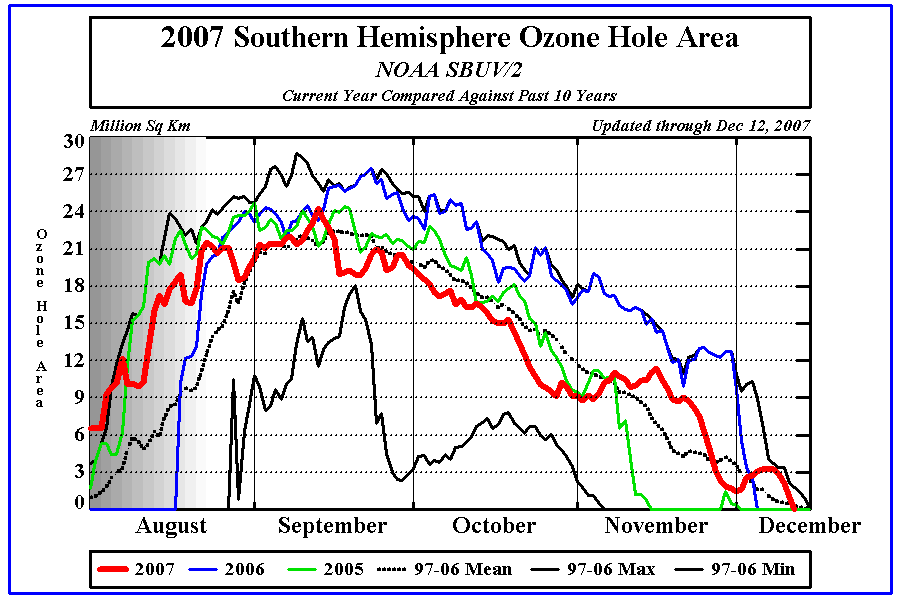
1. It is the Ozone Hole – which is also the fault of evil, American SUV drivers. That is a nice guilt trip, but sadly the Ozone Hole doesn’t form until August and is gone by December. Strike one.
The next one is to point out that some regions of the west side of the tiny Antarctic Peninsula have been warming. Never mind that the Antarctic Peninsula is an active volcanic ridge, and that the waters around it have not shown any significant warming. Strike two.
UAH shows Antarctica cooling slightly over the last 30 years.
The third favorite line of defense is to argue that “we expected Antarctica to warm more slowly because of the mass of the southern oceans.” Nice try – “slower warming” is not the same as “cooling.” Strike three.
(The AGW view of Antarctica is every bit as irrational as FIFA’s stand that not having instant replays somehow helps the referees’ reputations.)
On to the Arctic. First graph is a JAXA comparison of 2006, 2007 and 2010. Note that 2006 and 2007 were nearly identical, until early July. The main difference between 2006 (second highest in the JAXA record) and 2007 (lowest in the JAXA record) was that strong southerly winds compacted and melted the ice in 2007. As you can see below, the summer extent numbers are nearly meaningless before July/August. So far, 2010 is tracking very closely with both 2006 and 2007, and it appears the three will intersect in about a week.
Let’s take a closer look at the mechanisms using the PIPS ice and wind data. If we watch the movement of Arctic ice during the summer, we can see that when the winds blow away from the pole (i.e. from the north) the ice expands. When the wind blows from the south, the ice contracts. Some summers, the winds alternate between north and south, and the ice extent changes less during the summer – like in 2000 below.
Other years, like 2007, the summer winds blew consistently from the south, causing the ice to melt at a faster pace and compress towards the north.
So basically, it is weather (wind) rather than climate which controls the summer minimum. Of course, it is harder to compress and melt thick ice than thin ice – so the thickness of the ice is important. It is too early to determine if 2010 will see winds like 2007, or if summer winds this year will be more like 2006.
No one has demonstrated much skill at forecasting winds six weeks in the future, so it is really anybody’s guess what wil happen this summer. Before August arrives, the pattern should be clear.
The video below shows ice movement near Barrow, AK over the past 10 days.
The winds were blowing strongly and contracting the ice edge until the last few days, when they died down. Over the past two or three days, the ice edge has not moved very much.
Over the last week, almost all of the ice loss in the Arctic has been in the Hudson Bay, as seen in the modified NSIDC image below in red. The Hudson Bay is normally almost ice free in September, so the recent losses are are almost meaningless with respect to the summer minimum.
The modified NSIDCimage below shows ice loss since early April. All of the areas shown in red are normally ice free in September.
The modified NSIDC image below is a comparison of 2010 vs 2007. Areas of red had more ice in 2007. Areas of green have more ice in 2010.
The modified NSIDC image below shows the current deficiencies in red. Again, all of those areas are normally ice free in September, so they don’t tell us much about the summer minimum.
Below is my forecast for the remainder of the summer.
But it all depends on the wind.
From the 9th century to the 13th century almost no ice was reported there. This was the period- of Norse colonization of’ Iceland and Greenland. Then, conditions worsened and the Norse colonies declined. After the Little Ice Age of 1650 to 1840 the ice began to vanish near Iceland and had almost disappeared when the trend re versed, disastrously crippling Icelandic fisheries last year.
The thick ice that has for ages covered the Arctic Ocean at the pole has turned to water, recent visitors there reported yesterday. At least for the time being, an ice-free patch of ocean about a mile wide has opened at the very top of the world, something that has presumably never before been seen by humans and is more evidence that global warming may be real and already affecting climate. The last time scientists can be certain the pole was awash in water was more than 50 million years ago.
Is it possible that the IPCC is trying to rewrite the history books?
Sponsored IT training links:
Guaranteed success in 350-029 exam with latest 70-290 questions and 642-974 practice test!
Ask Al Baby, being a Nobel laurate, he is supposed to have a wider than an ocean knowledge than us….but with just a 1/64 of an inch deep.
It’s odd the ozone hole follows the sun so much …. something I recall about the balance of UV-A and UV-B causing and destroying the ozone hole, but that’s old science now.
The other thing I never understood is ice floats, and the wind blows floating ice around? When was that discovered.
Excellent analyis Steve. Can expect a lot of comment on the summer BBQ circuit on the 2010 arctic ice situation. Your ice reports provide all the data I need. Super imposing the arctic and antartic ice extent is especially illuminating.
Keep this info coming.
Two or three months ago, I thought it was rather brave of Gates to forecast the minimum for summer ice to be at the 2007 record level. Last month, I thought it was more than brave — I thought it was reckless — for Steve Goddard to forecast the summer minimum to be close to the top of the six years.
I myself do not venture a forecast. Too much depends upon wind and ocean currents, and we have some vague understanding on the role of soot — but no more than vague. As Steve suggests, we can wait a few weeks to see, rather than getting upset and angry at people with different expectations.
Just for fun I did the first derivative of the ice extent on the JAXA graph. The rate of decline has passed its peak around the 10th of June… so the decline speed is actually slowing down already.
All these scary predictions are very similar to a certain “end times” cult that predicted
the end in 1975. There was a local preacher here in my home town that was preaching this to the faithful. They sold their properties, their cars, and went up to the hilltop and
waited-I think it was 2:00 pm, May 12, or something like it. So, the Sun went down
and rose on the 13th, just has it has for Eons,-no second coming, no flying saucers, not
even a Klingon Battle fleet. Oh well.
We are watching the dying of a Cult….
I was hoping for Klingons, by the way….
Steven,
I will remember your forecast for ice minimum extension. We are living in interesting times.
They could be correct. We only have what, 30 years of data sets?
Drama is a poor substitute for data.
In several centuries, we should have a pattern for what could be consider a normal range of fluctuation.
The videos won’t play for me when viewed in Chrome. Is anyone else having that problem?
Reply: They work fine for me with Chrome. Still using XP. You may need to update your Flash Player. ~ ctm
What if the water cycle is not closed but opened?. During summer time above the pole and due to increased radiation, atmosphere´s oxygen is turned into Ozone (O3), which during winter time and specially when there are proton flares from the sun or increased cosmic rays, as during solar minimums (mainly composed of protons-90%-, which, btw, we must remember are Hydrogen Nucleii), and these react with ozone to produce water 2H+…O3=H2O+O2 and originate the “Ozone Hole” , then snow fall increases ice. So we have an ice cube making machine.
I’m with “An Inquirer”. We need to wait and see in a spirit of scientific curiosity.
Calling strident attention to a prospective record, or trying to decry it before it happens, are both misplaced.
Has the New York Times forgotten that there are archives even if they choose not to look at them?
Ray says:
June 28, 2010 at 12:32 pm
Just for fun I did the first derivative of the ice extent on the JAXA graph. The rate of decline has passed its peak around the 10th of June… so the decline speed is actually slowing down already.
————————
The first derivative from NSIDC’s data does not show the speed has now slowed (June 1 to June 27):
-0.12163
-0.06582
-0.06406
-0.08711
-0.04721
-0.11067
-0.02197
-0.12449
-0.0832
-0.09121
-0.09059
-0.05856
-0.04369
-0.04009
-0.03826
-0.07863
-0.06003
-0.14218
-0.10832
-0.18452
-0.07408
-0.06356
-0.0751
-0.12348
-0.11984
-0.0923
-0.14786
As Steve notes, Antarctic Sea Ice Extent continues to increase rapidly and is currently well above average, and significantly exceeds NSIDC’s misleadingly narrow “normal” range:
http://nsidc.org/data/seaice_index/images/daily_images/S_stddev_timeseries.png
Antarctic Sea Ice Area has been trending up and the anomaly now appears to the largest on record, save for the record Antarctic Sea Ice freeze that occurred in 2007 – 2008:
http://arctic.atmos.uiuc.edu/cryosphere/IMAGES/seaice.anomaly.antarctic.png
Antarctic Sea Ice Extent trend for the month of May since 1979 also shows the increase, and that the last 3 years represent the only sustained peak in the historical record:
http://nsidc.org/data/seaice_index/images/s_plot_hires.png
Here is a good visualization/map of the positive Antarctic Sea Ice Extent Anomaly; http://nsidc.org/data/seaice_index/images/daily_images/S_bm_extent_hires.png
and in the map above there seems to be a lot of extra ice off the coast of Queen Maud Land and to its East;
http://en.wikipedia.org/wiki/Queen_Maud_Land
which also calls into questions claims that recent increases in Antarctic Sea Ice are primarily in the Ross Sea and caused by Ozone or the lack thereof:
http://www.nasa.gov/topics/earth/features/antarctic_melting.html
In addition to near record Extent and Area, Antarctic Sea Ice Concentration also seems quite high;
http://nsidc.org/data/seaice_index/images/daily_images/S_daily_concentration_hires.png
as compared to 2007, when the previous record high Area and Extent occurred:
http://nsidc.org/data/seaice_index/images/daily_images/S_record_concentration_hires.png
All of this might have something to do with the fact that Ocean temperatures are plummeting and still have a ways to go down;
http://www.drroyspencer.com/wp-content/uploads/AMSRE-SST-Global-and-Nino34-thru-June-17-2010.gif
because an El Nino has just ended;
http://wattsupwiththat.com/2010/05/13/r-i-p-el-nino/
and the PDO is now in its 30 year cool phase:
http://wattsupwiththat.com/2008/04/29/nasa-pdo-flip-to-cool-phase-confirmed-cooler-times-ahead/
I have been considering whether Arctic or Antarctic Sea Ice offers a more accurate proxy of Earth’s current temperature and temperature trend, and I think it’s Antarctic Sea Ice. The primary reason for this conclusion is that large portion an Antarctic Sea Ice melts each year as you can see in this video complements of Mr. Goddard;
thus in a way Antarctic sea ice resets/recalibrates each year, offering more accurate readings as compared to the Arctic sea ice, which suffers from the impact and memory of major non-temperature related events such as occurred in 2007.
Can anyone offer a counterpoint as to why they think Arctic Sea Ice offers a better proxy for Earth’s temperature and/or temperature trend?
Thanks for doing the latest update Steven.
Arctic-ROOS are still tracking almost exactly the 2007 pattern – will be interesting to see where we end up!
you ask: “Is it possible that the IPCC is trying to rewrite the history books?”
They would have to read the history before they could rewrite it.
The AGW proponent position seems to be that nothing exists prior to the satellite era except tree rings, ice-cores and other unvalidated proxies.
Sorry, forgot the link on my last post –
http://arctic-roos.org/observations/satellite-data/sea-ice/ice-area-and-extent-in-arctic
Goodness, some folks really hold this close to the chest. I for one love the discussion and speculation on both sides of the isle. I also don’t care whether or not someone changes their prediction. What is more important to me is that when it happens, the person should offer up an explanation for why his/her prediction did not come true or likely won’t, and why he/she is changing the prediction (IE what parameters were not taken into consideration with the former prediction and what parameters are now being considered in making a new prediction). This openness to learning informs my own learning and understanding. Folks who change their prediction and are absolutely transparent and explanatory about it are of high value to me.
IMO, under those preferred circumstances outlined above, it behooves those of us who have made predictions and have stuck by them but that ended up way off, to post what learnings they gleened from the exercise of predicting something, and being significantly outside the bullseye. I challenge both sides of the debate of be prepared to do that on this blog.
There’s no doubt that the wind has some influence in the Arctic sea ice extent, but it can’t explain the negative trend:
http://nsidc.org/images/arcticseaicenews/20091005_Figure3.png
Didn’t I see photos of submarines at an ice free pole in 1958?
Or was that photo taken in 50,000,000 BC?
Julienne
I expect that when the Hudson Bay ice disappears during the next week or so, that the slope will start to drop off.
Tenuc
The pattern so far is similar to 2007. And it is also similar to 2006. Opposite meanings.
“So basically, it is weather (wind) rather than climate which controls the summer minimum.”
Sounds pretty much like what I said about a month ago. Go figure.
Roald
There seems to be some control which keeps global sea ice fairly constant.
Rather than coming up with stupid explanations for what is happening in Antarctica, it would be nice if polar researchers would try to come up with a unified theory for this:
http://arctic.atmos.uiuc.edu/cryosphere/IMAGES/global.daily.ice.area.withtrend.jpg
Julienne says:
June 28, 2010 at 1:31 pm
______________
Look at the change of slope (Y2-Y1)/((X2/X1). Of course (X2/X1) = 1. So it is the difference in ice area between days that I was talking about.
Steven Goddard says:
“So basically, it is weather (wind) rather than climate which controls the summer minimum. ”
For year over year variations, as you and others have been pointing out, temperature is not the dominant factor in the summer minimum. But over a longer period of time, surely temperature must be the main driver toward an ice-free summer.
In years which the Arctic was ice-free are there estimates of the maximum ice-extent?
Nice post BTW Mr. Goddard.
IMHO Sea Ice is may be highly correlated to the AMO. If the AMO peaked in 2005, and follows a similar pattern to ~70 years ago, we’re in for a ~30 year long drop. Which means a steady rise in Arctic sea ice. In a couple of years we may know more. Currently we just have sea ice data for a period starting right after a multidecadal decline in North Atlantic and Arctic sea temperatures.
Please see the two maps of:
1. NHemi SAT (Surface Air Temperature):
http://www.esrl.noaa.gov/psd/map/images/fnl/sfctmp_01.fnl.html
and
2. NHemi JetStreams:
GFS Medium Range Forecasts of 200mb Streamlines and Isotachs
http://wxmaps.org/pix/hemi.jet.html
If there is a nexus between the two factors, and I think it is as their plots’ meanders line up a lot, and if the the GFS forecast for July the 2nd is correct we there will be even greater intrusion of warm air from the same hot areas of North America, Svalbard, Central North Russia and over Bearing Straits from Pacific Ocean.
Something of a “SAT NHemi Pinch Effect” will occur and the descending line on
http://arctic.atmos.uiuc.edu/cryosphere/IMAGES/sea.ice.anomaly.timeseries.jpg plot will go down even more precipitously.
The question is whether the plot line can go down more “perpendicular” than it is going on now. 🙂
Regards
I don’t understand why Steve G can be claiming that southerly winds compacted the ice in summer 2007, when claims have been repeatedly made that the low minimum that year was due to ice being blown *out of* the Arctic, which would require a generally northern wind component.
This seems inconsistent, and I’d appreciate seeing it explained.
Rich.
The NYT issued a correction on the 2000 story as there had clearly been open water at the NP before.
For some nice historical pictures of the North Pole see National Geographic Magazine:
Sept. 1926 p. 375–Richard Byrd crosses the NP on May 9, 1926. The photo shows recently frozen over water-leads separating ice fields.
August 1927 p. 208–Umberto Nobile, Lincoln Ellsworth, and Roald Amundsen drop their countries flags from the airship “Norge” at the NP on May 12, 1926. The photo shows several open leads and polynas as well as well broken ice.
October 1953 p. 478-479–Three very nice photos of the NP taken by G. Grosvenor on May 20, 1953 and overlain with a survey grid to verify the exact location and size. The photos show open leads and polynas.
The Arctic may soon be entirely free of sea ice.
Ray says:
June 28, 2010 at 2:22 pm
Julienne says:
June 28, 2010 at 1:31 pm
______________
Look at the change of slope (Y2-Y1)/((X2/X1). Of course (X2/X1) = 1. So it is the difference in ice area between days that I was talking about.
—————-
Ray, that is exactly what I gave you, the difference in area between days.
So basically, it is weather (wind) rather than climate which controls the summer minimum.
No one has demonstrated much skill at forecasting winds six weeks in the future, so it is really anybody’s guess what wil happen this summer. Before August arrives, the pattern should be clear.
If someone actually believed this hand waving, then it would be just as likely that the Arctic sea ice minimum in September could be above the 1979-2000 average, as way below it. Why would the weather change so much in just 10 years ? It’s not like the climate is changing…
Someone believing in this “it’s just the weather” hypothesis would be expecting a summer minimum of about 7.5 million sq. km. of Arctic sea ice extent, or maybe 8.5 million if the “wind” is just right. Why would the weather be causing small summer minimums year after year after year after year ? It will probably go “back to normal” this summer:
http://nsidc.org/images/arcticseaicenews/20090917_Figure2.png
Hey, it’s just the wind, and nobody can predict that, right ? The planet has been “cooling” for 15 years, and PIPS 2.0 shows “thick” ice all over the Arctic Basin. The Arctic sea ice will be partying like it’s 1989 this September, no doubt.
ಠ_ಠ
Steve,
How can the wind blow away from the pole? I don’t understand using “north” and “south” when describing a region so close to the pole.
stevengoddard says:
June 28, 2010 at 2:09 pm
Julienne
I expect that when the Hudson Bay ice disappears during the next week or so, that the slope will start to drop off.
——————————
Hi Steve, well I guess we’ll have to wait and see. The Dipole Anomaly is persisting though, which does many things: (1) anomalously clear skies under the Beaufort Sea High; (2) advection of warm southerly air into the Arctic Basin; (3) strong meridional winds that push the ice away from the coasts; (4) stronger flow of ice out of Fram Strait and (5) inflow of warm Pacific water. The paper by Wang et al. (2009) nicely describes these processes. (Wang, J., J. Zhang, E. Watanabe, M. Ikeda, K. Mizobata, J. E. Walsh, X. Bai, and B. Wu (2009), Is the Dipole Anomaly a major driver to record lows in Arctic summer sea ice extent?, Geophys. Res. Lett., 36, L05706, doi:10.1029/2008GL036706)
So, if the DA continues, I would not expect the slope to slow in the next week or so even though Hudson Bay should be free of ice by then…
Was it?
I don’t care what the damn extent is in September I remain unconvinced that it is unprecedented and unusual. What caused the following?
http://www.ngu.no/en-gb/Aktuelt/2008/Less-ice-in-the-Arctic-Ocean-6000-7000-years-ago/
http://noconsensus.wordpress.com/2009/06/16/historic-variation-in-arctic-ice-tony-b/
http://co2science.org/articles/V12/N32/C2.php
http://docs.lib.noaa.gov/rescue/mwr/050/mwr-050-11-0589a.pdf
http://www.john-daly.com/polar/arctic.htm
http://www.navsource.org/archives/08/08578.htm
Julienne says:
June 28, 2010 at 1:31 pm
————–
Here is my graph: http://i47.tinypic.com/1z7t5u.jpg
Of course I could have used a linear regression on the first derivative and it would have been worse that we thought…
Adding Arctic and Antarctic ice volume changes, wouldn’t that give an overall perspective? Guess that the Arctic loss is a fraction of the Antarctic gain …
Ray says:
June 28, 2010 at 2:22 pm
> Look at the change of slope (Y2-Y1)/((X2/X1). Of course (X2/X1) = 1. So it is the difference in ice area between days that I was talking about.
Perhaps you mean (Y2-Y1)/(X2-X1). (X2/X1) is likely not one, unless the two points sampled are the same. (X2-X1) is only 1 if you are comparing adjacent days which I assume is what you meant and I thought was what Julienne did. (I don’t have time check, only time to point out obvious typos. 🙂 )
Smokey
Its good to see these old reports-you will also be aware of these ones.
Arctic ice melt is by no means a modern phenomenen and the NSIDC and IPCC seem reluctant to accept the concept of natural cycles of cooling and warming. The start of Satellite measuring in 1979 coincided with something approaching peak ice, following a extemded cooling period, which is why they always speak of subsequent decline;
History suggests you should look at a much longer time scale than thirty years which will put the modern era into its proper context..
Link 1 Ice extent maximum- Depends if you are talking winter or summer but ‘decline’ starts around 1976/9 from a high point.
http://geology.com/articles/northwest-passage.shtml
Link 2 This also shows the same;
http://arctic.atmos.uiuc.edu/cryosphere/IMAGES/current.area.jpg
Link 3 The IPCC report confirms this p351/2 figures 4.8 4.9 4.10
http://www.ipcc.ch/pdf/assessment-report/ar4/wg1/ar4-wg1-chapter4.pdf
Link 4 The concerns over ‘global cooling’ in the 70’s which caused the arctic ice peak did have some basis in fact. There were a series of low temperatures in many arctic areas during the 70’s which ice would have corresponded to by growing.
http://www.greenworldtrust.org.uk/Science/Scientific/Arctic.htm
Link 5 From the CIA further confirmation of the cold period during this time.
http://www.climatemonitor.it/wp-content/uploads/2009/12/1974.pdf
As the IPCC show, the start of the satellite period therefore roughly coincided with a period of peak ice-so it is not at all surprising that as part of its natural cycle it should subsequently decline.
Link 6: The IPCC are not very good at their historic reconstructions and generally view actual observations as ‘anecdotal.’ They seem to believe that history did not start before 1979. My article examines the arctic melting in the period 1810-1860 -see notes at bottom of article with additional references.
http://wattsupwiththat.com/2009/06/20/historic-variation-in-arctic-ice/#comments
Link 7: The next two links are good studies showing the arctic melting from the 1920’s to 1940’s; The first shows a warm period during the 1930s and 1940s with temperatures as high as those of today ftp://ftp.whoi.edu/pub/users/mtimmermans/ArcticSymposiumTalks/Smolyanitsky.pdf
Link 8: The second link illustrates reduced sea ice extent during this period, which only later returned to the high levels measured at the start of the latest retreating cycle in 1979 (when satellite measurements started).
http://meteo.lcd.lu/globalwarming/Chylek/greenland_warming.html
Link 9: The melting in the period 1920-1940 is very well documented.
Expeditions to the arctic to view the melting ice became the equivalent of todays celebrity jaunts to the area. The most famous were those mounted by Bob Bartlett on the Morrissey. I have carried extracts from his diary before-amongst the observation are a description of a mile wide face of a glacier falling in to the sea. There are pathe news reels of his voyages dating from the era, as well as books on the subject. Here is a bibliography of material relating to him. The diaries are of particlar interest.
http://www.nlpubliclibraries.ca/nlcollection/pdf/guides/NL_Collection_Guide_11.pdf
Link 10 Bernaerts, A. (2007). Can the “Big Warming” at Spitsbergen from 1918 to 1940 be explained? PACON 2007 Proceedings 325-337.
http://www.arctic-heats-up.com/pdf/Submitted_conference_paper.pdf
Link 11 This comes from contemporary 1927 newspaper reports showing Arctic ice melting in 1927
http://www.examiner.com/x-32936-Seminole-County-Environmental-News-Examiner~y2010m3d2-Arctic-Ocean-is-warming-icebergs-growing-scarcer-reports-Washington-Post
Link 12 Apparent warming in 1969 Arctic
http://wattsupwiththat.files.wordpress.com/2008/07/nyt_arctic_77442757.pdf
Link 13 This shows a variety of arctic warming events over the last 150 years
http://www.examiner.com/x-32936-Seminole-County-Environmental-News-Examiner~y2010m3d2-Arctic-Ocean-is-warming-icebergs-growing-scarcer-reports-Washington-Post
Link 14: We have got this far citing instances of warming and not even mentioned the Vikings 1000 years ago…instead let’s look at another Arctic culture that thrived 1000 years before the Vikings;
From the Eskimo Times Monday, Mar. 17, 1941
“The corner of Alaska nearest Siberia was probably man’s first threshold to the Western Hemisphere. So for years archeologists have dug there for a clue to America’s prehistoric past. Until last year, all the finds were obviously Eskimo. Then Anthropologists Froelich G. Rainey of the University of Alaska and two collaborators struck the remains of a town, of inciedible size and mysterious culture. Last week in Natural History Professor Rainey, still somewhat amazed, described this lost Arctic city.
It lies at Ipiutak on Point Hope, a bleak sandspit in the Arctic Ocean, where no trees and little grass survive endless gales at 30° below zero. But where houses lay more than 2,000 years ago, underlying refuse makes grass and moss grow greener. The scientists could easily discern traces of long avenues and hundreds of dwelling sites. A mile long, a quarter-mile wide, this ruined city was perhaps as big as any in Alaska today (biggest: Juneau, pop. 5,700).
On the Arctic coast today an Eskimo village of even 250 folk can catch scarcely enough seals, whales, caribou to live on. What these ancient Alaskans ate is all the more puzzling because they seem to have lacked such Arctic weapons as the Eskimo harpoon.
Yet they had enough leisure to make many purely artistic objects, some of no recognizable use. Their carvings are vaguely akin to Eskimo work but so sophisticated and elaborate as to indicate a relation with some centre of advanced culture — perhaps Japan or southern Siberia —certainly older than the Aztec or Mayan.
This link leads to the Academy of science report of the same year regarding the Ipiutak culture described above
http://www.pubmedcentral.nih.gov/articlerender.fcgi?artid=1078291
Link 15 This from the late John Daly has numerous references to previous periods of arctic warming.
http://www.john-daly.com/polar/arctic.htm
Link 16: This link shows various historic maps which again show that modern ice melt is the norm, not the exception. One of Greenland shows it as two separated islands and was cited by a polar French expedition which asserted that there is an ice cap joining what it is actually two islands. This extraordinary claim is backed up by observations from an 1820 Greenland expedition whereby locals remarked on folk lore which said the same thing. (see reference in Link 6)
http://www.nymapsociety.org/FEATURES/TRAGER.HTM
Link 17 We seem to have known more about dispersal of ice by wind and currents 150 years ago than we do now, factors which have a profound efect on extent, area, and melting. Many books date from the scientific expeditions mounted since 1820 that examined the ‘unprecdented ice melt in the arctic reported to the Royal Sociery. This book dates from 1870
http://www.archive.org/stream/arcticgeographye00roya#page/28/mode/2up
Certain of us seem reluctant to learn the lessons of history-in this case that there are periods of melting and refreeze of the Arctic area that appear to follow a roughly 60/70 year cycle. The satellite record coincided with one of the High spots of Arctic ice following a long cool period and we may or may not be at the low point in the cycle-that will become clearer over the next five years.
Whatever the alarmists may believe, at present our modern era is not displaying any climate characteristics that have not been experienced in past ages of humanity.
tonyb
Ian W says:
June 28, 2010 at 1:37 pm
you ask: “Is it possible that the IPCC is trying to rewrite the history books?”
They would have to read the history before they could rewrite it.
The AGW proponent position seems to be that nothing exists prior to the satellite era except tree rings, ice-cores and other unvalidated proxies.
___________________________________________________________
You have that right.
Here is a map of the arctic sea based on the writings of the Norse (vikings) http://www.heritage.nf.ca/exploration/vmap.html
A present day Arctic Map: http://climateinsiders.files.wordpress.com/2010/06/pips_mask1.jpg
“…The settlers found that the area to the north of the Western Settlement, called the Nordseta, was good for hunting, fishing and gathering driftwood. A stone inscribed with runes has been found telling that in 1333, three Greenlanders wintered on the island of Kingigtorssuaq just below 73 degrees north. There is also evidence of voyages to the Canadian arctic. Two cairns have been discovered in Jones Sound above 76 degrees North and two more have been found on Washington Irving Island at 79 degrees north….” http://www.mnsu.edu/emuseum/prehistory/vikings/Greenland.html
Washington Irving Island is at the entrance to Dobbin Bay, eastern Ellesmere Island, Nunavut, Canada. This area is well within the arctic circle and not that far from the north pole (about 600 miles) and certainly within the Beaufort Sea Gyro.
Also another rewrite of history in hopes of getting rid of the Little Ice Age, is that the Norse left Greenland because of poor farming practices causing soil erosion and not because of the increasing cold.
Science again proves that rewrite is wrong: http://pubs.aina.ucalgary.ca/arctic/arctic48-4-324.pdf
Agreed. The problem with AGWers is that whenever their predictions fail they blame the opposite on AGW. There was a recent post about a claim that AGW will cause more snow in the NH as opposed to the one made 10 years ago in the Independent about snow becoming a thing of the past. How can you debate with people like this?
We sceptics can predict what we like, get it wrong and not worry about it. It is the AGWers who have created the theory and it’s up to them to make predictions (the strength of any climate theory).
Take a look at the warmlist and see how many contradictory stories there are:
http://www.numberwatch.co.uk/warmlist.htm
Take a look at all the failed predictions from AGWers:
http://www.c3headlines.com/predictionsforecasts/
Anu says:
June 28, 2010 at 2:39 pm
“So basically, it is weather (wind) rather than climate which controls the summer minimum.
No one has demonstrated much skill at forecasting winds six weeks in the future, so it is really anybody’s guess what wil happen this summer. Before August arrives, the pattern should be clear.
If someone actually believed this hand waving, then it would be just as likely that the Arctic sea ice minimum in September could be above the 1979-2000 average, as way below it. Why would the weather change so much in just 10 years ? It’s not like the climate is changing…
Someone believing in this “it’s just the weather” hypothesis would be expecting a summer minimum of about 7.5 million sq. km. of Arctic sea ice extent, or maybe 8.5 million if the “wind” is just right. Why would the weather be causing small summer minimums year after year after year after year ? It will probably go “back to normal” this summer:
http://nsidc.org/images/arcticseaicenews/20090917_Figure2.png
Hey, it’s just the wind, and nobody can predict that, right ? The planet has been “cooling” for 15 years, and PIPS 2.0 shows “thick” ice all over the Arctic Basin. The Arctic sea ice will be partying like it’s 1989 this September, no doubt.”
Anu, do you actually believe what you post or are you just trolling? Are you really asserting that any of the posters here are arguing the ice loss over the past 30 years is purely attributable to daily variations in wind and ocean currents?
I certainly haven’t seen this and I think you’re being incredibly disingenuous in trying to say this.
Julienne,
It looks to me like the vast majority of melt over the past week was in the Hudson Bay, so unless the Arctic Basin starts to lose ice much more quickly, the slope will have to drop off after Hudson Bay melts out.
http://climateinsiders.files.wordpress.com/2010/06/nsidcjune212010vsjune272010.jpg
Buffoon
Winds blowing away from the pole are north winds, and towards the pole are south winds.
“‘Smokey says:
June 28, 2010 at 2:36 pm
The Arctic may soon be entirely free of sea ice””
Smokey, that’s a classic, thank you
New York Times – 1969
Expert says Arctic to become an open sea in a decade or two.
See – owe to Rich
Most of the loss of old ice occurred during the winter of 2007-2008, not during the summer.
Anu
At the end of July, 2008 NSIDC was contemplating a possible “normal” summer minimum. Then “the perfect storm” hit and broke the ice up. It’s called “weather.”
My apologies for my previous post. Hopefully the moderators will snip it.
I am not quite clear though on what Anu is trying to say when he says
“Someone believing in this “it’s just the weather” hypothesis would be expecting a summer minimum of about 7.5 million sq. km. of Arctic sea ice extent, or maybe 8.5 million if the “wind” is just right. ”
I don’t think I’ve seen anyone claim that there hasn’t been ice loss over the past 30 years. Much of the discussion has revolved around how much can be read into short term ice loss trends and how they’re likely to relate to the potential September mininum. In this context I find your comment a little disingenuous Anu.
Ray, obviously the JAXA data differs from the NSIDC data. I am using 5-day running means to reduce influences from weather effects which I don’t believe JAXA is doing. Curious what your rate of decline is for June. Mine is 87,350 sq-km per day from June 1 to June 27.
stevengoddard says:
June 28, 2010 at 2:17 pm
Roald
There seems to be some control which keeps global sea ice fairly constant.
GeoFlynx
A good mechanism for the above observation would be: it’s winter in the Antarctic when it’s summer in the Arctic. Climatologists claim that Northern Hemisphere ice cover and extent has a greater effect on global temperature than ice in the Southern Hemisphere. The sum of both ice fields may not be a good indicator of climate change.
Ric Werme says:
June 28, 2010 at 2:57 pm
____________
Yes, I used adjacent days. Jan 1st = 1, Jan 2ns = 2, Jan 3rd = 3, etc
Excellent post. But I still do not know what PIPS mean. PIP is the spread between the “bid” and “ask” prices when you trade currencies. It is really annoying to see all that unexplained acronyms. You USA people have some kind of fetish for acronyms, courtesy mandates that you explain at least ONCE every acronym on a post on wattsupwiththat.com, the most popular science blog that ever existed. You will lose your worlds first place if you do not care about such elementary courtesy.
If you want ONLY a few specialists to read your posts then your superb work on showing the climate pseudoscience will be destroyed. Your FORCE comes from the fact that NON SPECIALISTS are reading you and your SUPERB DEMOLITION of the lies, falsehoods and logical errors of Big Academia, Big Media & Big Bureaucracy.
We already know that Big Academia, Big Media & Big Bureaucracy will DELIBERATELY IGNORE THE INCONVENIENT TRUTHS that show their theory is garbage. It is US non specialist people that have been demolishing their lies, faslsehoods and errors. Writing for Big Academia, Big Media & Big Bureaucracy is useless, ask Henrik Svensmark about how his superb work showing the sun influence on climate was simply IGNORED by Big Academia, Big Media & Big Bureaucracy those entities: They HATE people that tells them how incompetent they are and, probably most important, if their theory is proved FALSE then they have to say bye to $billions$ in grants for useless academic research, $$Trillions$$ in taxes and they hace to say goodbye too to the insane OPPRESSIVE POWER & CONTROL over our lives that they want by controlling and taxing co2. Write for us, do not write for the people that will deliberately ignore the INCONVENIENT TRUTHS that go against their oppressive political agenda
Cheers and thanks for such superb posts.
[Reply: There is an acronym list under “Glossary” at the mast head menu that may be helpful. ~dbs, mod.]
The Antarctic sea ice may increase even faster than Arctic sea ice, but then what? Is there any relation between the two? Should we be happy if the whole Arctic sea ice piles up in Antarctica? Does this confirm that there’s no climate change? I really don’t get the meaning of this comparison.
@Ray
your 4th order polynomial fit is meaningless, you cannot base your claim just on this.
If you ask me, Its the Combo of the AMO and PDO. The AMO lags the PDO by almost 10 years, so, as the PDO Tanks in the nextYear, the AMO wll still be at its record warm phase… until 2016 or so??????????
Oceans cover 2/3 of earths surface, so it seems logical that Oceanic oscillations would have something to do with this.
There is some anomaly that seems to keep everything in balance globally…… And NO, it does not seem logical that CO2, a Trace gas essential to Life on earth, will cause our doom.
Trees Need CO2, More trees=more oxygen, which we need. Trees Absorb CO2, and So do The Oceans. If there are more tres to absorb CO2, and More oxygen in return, wouldn’t that be Beneficial?? LONGER growing Seasons, Humans will be able to Live Further North…… Lowering Poverty……… a warming climate would help, rather than hurt.
It is All a Natural Cycle, everything balances out, as one end tips, the other rebounds, and visa versa. Our planet is not in trouble, and we will be ruining our economy, and employment, over absolutely Nothing.
Expect to see, over the Next Year, the AGW crew Really try to Push thus out, HARD/FAST< because, they know……. Their Time is Almost Up. If they don't get a bill/Cap and trade out within a year, "climate change", will die slowly.
Here’s someone who wants to start the next Ice Age to counter “climate warming”by painting mountains white – a sort of twinking whiteout. Wonder what it will do to the weather.
http://www.telegraph.co.uk/earth/environment/climatechange/7859009/Inventor-paints-mountains-white-to-combat-climate-change.html
Below is my forecast for the remainder of the summer.
No one can get your prediction wrong now. 🙂 Pretty daring by the way. You must have lots of experience.
Is it possible that the IPCC is trying to rewrite the history books?
Ya.
this also a Steven Goddard video that shows the stationary mystery spot that disintegrated the moving chunk of ice near Barrow.
See http://www.guardian.co.uk/environment/2009/jan/21/global-warming-antarctica
Scientists have solved the enigma of the Antarctic apparently getting cooler, while the rest of the world heats up.
New research shows that while some parts of the frozen continent have been getting slightly colder over the last few decades, the average temperature across the continent has been rising for at least the last 50 years.
In the remote and inaccessible West Antarctic region the new research, based on ground measurements and satellite data, show that the region has warmed rapidly, by 0.17C each decade since 1957. “We had no idea what was happening there,” said Professor Eric Steig, at the University of Washington, Seattle, and who led the research published in Nature.
This outweighs the cooling seen in East Antarctica, so that, overall, the continent has warmed by 0.12C each decade over the same period. This matches the warming of the southern hemisphere as a whole and removes the apparent contradiction.
—-
This is just a news paper article, but it seems worth following up on.
@ Smokey: You should read the article, not just the headline.
http://wattsupwiththat.files.wordpress.com/2008/07/nyt_arctic_77442757.pdf
The “expert” is a non-scientist and the scientists think he his wrong. Jeeze.
Steve:
Your first graphic is worth a 1000 words.
Just The Facts says:
June 28, 2010 at 1:34 pm
Can anyone offer a counterpoint as to why they think Arctic Sea Ice offers a better proxy for Earth’s temperature and/or temperature trend?
{Sarcasm alert} Because, as per usual, Warmists are still desperately trying to “get lucky” – just once – at which point they’ll declare “victory” 24/7 in spite of the relevance of other natural and non-CO2AGW factors such as solar activity, clouds, currents + oscillations, winds and soot; and in spite of the vast preponderance of contrary fact and failed CAGW predictions, including, of course, the previously “critical” ones.
Postnormal Science works in flat-out reverse when compared to the Scientific Method, don’tcha know.
So surely if that one Yamal tree can try so valiantly to hold out for CAGW “tenets”, even against all of Scepticdom with its massive resources and quite mysterious powers of nearly Total World mind control, it’s well past time for the rest of the Artic to step up and do its part! Or at least until…uh…the next great PNS “proof” is delivered unto us…
GEOPHYSICAL RESEARCH LETTERS, VOL. 37, L09501, 5 PP., 2010
doi:10.1029/2010GL042652
Synoptic airborne thickness surveys reveal state of Arctic sea ice cover.
Christian Haas (and others)
Abstract:
“While summer Arctic sea-ice extent has decreased over the past three decades, it is subject to large interannual and regional variations. Methodological challenges in measuring ice thickness continue to hamper our understanding of the response of the ice-thickness distribution to recent change, limiting the ability to forecast sea-ice change over the next decade. We present results from a 2400 km long pan-Arctic airborne electromagnetic (EM) ice thickness survey in April 2009, the first-ever large-scale EM thickness dataset obtained by fixed-wing aircraft over key regions of old ice in the Arctic Ocean between Svalbard and Alaska. The data provide detailed insight into ice thickness distributions characteristic for the different regions. Comparison with previous EM surveys shows that modal thicknesses of old ice had changed little since 2007, and remained within the expected range of natural variability.”
So perhaps the state of sea ice cover in the Arctic is not as bad as we have been led to believe?
Roald says:
June 28, 2010 at 1:44 pm
There’s no doubt that the wind has some influence in the Arctic sea ice extent, but it can’t explain the negative trend:
http://nsidc.org/images/arcticseaicenews/20091005_Figure3.png
Allow me to enquire: If the sea ice RECOVERS FULLY each year —after its melt period— then precisely what point would you be trying to make?
And do tell: Why haven’t you posted a corresponding graph showing ice extent in the deepest part of the maximum ice period of each year?
Would that have been too inconvenient?
Just to show you how easy it is to cherry pick to show ice loss over a particular period is unprecedented. Running a 15 day moving average I was able to isolate a period during all but one of the last 8 years where the ice loss was higher than any of the other years. (Bearing in mind the past 8 years have shown the highest anomalies and lowest September extents).
18th March to 26th March 2003
29th March to 8th April 2004
5th Mar to 1th March 2005
2006 – no highest ice loss but did have several periods of slowest growth/recovery
15th June to 9th July 2007
10th August to 25th August 2008
10th July to 14th July 2009
So for any of the past 8 years you could have at one point said were losing ice faster than any other year in recent times. (or in the case of 2006 gaining ice more slowly).
PALEOCEANOGRAPHY, VOL. 25, PA2213, 21 PP., 2010
doi:10.1029/2009PA001817
Holocene sea ice history and climate variability along the main axis of the Northwest Passage, Canadian Arctic
by David Ledu (and others)
Abstract:
“Palynological, geochemical, and physical records were used to document Holocene paleoceanographic changes in marine sediment core from Dease Strait in the western part of the main axis of the Northwest Passage (core 2005-804-006 PC latitude 68°59.552′N, longitude 106°34.413′W). Quantitative estimates of past sea surface conditions were inferred from the modern analog technique applied to dinoflagellate cyst assemblages. The chronology of core 2005-804-006 PC is based on a combined use of the paleomagnetic secular variation records and the CALS7K.2 time-varying spherical harmonic model of the geomagnetic field. The age-depth model indicates that the core spans the last ∼7700 cal years B.P., with a sedimentation rate of 61 cm ka−1. The reconstructed sea surface parameters were compared with those from Barrow Strait and Lancaster Sound (cores 2005-804-004 PC and 2004-804-009 PC, respectively), which allowed us to draw a millennial-scale Holocene sea ice history along the main axis of the Northwest Passage (MANWP). Overall, our data are in good agreement with previous studies based on bowhead whale remains. However, dinoflagellate sea surface based reconstructions suggest several new features. The presence of dinoflagellate cysts in the three cores for most of the Holocene indicates that the MANWP was partially ice-free over the last 10,000 years. This suggests that the recent warming observed in the MANWP could be part of the natural climate variability at the millennial time scale, whereas anthropogenic forcing could have accelerated the warming over the past decades. We associate Holocene climate variability in the MANWP with a large-scale atmospheric pattern, such as the Arctic Oscillation, which may have operated since the early Holocene. In addition to a large-scale pattern, more local conditions such as coastal current, tidal effects, or ice cap proximity may have played a role on the regional sea ice cover. These findings highlight the need to further develop regional investigations in the Arctic to provide realistic boundary conditions for climatic simulations.”
So perhaps the recent sea ice extent in the NW passage is not that unusual after all?
You go girls!
Geoflynx
Using your logic we should be able to ignore the summer minimum.
As I said in mid-April –I’ll start getting interested again July 1-July 15. And now we’re almost there. If the JAXA line is still below 2007 on July 15th, then I’ll be concerned. I don’t expect that to happen.
I think it would be interesting to see a series of total Earth sea-ice plots. However, it does appear that the Antarctic sea-ice data is not as readily available for public download in simple text form as is the similar AMSR-E Arctic sea-ice extent data.
@Achab
you can cut it down to a 3rd order if you want. The minimum is still there.
Go Figure
Spector
You can get NSIDC Antarctica data here :
ftp://sidads.colorado.edu/DATASETS/NOAA/G02135/
It is a very slow site – be patient.
Whilst I wouldn’t classify the NYT as a font of scientific truth, Steve’s comparison of the two articles is disingenuous.
For starters, the two paragraphs he quotes are talking about two completely different places: the pack ice around Iceland in one, and the North Pole in the other.
Secondly if you actually read the 1969 article you see that even 40 years ago, the effect of CO2 on our climate was beginning to be understood. Steve conveniently quotes the paragraph that talks about the worrying effects of a cooling climate, but ignores all the points in the article that talk about the negative impact of a warmer climate: “A number of specialists believe that an ice-free Arctic Ocean would not freeze again. If so it has been predicted that storm paths would change and the food-producing areas of the Central United States and Eurasia might become deserts.”
So tell me, is it the NYT rewriting history or is it Steve Goddard rewriting the NYT?
All the
stevengoddard,
Over at nsidc.org, they say:
“PIOMAS, the average Arctic sea ice volume for May 2010 was 19,000 cubic kilometers (4,600 cubic miles), the lowest May volume over the 1979 to 2010 period. May 2010 volume was 42% below the 1979 maximum, and 32% below the 1979 to 2009 May average. The May 2010 ice volume is also 2.5 standard deviations below the 1979 to 2010 linear trend for May (–3,400 cubic kilometers, or -816 cubic miles, per decade).”
How do you answer this, same as Arctic temperatures that show station loss=increased temperatures? Even if true, I don’t credit it as being human caused, but still don’t think the figures reflect reality. What do you think?
Rob R says:
June 28, 2010 at 4:34 pm
So perhaps the state of sea ice cover in the Arctic is not as bad as we have been led to believe?
Yes. That’s what always happens when someone checks in to global warming for themselves: they find it’s not what we’ve been told.
David says:
June 28, 2010 at 3:16 pm
I don’t think I’ve seen anyone claim that there hasn’t been ice loss over the past 30 years. Much of the discussion has revolved around how much can be read into short term ice loss trends and how they’re likely to relate to the potential September mininum. In this context I find your comment a little disingenuous Anu.
Let me check if I quoted the article above correctly:
Yup, that’s what it said.
Perhaps stevengoddard “meant” it is some combination of climate changing, plus hard-to-predict “weather” on top of that trend of disappearing Arctic summer sea ice?
Nope, sounds like he’s arguing it’s the “weather”.
So basically, it is weather (wind) rather than climate which controls the summer minimum.
Ah, it is the wind which controls the summer minimum. Good to know:
http://nsidc.org/images/arcticseaicenews/20090917_Figure2.png
Then why not 7.5 million sq. km. this summer minimum ? Is the wind incapable of duplicating what it did in 1980’s or 1990’s anymore ? Why ?
Perhaps David would like to explain how 40 years of changing “weather” has nothing to do with a changing climate:
http://iup.physik.uni-bremen.de:8084/amsr/ice_ext_n.png
Here is a quote with no attribution. Has a scientist actually said this – using the present tense? I doubt it, partly because ‘ice cap’ refers to ice covering land, and partly because I’ve nowhere read a scientific assessment that Antarctic ice as a whole is currently melting. IOW, isn’t this a straw man?
This hyperbole is definitely a straw man. Ozone depleting gases are not associated with SUVs. Of course, CFCs and the like are hardly limited to the US.
Steig’s paper agrees that Antarctica has cooled very slightly in the last 30 years. But it has warmed slightly if the record is extended to the last 50 – 60 – with strong caveats.
How? The scientific view is that most of the Antarctic is relatively thermally isolated from the rest of the world, and that a warming world will begin to influence the region more precipitously in a few decades. Those areas not isolated by the polar winds (peninsula), have warmed significantly. How is any of this irrational? Isn’t it, alternatively, irrational to imply that every region of the world should march in lock-step with every other? It would be easier to imagine the earth as a featureless billiard ball where regional change conforms all over, but the truth is more complex.
Steve Goddard says:
June 28, 2010 at 4:51 pm
Geoflynx
Using your logic we should be able to ignore the summer minimum.
GeoFlynx –
Why? I think I just said the Northern Hemisphere ice was the more important issue at this time and that the apparent balance mechanism in global sea ice that you cited was due to the seasons. I believe the indications, given by the state and trend of the cryosphere, should not be ignored.
Is there such a thing as an Atlantic La Nina?
Like a 3.4 off the African coast.
SouthAmericanGirls says: June 28, 2010 at 3:40 pm
“Excellent post. But I still do not know what PIPS mean.”
PIPS in the U. S. Navy’s Polar Ice Prediction System. PIPS 2.0 is the current version that’s publicly available:
http://www7320.nrlssc.navy.mil/pips2/index.html
PIPS 3.o is “The most recent upgrade to the Navy’s ice prediction capability is the development of the next generation forecast system: PIPS 3.0. Improvements to this new forecast system include higher horizontal resolution, a more sophisticated ocean model, improved data assimilation and perhaps most important, an improved sea ice model, based on the Los Alamos CICE model. This sea ice model will include a Lagrangian formulation for calculating a multi-category ice thickness distribution, a snow layer, a brine pocket parameterization, non-linear profiles of temperature and salinity (Bitz and Lipscomb, 1999). The CICE model is presently being tested by NRL with Navy Atmospheric forcing from the Navy Operational Global Atmospheric Prediction System (NOGAPS). This model will be coupled to Navy Operational global ocean models. These improvements are geared towards providing better forecasts of formation and lead orientation. The PIPS 3.0 is presently going through its final development.”
Here is the PIPS 3.0 website, which doesn’t appear to have been modified since “01 August 2003”:
http://www.oc.nps.edu/~pips3/
Anu says:
June 28, 2010 at 2:39 pm
Hey, it’s just the wind, and nobody can predict that, right ? The planet has been “cooling” for 15 years, and PIPS 2.0 shows “thick” ice all over the Arctic Basin. The Arctic sea ice will be partying like it’s 1989 this September, no doubt.
VILLABOLO SAYS:
Hey Anu, I’ll bring the beer for the PARTY. You can bring some of the “thick ice” to chill it. Hope it’s not rotten!
This is the time the summer extent can be predicted. Right now the slope looks moderate but we’ll have to wait until the extent reaches 8sqkm. If the slope of the extent is highly negative then, it will be a small extent. If it flattens out, it will be a large extent. Let’s just wait.
Mauibrad says:
June 28, 2010 at 5:18 pm
“American Physicist Joins Attack on Global Warming Theory”
http://news.suite101.com/article.cfm/american-physicist-joins-attack-on-global-warming-theory-a255036
Dr. Charles R. Anderson makes his announcement on his website (June 28, 2010) in joining a growing band of professional scientists, international academics and climate experts prepared to put their reputations on the line and denounce the orthodox views held by an influential clique of discredited government climatologists.
The catalyst for the sudden willingness to speak out against the once widely accepted theory of global warming may be an impressive new online publication, ‘A Greenhouse Effect on the Moon?’ by Dr. Martin Hertzberg, Alan Siddons and Hans Schreuder.
This looks very important (I navigated to the paper on the moon – not being a black body) and points to a component in global heat budget that has been ignored – heat storage of the land surface. OK there is more sea surface and water has more heat capacity. But land surface heating / cooling and storage / re-release of heat cannot be ignored. (The fact that temperature in caves is taken as an integrator of recent climate temperature – thus stalagtites can be used as climate proxies, tells us this also.)
http://wattsupwiththat.com/2010/05/26/in-which-i-go-spelunking/
Land is where people live and where ice ages happen. The earth just like the moon is nowhere near being a black body. Land contributes (with the sea) to global thermal inertia and also to earth temperature being much higher than predicted by black body calculations – no need for CO2 to exclusively explain this.
Waiting for the necessary data to actually make informed conclusions about ice and climate is like watching two snails race.
Oh well .. at least I won’t miss much while I go to the concession stand. :-p
At a presentation within the last couple of years, His Goreness claimed that *both* polar ice caps would be completely melted away within five years or so.
Hey Al, how many polar ice caps are there? Answer: There’s only one, and it’s in Antarctica. Although there’s a lot of sea ice at the N Pole, there is no ice cap there. There are ice caps at relatively high latitudes in the N hemisphere: a big one in Greenland, and a small one in the S half of Iceland.
the trolls are about
Mike says: June 28, 2010 at 4:09 pm
“See http://www.guardian.co.uk/environment/2009/jan/21/global-warming-antarctica
Scientists have solved the enigma of the Antarctic apparently getting cooler, while the rest of the world heats up.”
It’s very hard to take this article seriously as it is clearly Warmist propaganda, e.g. “Research ‘kills off’ climate sceptic argument” “Scientists have solved the enigma” “it is the final piece in the jigsaw.” etc. Furthermore the study cited within is by Eric Steig, a Geochemist at the University of Washington and a member of the Real Climate team:
http://www.realclimate.org/index.php/archives/2004/12/eric-steig/
http://www.realclimate.org/index.php/archives/category/extras/contributor-bios/
I am however pleased that we are getting to some of the sources of the ignore Antarctica meme. Can anyone cite a study supporting the Warmist position on Antarctica that wasn’t penned by someone from the University of Washington;
http://psc.apl.washington.edu/zhang/Pubs/Zhang_Antarctic_20-11-2515.pdf
and who isn’t also responsible for this;
http://psc.apl.washington.edu/ArcticSeaiceVolume/IceVolume.php
garbage model?
Google search for “the polar ice caps are melting” (in quotes) returns about 81,900 results
GeoFlynx
The anomaly data is normalised. The fact that the global anomaly data has remained constant has absolutely nothing to do with seasons. That is one reason why people normalise data – to remove cyclical behaviour.
GeoFlynx says: June 28, 2010 at 3:23 pm
“A good mechanism for the above observation would be: it’s winter in the Antarctic when it’s summer in the Arctic. Climatologists claim that Northern Hemisphere ice cover and extent has a greater effect on global temperature than ice in the Southern Hemisphere. The sum of both ice fields may not be a good indicator of climate change.”
You state that, “Climatologists claim that Northern Hemisphere ice cover and extent has a greater effect on global temperature than ice in the Southern Hemisphere.” Can you please cite these climatologists and supply links to the relevant studies supporting your assertion?
The point being that winter ice extent, well you could put that where the sun don’t shine. The extent during the summer tho, that has a significant effect on the albedo, and thus the heat input into the region since the absorption of water for solar radiation is considerably higher than that of ice. The ice extent in the south during summer has been falling, and the extent during summer in the north, well that has fallen off the cliff.
Now I have to ask are you just trolling Anu?
Do you assert that in any given year that localised weather conditions are not likely to have a significant impact on the September minimum ice extent. Do you really assert this?
Have you ever seen me argue anywhere on any thread that climate will not change?
Let me make a few points clear so you cannot misinterpret Anu.
Yes, I do believe our climate has changed over the past 30 years just has it has over the entire history of this planet.
Yes I do believe we have seen some degree of warming over the past 30 years in that a predominantly positive PDO has lead to a higher frequency of el-nino conditions leading to a very strong 98 el-nino and this has contributed to a gradual loss of multi-year ice in the Arctic.
No I don’t believe the entire blame for this is atributable to man-made CO2 emissions nor do I believe them to be the main driver although I do accept that CO2 has contributed to a minimal degree.
Yes I do believe natural climate cycle variations have been the main driver of ice loss over the past 30 years.
Yes, I do believe that in a given year, localised wind and ocean currents play a significant role in determining the September minimum extent. Although I would highly suspect the average over the past 10 years has been lower due mainly to the previously mentioned 30 years of warming and the after effects of the very strong 98 el-nino which I believe was the main driver in the current lack of multi-year Arctic Ice.
Finally and most importantly, I would argue that large differences in the degree of ice loss from month to month are more likely to be attributable to localised conditions rather than trying to argue they demonstrate any sort of long term trend.
When you look at the 2007 result it is clear the massive extent of the ice loss was not the norm and was more due to an unusual confluence of localised Arctic conditions. Sure the warming of the past 30 years made the ice more vulnerable and exacerbated things but how often do those localised conditions that caused the actual ice loss in 2007 occur? The recoveries of 2008 and 2009 I think clearly demonstrate this. No death spiral.
So there’s more ice in the Antarctic and less in the Arctic. Total volume at the poles is a wash.
I wish someone could explain to me what’s the downside of less arctic ice and more antarctic ice. Seems to me it would be great to have the high northern latitudes warmer. Every little bit extends growing seasons and expands total arable acreage. It would be great to have a reliable NW Passage too. Save a lot of time and fuel in intercontinental shipping. Colder at the south pole – who cares? That’s a good place for the ice. Not like the Anarctic continent is ever going to be warm enough to grow corn or apples.
http://en.wikipedia.org/wiki/Polar_ice_cap
Larry Fields,
The terminology is problematic, but according to wikipedia there are two polar ice caps on Earth. If Gore claimed that both would melt away within five years or so, he is/was wrong. Where did he make that claim? Is it documented?
Does anybody know when we will see data from cryo sat 2?
http://www.esa.int/esaLP/ESAOMH1VMOC_LPcryosat_0.html
From the 9th century to the 13th century almost no ice was reported there.
It was even warmer on earth 6000 years ago than then.
The Wet Sahara:
Southern sea ice has more impact on earth’s albedo than northern hemisphere ice, because Antarctic ice forms at lower latitudes.
Also, the southern peak positive anomaly occurs at the summer solstice, whereas the northern hemisphere peak negative anomaly occurs at the equinox, when it has no effect on the earth’s radiative budget.
Claims that Arctic ice is somehow more important than Antarctic ice are simply incorrect.
stevengoddard says:
June 28, 2010 at 6:57 pm
Google search for “the polar ice caps are melting” (in quotes) returns about 81,900 results
And Google search for ‘climate skeptics are crazy’ returns about 163,000 results.
What’s your point ?
That Google sure does search all kinds of sites ?
Bob Tisdale in his latest post points out that the North Atlantic and Arctic ocean heat content has been rapidly falling since 2005. In fact it is responsible for most of the rise and decline in global OHC over the last 30 years. The previous rapid rise from 1998 to 2005 correlates with the accelerated decline in arctic sea ice extent and volume.
http://bobtisdale.blogspot.com/
Bob speculates that the OHC decline may continue for twenty more years. This should make the warmists nervous.
Anu
Every school child in America has been taught that the polar ice caps are melting, because their teachers have been fed this garbage by government scientists and their proxies.
I must have missed the realclimate post where they tried to set the record straight. Perhaps Chu made a speech saying that the polar ice caps aren’t melting?
Give me a break.
richcar 1225,
I did read that it was expected to be all systems go by October, but I can no longer find that reference.
phlogiston says: “…This looks very important (I navigated to the paper on the moon – not being a black body) and points to a component in global heat budget that has been ignored – heat storage of the land surface.”
I’ve heard that land heat capacity is very small because of the insulating value of dirt, sand, etc., relative to water. But do we know for sure that land heat capacity doesn’t appear in GCM’s?
richcar 1225,
This has a little more information:
http://www.sciencepoles.org/articles/article_detail/mark_drinkwater_on_cryosat-2_and_its_mission/
“By July 2010 we hope to start distributing data to a limited number of scientists – with a caveat of course – before we open distribution to a much wider user community. The validation that would have to take place before mid-summer will probably give us enough confidence to allow our calibration and validation team to really get a solid understanding of the data and be able to recognize what kind of margin of error measurements can produce and why and correct for that.
We’re first going to start distributing data to a select team of external scientists who applied to be testers of the initial data products. They’ll provide us with feedback on the quality of the product, which will help us revise the processing of the products to try and get the highest possible quality data out to the broader user community.”
Bravo Steve! An encore performance. Perhaps your best Sea Ice News update yet. you may want to check your very opening graph however. It seems you’ve got the Antarctic sea ice topping out each year close to 18 million sq. km. It usually tops out around 15.5 million. Please also note that it usually falls below what the Arctic traditionally has at the minimum, at around 2.0 million, where as the Arctic has traditionally been around 6 million or so (except for these last few years, as we all know)
A few things out of the gate:
Back in March, when you and many other skeptics were tooting your horns as the Arctic Sea ice “bumped” up to near normal conditions, I hope you recall that I (and others) kept pointing back to the entire winter history of the ice when it was at or very near lows during the winter and urging caution over the giddy skeptic pronouncement that the Arctic Sea ice had recovered. Thick, melt resistant ice simply doesn’t form in a few weeks, and so, those of us who’ve studied the ice, professionally or non, knew that what goes up that fast, must come down that fast, especially considering the fact that the Arctic as a whole has seen (and continues to see) temps running several degrees above average. The “bump up” was bound to go bust, and so it has, with the biggest March 31 to June 28 decline on the record books.
Many have asked why we should focus so much on the Arctic and ignore the Antarctic and its record positive slope. Well, the answer is: no professional who studies the cryosphere is ignoring the Antarctic. Hundreds, or perhaps thousands of scientists are studying it every day. The fact is however, that the weather of the N. Hemisphere, where the bulk of the worlds populations resides, is more influenced by the Arctic than the Antarctic.
But I want to cut right to the issue of wind, as it really IS central to what is going on in the Arctic in many complex ways, but most salient to the discussion here is the change in the winds brought about by the very warming of the Arctic itself. Julienne has spoke about it at length here, and mentioned some of the critical studies related to the Dipole Anomaly. This seems to be one of the real positive feedback events that may be traceable back to warmer Arctic waters releasing more heat later into the season and altering long term wind patterns. Heat and wind are integrally related, and the Dipole Anomaly seems to be self-reinforcing, and become less of an anomaly 9as it was just a few years ago) and more of a regular feature of the Arctic weather patterns.
The DA does many things. It opens up the normally closed wind circulation of the Arctic, bringing more warmth to the Arctic, but it also shunts more cold air out of the Arctic down south– hence the reason that the Arctic could see warmer winters while we see tougher ones down south here. Remember my comments this past winter when it was snowing in Florida but 35 degrees F in Greenland ? This is where the DA becomes a positive feedback mechanism, in that the warmer things get, the stronger and more frequent the DA appears to become.
I must applaud you Steve for putting it all on the line in creating your little graph that shows how things are going to progress this summer. You must believe that there is indeed a whole bunch of hidden volume (via your PIPs 2.0 model) that is going to prove tough to melt once the fringe areas melt. I happen to believe quite the opposite. I think PIPS 2.0 thickness data is pretty much worthless, and I think the direct “on the ice” observations of people like David Barber, and his finding the ice far more weak and unlike anything they’d expected for multi-year ice is confirmation that the PIPS 2.0 really does have it wrong (as many professionals ignore it for that reason), and that PIOMAS is much closer with projections of 4.4 to 4.7 million sq. km. which are far closer because they’ve got the volume data closer than PIPS 2.0 could ever.
My long standing projection of 4.5 million sq. km., which I made back in March (or was it February?), but anyway…it still looks pretty good to me, especially in looking how the Dipole Anomaly may be running strong, and I may even revise it DOWNWARD a bit around July 15, based on the early July melt. But you are right on one point– the exact final number for Arctic sea ice extent is really up to the weather, but this year has seen no recovery in sea ice, (quite the opposite) and so skeptics will have to look elsewhere to find issues with AGW models.
I also to think the offer by one poster here for us to do an after the season analysis of why we were right/wrong and what we learned is a fantastic idea.
stevengoddard says:
June 28, 2010 at 6:59 pm
GeoFlynx
The anomaly data is normalised. The fact that the global anomaly data has remained constant has absolutely nothing to do with seasons. That is one reason why people normalise data – to remove cyclical behaviour.
GeoFlynx –
OK, I admit the “season” thing was a bit of a good natured tease based on your wording. However, if we do as you say and normalize the global sea ice data to remove the higher frequency seasonal trend it looks like this:
http://arctic.atmos.uiuc.edu/cryosphere/IMAGES/global.daily.ice.area.withtrend.jpg
If we accept this graph and its authors, global sea ice is not balanced and shows a clear decline.
Anu says: “Google search for ‘climate skeptics are crazy’ returns about 163,000 results….”
Anus’ statement is based on strange logic, once again. A properly parsed Google search for “climate skeptics are crazy” gives 99 results, not 163,000. Either Anu’s Google searches are incompetent, or he’s unable to deal with facts without fudging them.
Here’s a good example of the “Polar Ice Caps Melting” in the MSM, including a “pretty scary” and “unprecedented” interview with Walt Meier of the NSIDC:
My respect for Walt just melted…
R. Gates says: June 28, 2010 at 8:47 pm
“you may want to check your very opening graph however. It seems you’ve got the Antarctic sea ice topping out each year close to 18 million sq. km. It usually tops out around 15.5 million.”
I assume you are speaking of Antarctic Sea Ice Area:
http://arctic.atmos.uiuc.edu/cryosphere/IMAGES/seaice.area.antarctic.png
whereas Steve posted a chart on Antarctic Sea Ice Extent:
http://www.iup.uni-bremen.de:8084/amsr/ice_ext_s.png
R. Gates says: June 28, 2010 at 8:47 pm
“Many have asked why we should focus so much on the Arctic and ignore the Antarctic and its record positive slope. Well, the answer is: no professional who studies the cryosphere is ignoring the Antarctic. Hundreds, or perhaps thousands of scientists are studying it every day. The fact is however, that the weather of the N. Hemisphere, where the bulk of the worlds populations resides, is more influenced by the Arctic than the Antarctic.”
I am not concerned with the number of scientists studying the Antarctic, nor the minor impact that Arctic sea ice changes may have on “the weather of the N. Hemisphere.”
My question for you is, which of Earth’s poles’ sea ice offers a more accurate proxy of Earth’s temperature and temperature trend, and why?
R Gates,
You are confusing area with extent.
http://www.iup.uni-bremen.de:8084/amsr/ice_ext_s.png
Ray says:
June 28, 2010 at 12:32 pm
“Just for fun I did the first derivative of the ice extent on the JAXA graph. The rate of decline has passed its peak around the 10th of June… so the decline speed is actually slowing down already.
Are you delusional? 2010; 10 to 19 June melt; 588,438 KM2 @ 65,382 KM2 per day
June 17 to 27 melt; 695,156 KM2 @ 77,240 KM2 per day
Comparing with 2009 and taking the late melt start of 31 March 2010 as starting point (both years had 14.41 KM2 on that date), 2010 lost 5.82 million KM2 and 2009 lost 3.94 million KM2. 2010 leads 2009 by 1.34 million KM2.
2009 had four 100,000+ KM2 melt days between May 19 (the first 100,000+ KM2 day) and today, while 2010 has eight of which four were before May 19.
Using IRAC-JAXA data.
In 2009, between 29-6 and 25-7 there were ten 100,000+ melt days. I expect that 2010 will have at least as many such days, but probably more, giving it a total of 18. The total for 2009 was 15 days, the last one on 25-7. This makes a mockery of the “arctic has recovered” claim.
In order for 2010 to drop to 2007 (4.25 KM2) it needs to melt a further 4.88 KM2 @ 62,594 KM2 per day, using 13 September 2009 as end date. Over that period 2009 melted 5.77 KM2 @ 74,034 per day.
Conclusion; The 2010 melt does not even have to match the 2009 melt from now on. If it were to do so, the ice extent would be 890,230 KM2 below 2009 or 4.36 million KM2, just 110,000 KM2 above 2007. I don’t discount the possibility of 2010 setting a new record. Just confirmed, most recent melt 142,187 KM2, dropping the ice extent to 8,98 million KM2. (IRAC-JAXA) 28 June.
Apparently someone missed this article from six weeks ago.
http://wattsupwiththat.com/2010/05/15/sea-ice-graphs-have-limited-predictive-value/
While it speaks for itself, please insert the word “million” after numbers 4.41, 4.25, 4.88 and 5.77
Regarding this statement in the article:
“Never mind that the Antarctic Peninsula is an active volcanic ridge, and that the waters around it have not shown any significant warming.”
Can you address this presentation and paper?
http://www.whoi.edu/cms/files/Gille_50024.pdf
Summary slide says this: “Southern Ocean has warmed significantly over last 50+ years, and warming is concentrated in the ACC.” [ACC = Antarctic Circumpolar Current]
http://www-pord.ucsd.edu/~sgille/pub_dir/i1520-0442-21-18-4749.pdf“ entitled “Decadal Scale Temperature Trends in the Southern Hemisphere Ocean”, Journal of Climate, 2008.
A short summary from NERC dated 2007 says the following:
As far as I can tell from these links, the ACC constitutes the waters around the Antarctic Peninsula. These sources purport to indicate that the ACC is warming.
One final question: why is the plot shown below the quote that initiates this post a plot of lower tropospheric temperatures, while the quote is actually about sea surface temperatures?
“Is it possible that the IPCC is trying to rewrite the history books?”
The hockeystick and ClimateGate emails shows that this was indeed the intention.
Delete LIA and MWP and get a hockeystick. The warmers try the same with Arctic Ice.
Thats why they get so frenetic whenever historic facts about an icefree north pole comes up. They hate that.
Why? Because it indicates natural cycles.
-They hate natural cycles.
-They love Hockeysticks.
Thats why they are called The HockeyTeam.
http://www.ktuu.com/Global/story.asp?S=10140922
Oakden,
GISS shows a whopping 0.2C rise in SSTs around the Antarctic Peninsula over the last 100 years.
http://data.giss.nasa.gov/cgi-bin/gistemp/do_nmap.py?year_last=2010&month_last=5&sat=-1&sst=3&type=trends&mean_gen=05&year1=1910&year2=2010&base1=1951&base2=1980&radius=250&pol=reg
In three days, the slope of the Arctic extent graph will begin to drop off.
Mark it on your calendar.
GISS shows no change in SSTs around the Antarctic Peninsula over the last 50 years.
http://data.giss.nasa.gov/cgi-bin/gistemp/do_nmap.py?year_last=2010&month_last=5&sat=-1&sst=3&type=trends&mean_gen=0112&year1=1960&year2=2009&base1=1951&base2=1980&radius=250&pol=reg
I don’t think the Antarctic extent is getting bigger due to colder ocean temps due to no El Nino and end of PDO cycle, if you look at current SST anomaly it is mainly same or higher than average
http://weather.unisys.com/surface/sst_anom.html
Andy
Those NSIDC maps are not quite what they should be. Gulf of Finland and Gulf of St.Lawrence have been ice-free quite a while.
Apparently Africa has it’s own El Nino:
http://207.190.239.143/Whats_New/Archives/Benguela_Currents.pdf
Anu says:
June 28, 2010 at 8:12 pm
And Google search for ‘climate skeptics are crazy’ returns about 163,000 results.
What’s your point ?
Your arguments are always shallow. But let’s go with that for a moment anyway: if what you call “skeptics” don’t have a real argument and they are crazy then why do you spend so much time here? It’s because you’re afraid? You must not be convinced of your own arguments.
stevengoddard says:
June 28, 2010 at 9:42 pm
R Gates,
You are confusing area with extent.
Don’t expect him to know what he’s doing.
For those that are not so science savvy:
Just remember, all satellite computer models creating the data that draw all arctic sea ice maps are not created equal.
See the many ways you can count the sea ice:
http://arctic-roos.org/observations/comparison-of-algorithms
Some commenting tend to think that this sea ice extent and concentration data is just downloaded from the satellites, untouched by human and computer intervention, not so. The real raw data is ‘brightness’ readings of various microwave bands that is sent down and then massaged and adjusted by computer models to create the derived data that is used to draw and color all of the maps you see on the web.
Even if the satellite instruments are in perfect calibration, big differences still occur due to the different equations (algorithms) used to create the data.
Always keep clear what you are actually looking at and who created it!
We don’t need no stinkin’ IPCC.
Just The Facts says:
June 28, 2010 at 1:34 pm
“As Steve notes, Antarctic Sea Ice Extent continues to increase rapidly and is currently well above average, and significantly exceeds NSIDC’s misleadingly narrow “normal” range:”
xxxxxxxxxxxxxx
This is what the NSIDC says; “Unlike the Arctic, where the downward trend is consistent in all sectors, in all months, and in all seasons, the Antarctic picture is more complex. Based on data from 1979-2006, the annual trend for four of the five individual sectors was a very small positive one, but only in the Ross Sea was the increase statistically significant (greater than the natural year-to-year variability). On the other hand, ice extent decreased in the Bellingshausen/Amundsen Sea sector during the same period. http://earthobservatory.nasa.gov/Features/SeaIce/page4.php
xxxxxxxxxxxxxxxx
So now the “normal line” is misleadingly narrow? Just reminding you not to confuse average with normal. Reading across the comments I sense that attention is now being switched to the Antarctic, given that the “recovered” arctic continues to be unwilling to co-operate. Today’s loss of 141,000 KM2 must feel depressing. The reality depresses me, mainly because it seems unstoppable and that’s not good for the planet.
Steve, Nice summary about arctic ice. I’m sure that Your forecast is not simple a guess and it would be very nice if You provide some arguments of Your forecast. What was taken in account ( average wind patterns, area and location of open water, ice volume, average ice volume loss for given period …). If statistical methods where used then You have some uncertainty. What is Your results for root quadratic mean …
899 says:
June 28, 2010 at 4:37 pm
Roald says:
June 28, 2010 at 1:44 pm
There’s no doubt that the wind has some influence in the Arctic sea ice extent, but it can’t explain the negative trend:
http://nsidc.org/images/arcticseaicenews/20091005_Figure3.png
Allow me to enquire: If the sea ice RECOVERS FULLY each year —after its melt period— then precisely what point would you be trying to make?
And do tell: Why haven’t you posted a corresponding graph showing ice extent in the deepest part of the maximum ice period of each year?
Would that have been too inconvenient?
Not inconvenient at all, thanks for the cue. Here you can see the trend in March sea ice extent:
http://nsidc.org/images/arcticseaicenews/20100406_Figure3.png
As many others have already pointed out, the sea ice does not fully recover each winter. The winds can’t be responsible for a several decades long decline, unless changes in wind patterns are driven by Global Warming themselves.
Curious Yellow
Reading your comment, I sense that you didn’t read the article very closely.
R. Gates says: June 28, 2010 at 8:47 pm
[–SNIP–]
“The fact is however, that the weather of the N. Hemisphere, where the bulk of the worlds populations resides, is more influenced by the Arctic than the Antarctic.”
Just The Facts says: June 28, 2010 at 9:36 pm
“I am not concerned with the number of scientists studying the Antarctic, nor the minor impact that Arctic sea ice changes may have on “the weather of the N. Hemisphere.””
“My question for you is, which of Earth’s poles’ sea ice offers a more accurate proxy of Earth’s temperature and temperature trend, and why?”
VILLABOLO RESPONDS:
As far as your question concerning which pole makes a more accurate proxy of GW the answer is neither of them.
The Arctic Sea Ice Cap is influenced by temperatures out of proportion to the statistical average for the Globe.
Antarctica, by virtue of its size compared to Greenland (10X), circular circulation of frigid waters around the continent and lower proportion of Global Warming temperature rise, is more resistant for the time being, to its effects.
Furthermore, the issue is moot. We are not going to learn anything meaningful by comparing either one to some abstract statistic. Instead, we have to take into account how the temperature rise in those particular regions and others will effect our immediate region as well as the climate in general.
Your statement: “I am not concerned with . . . the minor impact that Arctic sea ice changes may have on “the weather of the N. Hemisphere.”” shows a severe lack of understanding of the physical processes involved. Unless you, and any family of yours, live in some well hidden fortress stocked with essential supplies up the ying-yang your statement shows a flippant attitude towards the powerful dynamics of Earth’s climate.
The issue is not even what you believe as regards AGW but whether you aware of the repercussions that a rapid change in such an important feature of the environment will create. It seems like you equate the mere possibility of weather/climate catastrophe with AGW. If so, I advise that you pay some attention to the Mayans.
Jarmo’s comment needs attention, on NSIDC ice map for 06/27/10 there seems to be ice in Gulf of Finland which is certainly NOT the case. So how can I trust other areas??
Amino Acids in Meteorites says:
June 28, 2010 at 7:47 pm
From the 9th century to the 13th century almost no ice was reported there.
It was even warmer on earth 6000 years ago than then.
The Wet Sahara:
VILLABOLO RESPONDS:
A little knowledge is a dangerous thing. One needs to know the whole background before making a judgment.
The Sahara, as the citation below indicates, was warmer than today because the Earth had a stronger tilt towards the Sun. This led to a shifting, not a disappearance, of desert area in the region. The desert simply shifted in position creating a desert to the south of what is now the Sahara.
The different dynamics involved simply changed the location of Earth’s deserts. What’s good for the Sahara is not good for the rest of the world.
See “Why Deserts Will Inherit The Earth”: http://www.independent.co.uk/environment/why-deserts-will-inherit-the-earth-481091.html
As to making a comparison with today’s situation, a continuing increase in CO2 will nullify any effect a previous amount would have had. It is simply not wise to argue by analogy.
************************************************************************
http://en.wikipedia.org/wiki/Sahara#Climate_history
“Once the ice sheets were gone, northern Sahara dried out. In the southern Sahara though, the drying trend was soon counteracted by the monsoon, which brought rain further north than it does today. The monsoon is due to heating of air over the land during summer. The hot air rises and pulls in cool, wet air from the ocean, which causes rain. Thus, though it seems counterintuitive, the Sahara was wetter when it received more insolation in the summer. This was caused by a stronger tilt in Earth’s axis of orbit than today, and perihelion occurred at the end of July.[15]”
FYI, Just held a ruler up to the slope of the last few weeks of 2010. They won’t converge in the next week at that rate. In fact, they won’t converge even up to the end of that graph.
Well, all I’m interested in is the minimum mass of ice. And I would like to have it in kg. 😀 2-3 significant digits would be more than enough. What the helt are you talking about? Excuse the typo.
A quote from R Gates..and I’m not taking sides here..just making a 30K feet observation
‘I also to think the offer by one poster here for us to do an after the season analysis of why we were right/wrong and what we learned is a fantastic idea’.
You mean you guys (from whatever persuasion), don’t do this as a matter of routine every few months? What in military terms is a ‘debrief’…or in commercial life is a ‘wrap up’ or ‘project review’? You just plough relentlessly on, knowing that you are right, but never look back to check your methods or your errors? To learn anything about them? To do a bit of strategic thinking about the problem?
I’ve long been very dubious about the quality of the work presented as part of ‘climate science’, and this apparent lack of basic professionalism only strengthens that view.
I can only guess that you are all too obsessed with scoring points off the other guy that you have lost track of the big picture. Please tell me I am wrong and that I have misinterpreted Gates’ remark.
“The temperature of the winter season, in northern latitudes, has suffered a material change, and become warmer in modern, than it was in ancient times. … Indeed I know not whether any person, in this age, has ever questioned the fact.” —Noah Webster, 1758-1843 (founder- Websters dictionary)
Tonyb
Gail Combs: June 28, 2010 at 3:00 pm
Also another rewrite of history in hopes of getting rid of the Little Ice Age, is that the Norse left Greenland because of poor farming practices causing soil erosion and not because of the increasing cold.
How do they account for the fact that it was warm enough to grow crops *then* that can’t be grown there now because the growing season is too short? Do they claim the Vikings had magic, cold-resistant strains of grain or rapidly-maturing grasses suitable for making hay that have gone extinct because it’s getting *warmer*?
Moderators
Last night I posted a long item with some 17 historical links. Have they ended up in the spam bucket? My fault, must try to restrict the length-hence my 1.14 am is my shortest ever 🙂
tonyb
AndyW says:
June 28, 2010 at 10:24 pm
I don’t think the Antarctic extent is getting bigger due to colder ocean temps due to no El Nino and end of PDO cycle, if you look at current SST anomaly it is mainly same or higher than average—
Try looking at the data instead
http://weather.unisys.com/surface/sst.html
Curious Yellow says:
June 28, 2010 at 11:48 pm
Reading across the comments I sense that attention is now being switched to the Antarctic, given that the “recovered” arctic continues to be unwilling to co-operate.
Actually, that’s another side to the same coin: The Global Sea Ice Extent and Anomaly.
If the Earth consisted solely of 1 hemisphere, you’d have a point. It does not.
Sea Ice floats, C02 induced Climate Change (nee AGW) does not, it sinks.
David Gould wrote:
June 28, 2010 at 7:38 pm
http://en.wikipedia.org/wiki/Polar_ice_cap
“Larry Fields,
The terminology is problematic, but according to wikipedia there are two polar ice caps on Earth. If Gore claimed that both would melt away within five years or so, he is/was wrong. Where did he make that claim? Is it documented?”
Part A. I took a glance at the Wikipedia article. Reading between the lines of the first paragraph, a POLAR ice cap does not necessarily qualify as an ice cap! Why? Because the latter can form only on land, whereas this restriction does not apply to the former.
Sometimes arguing about the TRUE meaning of a word is not particularly productive. And I’m not a glaciologist. Nevertheless I’d like to filk the famous Supreme Court definition of pornography:
I can’t define a polar ice cap, but I can recognize it when I see it.
My follow-up question:
How much beer went into the crafting of this poorly-written Wikipedia article?
Part B. Here’s a quote from The Goracle. It’s in the context of his perception of a shift in view on the part of some business leaders.
“They’re seeing the writing on every wall they look at. They’re seeing the complete disappearance of the polar ice caps right before their eyes in just a few years.”
LINK.
http://www.guardian.co.uk/world/2009/mar/14/al-gore-climate-change1
Apparently “a few years” in Gorespeak translates to “5 years or so” in plain English. So now we have less than 4 years until all of the ice in Antarctica, much of which is more than one mile thick, is completely melted. Please pass the Kool-Aid.
The polar ice caps are in fact melting.
Both the Arctic and Antarctic ice sheets are losing ice at an accelerating rate, as per GRACE data.
http://www.agu.org/pubs/crossref/2009/2009GL040222.shtml
It is good to know that pupils in American schools are being taught the scientific truth.
Also, I think newspapers tend to pander to sensationalist and exaggerated claims in order to sell more. I could quote newspapers articles about UFOs and psychics and all sort of unscientific crap. So I think we should stick to scientific publications in order to argue our points.
If global sea ice extent and associated albedo is of climatic significance then why don’t JAXA & NSISDC show a combined graph of both hemispheres with the real daily global cryosphere situation ?
Hypnos says:
June 29, 2010 at 2:14 am
Shall I trust your reference, which is behind a paywall, or the data?
http://arctic.atmos.uiuc.edu/cryosphere/IMAGES/seaice.anomaly.antarctic.png
The antarctic is increasing, not decreasing.
OK Hypnos, (hope you are not asleep:) ) I found a pdf
http://thingsbreak.files.wordpress.com/2009/10/increasing-rates-of-ice-mass-loss-from-the-greenland-and-antarctic-ice-sheets-revealed-by-grace.pdf
If the analysis is to be trusted, then there is a large discrepancy between the two measurements.
Each gravity solution consists
of spherical harmonic (Stokes) coefficients, Clm and Slm,
up to l, m 60. Here, l and m are the degree and order of
the harmonic, and the horizontal scale is 20,000/l km.
The GRACE C20 coefficients, which are proportional to the
Earth’s oblateness, show anomalously large variability, so
we replace them with values derived from satellite laser
ranging [Cheng and Tapley, 2004].
[5]
He has changed the fit ,even, “hiding the decline” ?.
If I were peer reviewing this paper, I would ask to see the fits over a control region , for example that low region in the pacific shown in the recent article quoted here, http://wattsupwiththat.com/2010/06/28/21178/ : the discrepancy could be reconciled if the geoid is changing at some rate, not yet measured. After all there still is continental drift, why not lift and sink also?
The basic assumption that is not stated is that the geoid does not change with time.
It is possible that the changes in gravity observed by GRACE have little to do with the ice and a lot to do with the underlying land masses.
It will be interesting to see whether the geoid calculated by GOCE changes in time, all over the globe. We have to wait and see.
Please tell me I am wrong and that I have misinterpreted Gates’ remark.
You have. Gates believes (as do I) that the real outcome will be worse than Goddard’s predictions. If/when it is, what’s the likelihood of Goddard doing a full and objective analysis of why he was wrong, and admitting that the AGW proponents may know more than him?
If global sea ice extent and associated albedo is of climatic significance then why don’t JAXA & NSISDC show a combined graph of both hemispheres with the real daily global cryosphere situation
Go on then, what’s the albedo effect of the winter ice in the Southern Hemisphere… which is currently in the dark? The underlined words should be a hint.
. It is the Ozone Hole – which is also the fault of evil, American SUV drivers. That is a nice guilt trip, but sadly the Ozone Hole doesn’t form until August and is gone by December. Strike one.
Steve:
Science shows that the ozone hole is mainly due to CFCs (chloroflouro carbons) that were formerly released from spray cans and as lost refrigerants. An international treaty lead to the banning of CFCs and their replacement by less dangerous products. This is a big success story. The only problem is that the half life of CFCs in the upper atmosphere is on the order of 50 years, so the ozone hole is expected to gradually recover over the next few hundred years. This story is found in many basic textbooks. Never heard scientists claim that CO2 caused the ozone hole.
Ray,
my point is not on the order of the polynomial but on the procedure itself, it’s incorrect and higly dependent on the starting and ending point.
Hypnos says:
June 29, 2010 at 2:14 am
The polar ice caps are in fact melting.
Both the Arctic and Antarctic ice sheets are losing ice at an accelerating rate, as per GRACE data…..
_____________________________________________________________________
Yes, the “Antarctic ice sheets are losing ice at an accelerating rate” as long as you only look at the ice sitting on top of an ACTIVE volcano(es)! There are a lot of links to that information in this WUWT article
Peter Ellis
The peak Antarctic positive anomaly normally occurs during the Antarctic summer.
Hypnos
Greenland and Antarctica are both buried in very thick ice, which makes it nearly impossible to get gravity reference data anywhere other than the coast.
This makes it nearly impossible to interpret gravity data accurately. i.e. they can’t tell the difference between isostasy and changes in ice thickness.
haris
I have been laying out the arguments for my summer estimates over the last few weeks.
However, seeing as how 2006 and 2007 were nearly identical in all aspects on this date, it becomes clear that it is nearly impossible to guarantee an accurate prediction without knowing what winds will be like the rest of the summer.
Nobody knows that, so it is really a crap shoot.
rbateman says:
June 29, 2010 at 1:40 am
Try looking at the data instead
http://weather.unisys.com/surface/sst.html
No, you have to look at the anomalies, looking at your link just shows the water gets colder in general as you go to the poles.
The SST anomalies are same or higher around Antarctica so the large extent is not due to ocean temps being cold due.
Andy
Perhaps it’s worth mentioning that Arctic basin sea ice area dropped from 4 mil to 3.4 mil sq.km within a week, and is currently 0.6 mill sq.km below mean. The shrinkage has started two or three weeks earlier than last year. Wind piling up slabs of multi-year ice?
http://arctic.atmos.uiuc.edu/cryosphere/IMAGES/recent365.anom.region.1.html
Wow! There is hope after all.
http://www.telegraph.co.uk/sport/football/world-cup-2010/7860378/World-Cup-2010-Fifa-president-Sepp-Blatter-apologises-to-FA-over-Frank-Lampard-goal.html
Steve Goddard, maybe this explains the officiating.
Roald
Perhaps it is worth mentioning that the Arctic Basin “drop” you are seeing is due to SSMI sensor errors.
Smokey
Good one.
stevengoddard says:
June 29, 2010 at 4:41 am
Peter Ellis
The peak Antarctic positive anomaly normally occurs during the Antarctic summer.
Except in recent years it occurs during the refreeze whereas the melt curve almost exactly follows the average curve, as does the minimum. The maximum has fluctuated around in the 15-16Mm^2 range over the last 20 years.
http://arctic.atmos.uiuc.edu/cryosphere/IMAGES/seaice.recent.antarctic.png
The winter maximum was reached in late December 2009 but it was obvious to all but a hard core of psuedo-scientists that the bulk of the accretion was rotten. Since then the graph of it’s decline has been precipitous and alarming to those argue for it’s recovery. Many postings have been and will continue to be made to try to “hide the decline” but the tipping point has been reached – the MSM write less and less articles promoting AGW scare stories and even Geoffrey Lean in the Daily Telegraph has turned his attention to real green issues that most posters here could sympathise with.
So please, be good little Trolls, accept the whole theory is totally discredited and run along and play with your vuvuzelas somewhere else.
Gail Combs:
Yes, the “Antarctic ice sheets are losing ice at an accelerating rate” as long as you only look at the ice sitting on top of an ACTIVE volcano(es)! There are a lot of links to that information in this WUWT article
________________________________
The study you linked states very clearly that the volcano is not responsible for the melting:
“This eruption occurred close to Pine Island Glacier on the West Antarctic Ice Sheet. The flow of this glacier towards the coast has speeded up in recent decades and it may be possible that heat from the volcano has caused some of that acceleration. However, it cannot explain the more widespread thinning of West Antarctic glaciers that together are contributing nearly 0.2mm per year to sea-level rise. This wider change most probably has its origin in warming ocean waters.”
Furhtermore, GRACE confirms accelerated loss of mass on the Antarctic East Sheet as well.
So to sum up:
1) The volcano is not a determining factor in the melting of the ice sheet
2) The ice sheet is also melting where no volcanoes have been found
Anna and Steve Goddard:
GRACE is adjusted for glacial isostasy. Validations are performed via comparisons to direct measurements of isostasy, for example in Fennoscandia (at least, this is my non-expert understanding).
http://www-app2.gfz-potsdam.de/pb1/JCG/Timmen-etal_jcg.pdf
However, I have read a bit around and there seems to be some variance between estimates of glacial rebound impact on gravity measurements over Antarctica, so you have a good point.
I’d like to have an expert chime in on this. I haven’t been able to assess how big the glacial rebound effect is on the total mass-change detected by GRACE. That should be relevant.
@Mike:
Here are WUWT threads critiquing Steig’s article, in date order. Asterisked threads are the most important ones:
http://wattsupwiththat.com/2009/01/21/antarctica-warming-an-evolution-of-viewpoint/
http://wattsupwiththat.com/2009/01/22/antarctic-warming-part-2-a-letter-from-a-meteorologist-on-the-ground-in-antarctica/
http://wattsupwiththat.com/2009/02/04/snow-job-in-antarctica-digging-out-the-data-source/
http://wattsupwiththat.com/2009/02/15/redoing-steig-et-al-with-simple-data-regrouping-gives-half-the-warming-result-in-antarctica/
http://wattsupwiththat.com/2009/02/28/steigs-antarctic-heartburn/
http://wattsupwiththat.com/2009/04/12/a-challenge-to-steig-et-al-on-antarctic-warming/
http://wattsupwiththat.com/2009/04/18/what-happens-when-you-divide-antarctica-into-two-distinct-climate-zones/
* http://wattsupwiththat.com/2009/05/20/steig-et-al-antarctica-warming-paper-process-is-finally-replicated-and-dealt-a-blow-to-robustness/
(“A central prerequisite point to this is that Steig flatly refused to provide all of the code needed to fully replicate his work in MatLab and RegEM, and has so far refused requests for it.”
Say, I wonder if the recent statements by scientific societies re the Jones case that such data withholding can’t be justified can be used to shake the code loose from Steig?)
** http://wattsupwiththat.com/2009/05/29/steig-et-al-falsified/
* http://wattsupwiththat.com/2009/06/07/steigs-antarctic-peninsula-pac-mann/
http://wattsupwiththat.com/2009/08/06/the-climate-science-credit-crunch/
http://wattsupwiththat.com/2009/09/04/dmi-arctic-temperature-data-animation-doesnt-support-claims-of-recent-arctic-warming/
http://wattsupwiththat.com/2009/09/20/antarctica-warming-ice-melting-not/
http://wattsupwiththat.com/2009/12/13/frigid-folly-uhi-siting-issues-and-adjustments-in-antarctic-ghcn-data/
AndyW says: June 28, 2010 at 10:24 pm
“I don’t think the Antarctic extent is getting bigger due to colder ocean temps due to no El Nino and end of PDO cycle, if you look at current SST anomaly it is mainly same or higher than average
http://weather.unisys.com/surface/sst_anom.html”
Looking back at some of the historical SST anomalies 2010 appears to be the coldest around Antarctica that its been in the last decade:
http://weather.unisys.com/archive/sst/sst_anom-090628.gif
http://weather.unisys.com/archive/sst/sst_anom-080629.gif
http://weather.unisys.com/archive/sst/sst_anom-070624.gif
http://weather.unisys.com/archive/sst/sst_anom-060625.gif
http://weather.unisys.com/archive/sst/sst_anom-050626.gif
http://weather.unisys.com/archive/sst/sst_anom-040627.gif
http://weather.unisys.com/archive/sst/sst_anom-030629.gif
http://weather.unisys.com/archive/sst/sst_anom-020630.gif
http://weather.unisys.com/archive/sst/sst_anom-010701.gif
http://weather.unisys.com/archive/sst/sst_anom-000611.gif
Do you concur?
Amino Acids in Meteorites says:
June 28, 2010 at 10:56 pm
Your arguments are always shallow. But let’s go with that for a moment anyway: if what you call “skeptics” don’t have a real argument and they are crazy then why do you spend so much time here? It’s because you’re afraid? You must not be convinced of your own arguments.
When my arguments are more complex, “skeptics” like yourself just ignore them and amuse yourself with side issues, like belittling the Nobel Peace Prize, e.g.:
http://wattsupwiththat.com/2010/06/27/the-list-goes-on-%E2%80%A6-and-on/#comment-418332
http://wattsupwiththat.com/2010/06/27/the-list-goes-on-%E2%80%A6-and-on/#comment-418513
When I counter an assertion of yours directly, you ignore that as well:
http://wattsupwiththat.com/2010/06/10/concentration-vs-extent/#comment-407546
I don’t spend much time on this blog – I’m mainly waiting for late September, to see how the summer melt is “spun” here. Now that will be interesting. Get your excuses ready, don’t wait till the last minute.
Andres says:
June 29, 2010 at 12:24 am
Jarmo’s comment needs attention, on NSIDC ice map for 06/27/10 there seems to be ice in Gulf of Finland which is certainly NOT the case. So how can I trust other areas??
I suggest you and Jarmo read the notes for the images just click on ‘Read about the data’.
Hypnos
You can’t correctly adjust for isostasy without bedrock reference points, and there are very few available in the interior of Greenland or Antarctica. The fact that they did some sort of correction does not mean it is accurate.
stevengoddard says:
June 29, 2010 at 5:58 am
Roald
Perhaps it is worth mentioning that the Arctic Basin “drop” you are seeing is due to SSMI sensor errors.
That would be remarkable since the CT data he quotes doesn’t use SSMI!
villabolo says:
June 29, 2010 at 12:26 am
A little knowledge is a dangerous thing. One needs to know the whole background before making a judgment.
And your judgment is the correct judgment?
Anu,
complex?
Anu says:
June 29, 2010 at 6:50 am
Al Gore won the Nobel for his movie. Some may say it was for his book or his speaking engagements. But it was for his movie. Without his movie he would not have won it. His movie is criticized for inaccuracies even by global warming proponents. What does that leave an unbiased person to conclude about the Nobel? I’m not asking what it leads you to conclude.
Curious Yellow says: June 28, 2010 at 11:48 pm
“So now the “normal line” is misleadingly narrow? Just reminding you not to confuse average with normal. Reading across the comments I sense that attention is now being switched to the Antarctic, given that the “recovered” arctic continues to be unwilling to co-operate. Today’s loss of 141,000 KM2 must feel depressing. The reality depresses me, mainly because it seems unstoppable and that’s not good for the planet.”
The “normal” range, i.e. +-2 standard deviations, is misleadingly narrow, because the NSIDC only uses data from 1979 – 2000 to calculate the range:
http://nsidc.org/data/seaice_index/images/daily_images/N_stddev_timeseries.png
If one was to add in the data from 2001 – 2009 the “normal” range would expand, making the current conditions look less anomalous. Furthermore, if we could add in data for earlier decades, centuries or millennia we would likely see that the current sea ice conditions at both poles are well within the “normal” range of variability.
Anu,
I am not a “skeptic”. Something must have a possibility of being real for someone to be skeptical of it.
Just The Facts says:
June 28, 2010 at 9:22 pm
R. Gates says: June 28, 2010 at 8:47 pm
“you may want to check your very opening graph however. It seems you’ve got the Antarctic sea ice topping out each year close to 18 million sq. km. It usually tops out around 15.5 million.”
I assume you are speaking of Antarctic Sea Ice Area:
http://arctic.atmos.uiuc.edu/cryosphere/IMAGES/seaice.area.antarctic.png
whereas Steve posted a chart on Antarctic Sea Ice Extent:
http://www.iup.uni-bremen.de:8084/amsr/ice_ext_s.png
__________________
Yep, I was, and Steve…I apologize for not looking as close as I should have, as I wanted to really move onto the discussion about the Arctic Dipole Anomaly, as this relatively new development with the Arctic winds is probably more important to our N. Hemisphere weather. Be that as it may, I do find the LONGER term upward slope in Antarctic ice interesting in the same way that the longer term downward slope n the Arctic sea ice interesting. These have more connection to potential AGW effects.
The longer term upward slope in the Antarctic anomaly:
http://arctic.atmos.uiuc.edu/cryosphere/IMAGES/seaice.anomaly.antarctic.png
is not nearly so dramatic as the the longer term downward slope in the Arctic anomaly:
http://arctic.atmos.uiuc.edu/cryosphere/IMAGES/seaice.anomaly.arctic.png
And even more important is the fact that the Antarctic has crossed below the normal line into a negative anomaly state several times over the past few years, whereas the Arctic has not crossed the line into a positive anomaly since 2004. This is a significant difference. Also, studies (not related to the ozone layer depletion) have shown how AGW can lead to increases in Antarctic sea ice:
http://psc.apl.washington.edu/zhang/Pubs/Zhang_Antarctic_20-11-2515.pdf
Though I know that AGW skeptics just love to ignore these kinds of AGW related studies to Antarctic sea ice.
It seems that as we see the Arctic sea ice NOT recover, and new weather patterns emerge (the Dipole Anomaly for example) from the changes in the Arctic that could have major consequences for the majority of the worlds population that live in the N. Hemisphere, that the AGW skeptics want to shift focus to other things such as the Antarctic.
Acting on your suggestion, with quotes, none of the links in the first few pages matched my rebuttal – that a scientists says this in the present tense, about both the Arctic and Antarctica. Most of the articles I checked discussed the Antarctic and Greenland – ice sheets, not sea ice.
So I searched google scholar with your suggested parameters. 104 hits, only a handful of which matched the parameters. The IPCC refers to Arctic sea ice as sea ice, and puts Greenland and Antarctica under the heading ‘ice cap’.
You have conflated Antarctic sea ice (slightly increased over 30 years), with the Antarctic ice sheet (slight decrease with heavy caveats).
As in:
There is a logic to diminishing ice sheet and increasing sea ice. If the loss is a result of ablation around the cost, more ice can end up in the sea.
villabolo says:
June 29, 2010 at 12:26 am
the links you give are to a article from a newspaper that quotes from a book writen by a climate alarmist, “The Last Generation: How Nature Will Take Her Revenge for Climate Change”, and wiki article that draws no conclusions based on data but uses the word “perhaps”. This is what I have found over and over from global warming believers.
The video I posted is a scientist that uses geological findings.
So we have a choice, do we believe opinions or data?
i notice that the goalposts are already being moved over to the antarctic….
Steve, any comment on Barrow? as Phil pointed out, the ice broke up the day before you wrote your post. (latest-barrow-ice-breakup-on-record)
http://wattsupwiththat.com/2010/06/26/latest-barrow-ice-breakup-on-record/#comment-419178
there is a picture of global sea ice AREA anomaly. it is negative at the moment.
http://arctic.atmos.uiuc.edu/cryosphere/IMAGES/global.daily.ice.area.withtrend.jpg
the arctic sea ice area anomaly fell dramatically, and is the second lowest anomaly in the record, after 2007.
Steve since as you mention no one knows what the winds are going to be this summer, and given the current slope, 2010 would not cross 2006 or 2007, what do you base your predictions on? Several posters over the last few weeks have shown your PIPS2.0 thickness fields are incorrect. You seem to ignore clear sky conditions that enhance surface melt, You seem to ignore anomalously warm SSTs in the Barents and Kara seas, you seem to ignore that temperatures have been anomalously warm all year, you seem to ignore the dipole pattern, you even seem to ignore visible melt ponds on the ice.
So really, what are you basing your prediction on?
villabolo says: June 29, 2010 at 12:21 am
“As far as your question concerning which pole makes a more accurate proxy of GW the answer is neither of them.”
So we can expect the Warmists to stop touting changes in sea ice as key indicator of Earth’s impending boiling doom?
“Your statement: “I am not concerned with . . . the minor impact that Arctic sea ice changes may have on “the weather of the N. Hemisphere.”” shows a severe lack of understanding of the physical processes involved. Unless you, and any family of yours, live in some well hidden fortress stocked with essential supplies up the ying-yang your statement shows a flippant attitude towards the powerful dynamics of Earth’s climate.”
Funny, because we are the ones who are arguing for the “the powerful dynamics of Earth’s climate”, it’s the Warmists who are arguing that humans have learned how to manipulate and control these dynamics by simply burning some coal and unleashing plethora of cow farts. Note to self, CO2 is not Earth’s thermostat and humans cannot control and adjust Earth’s average temperature at will.
“The issue is not even what you believe as regards AGW but whether you aware of the repercussions that a rapid change in such an important feature of the environment will create. It seems like you equate the mere possibility of weather/climate catastrophe with AGW. If so, I advise that you pay some attention to the Mayans.”
Yes, the last time Arctic Sea Ice likely diminished greatly, during the Medieval Warming Period, was very catastrophic, Vikings thriving is Greenland, longer growing seasons, crops grown in Northern latitudes such as vineyards in the North of England, giant cathedrals built across Europe, etc. Scary stuff…
Steve,
You’ve made a few, rather contradictory claims about forecasting sea ice. First you claim:
“It’s all a crap shoot.”
then you say that the 2010 extent will cross over the 2006 & 2007 lines in the next few days.
Do you mean to say, that if the 2010 trend lines does not match up with your prediction, then it’s all a crap shoot? And of course, those models, such as PIOMAS, that are predicting a near record low for this summer extent will be just lucky if they get it right, but if you get it right, then you knew better, right?
I assume you think that once the Hudson bay is ice free, that the 2010 extent line will stop declining so fast. This would be based on your assumption of your PIPS 2.0 derived “40%” increase in thickness since 2008? On the ice observations from last winter in the Arctic basin:
http://www.agu.org/pubs/crossref/2009/2009GL041434.shtml
Might indicate that your PIPS 2.0 model thickness is about to go POP.
Anu says:
June 29, 2010 at 6:50 am
Anu,
Explain to me why I should care one way or the other what happens to the ice in the Arctic Ocean.
It was much warmer during the Medieval Warm Period. Polar bears, seals, etc. did fine.
I know it was much warmer because the Vikings were raising cattle, sheep, and other foodstuffs, in Greenland. Today’s Greenlanders must import their food.
I must offer ANU a note of caution, we simply do not know what the summer melt will bring and what the minimum will be.
It is unwise for both sides to make confident claims and make statements of certainty before the facts are in, we are entering a period of uncertainty and neither realists nor alarmists dont have a clue yet, in fact we have so little historical data that this next few weeks will be extremely interesting.
Isnt it much better to wait and see because the fact is that by marking out a set position based on beliefs is simply painting yourself into a corner should reality not turn out in the anticipated manner.
By taking a set position now before the facts are known it will mean your future posts will not be listened to, I for one enjoy reading your posts along with R Gates they offer a different perspective and a contrarian angle which I feel is valuable. IF and thats a big IF but if you are wrong and the melt does not meet your hopes then you cannot backtrack and your future posts will be seen through that lens alone.
Isnt it more sensible to admit doubt now and not run the risk of looking foolish later? This blog would be the poorer for your departure even though I may disagree with your positions.
R. Gates
The decline over the last week has been > 80% in the Hudson Bay, which is about to run out of ice, so the slope will break. It is a simple geometry problem.
Usual suspects – please take a chill pill. You all seem to be hyperventilating.
Hypnos says:
June 29, 2010 at 2:14 am
It is good to know that pupils in American schools are being taught the scientific truth.
You are confusing Alarmist propaganda with scientific truth. This is an easy and quite common mistake for climate bedwetters to make, as they don’t seem able to tell the difference, which is sad.
Most people believe that Antarctica is melting, because they have been continuously fed disinformation about it from authorities.
http://www.ktuu.com/Global/story.asp?S=10140922
In response to Cassandra King
June 29, 2010 at 9:51 am:
_______
A good precautionary post. I think it is very interesting for example that Steve was so bold as to say that 2010 will cross the 2006 and 2007 extent lines in the next few days based purely expectations that as we enter the month that sees the most rapid of declines, that we will not see accelerated melt from other regions besides Hudson Bay. We are already seeing signs in the Arctic Basin:
http://arctic.atmos.uiuc.edu/cryosphere/IMAGES/recent365.anom.region.1.html
Of a dramatic melt getting set up for July and August. True, the “winds” may change, but Steve is must be quite confident in his PIPS 2.0 make the claims he has. I’ve cast my lot with PIOMAS and David Barber, and now the true test is upon us.
But a few things about me:
1) I am not a “catastrophic” AGW follower, nor am I an “alarmist”. I do think AGW theory is in general correct, but what that means in terms of actual effects is an entirely different issue which I’ve not really studied enough to know anything about. If effects such as the Arctic Dipole Anomaly can truly be related to AGW as positive feedback effect, then there obviously will be very interesting times ahead for N. Hemisphere weather as the Arctic warms, but even David Barber, who has documented the “rotten” ice in the Arctic this past winter, has noted how some types of changes in the Arctic sea ice are actually better for Polar Bears in terms of their hunting grounds.
2) I will be here after the minimum this fall, and have no problem looking at how and why I was right/wrong with my prediction. This is science for me, not politics or personal ego at stake. I simply want to know what and why, and something can be learned from every bit of data.
Once more I will stress that the ice has been diminishing since the Little Ice Age ended, the temperatures have been rising ever since then, both a hundred years before any appreciable human induced hydrocarbon burning appeared . I do not think anybody doubts this.
Also there should be nobody of some scientific background who could doubt that the true prophecy is that the next ice age will come, and that the ice core data show diminishing temperatures through the Holocene. .
So this bickering on whether this will be a record melt or not has nothing to do with CO2 and the feedback mechanism that is supposed to trigger the catastrophic warming.
So the ice keeps on melting and the temperature rising? We are lucky to be coming out of the Little Ice Age instead of tumbling down the next Little Ice Age on the way to the bottom.
The fact is that the only thing incriminating CO2 for any drastic climate changes are GCMs that are failing on all fronts :
These models have failed to reproduce:
1) the cloud cover. ( see AR4, they are all over the globe wrong)
Considering that a 2 percent change in albedo over compensates for this observed change in temperature since the little ice age, this is an extremely important failure.
2) they fail to reproduce the absolute temperature, that is why they are playing card games with anomalies of temperatures. The failure is larger than the anomalies predicted.
http://rankexploits.com/musings/2009/fact-6a-model-simulations-dont-match-average-surface-temperature-of-the-earth/
The exact same runs that average so nicely on the global anomaly measurements.
3)They predict a tropical hotspot that has not materialized
http://icecap.us/images/uploads/GHGModsvsReality.jpg
4) they predict a rise of sea surface temperatures that have not materialized. Since 2005 the famous CO2 effect cannot change the SSTs, though CO2 is merrily rising still.
http://www.nodc.noaa.gov/OC5/3M_HEAT_CONTENT
5) the sensitivity of the atmosphere to the water content is the opposite of that given by the models and so necessary to the magic feedback with H2O they invoke.
http://www.drroyspencer.com/2010/05/strong-negative-feedback-from-the-latest-ceres-radiation-budget-measurements-over-the-global-oceans/
http://www.drroyspencer.com/Lindzen-and-Choi-GRL-2009.pdf
The models should be back to the drawing board and the use of CO2 as a terror weapon is passee.
Watching the ice is like playing Pooh sticks, and has nothing to do with CO2.
It is true that the surest way to win the skeptic argument would be for the climate to fall into the next Little Ice Age, but wishing for this is like cutting one’s nose to spite one’s face.
R. Gates says: June 29, 2010 at 7:37 am
“And even more important is the fact that the Antarctic has crossed below the normal line into a negative anomaly state several times over the past few years, whereas the Arctic has not crossed the line into a positive anomaly since 2004. This is a significant difference.”
This really isn’t significant, because, as I pointed out above, the Antarctic resets each year by mostly melting away, thus it is more sensitive to annual variations, whereas the Arctic is stuck with the impact and memory of non-temperature related events, such as the Arctic Dipole Anomaly you’d prefer to talk about.
“Also, studies (not related to the ozone layer depletion) have shown how AGW can lead to increases in Antarctic sea ice:
http://psc.apl.washington.edu/zhang/Pubs/Zhang_Antarctic_20-11-2515.pdf
Though I know that AGW skeptics just love to ignore these kinds of AGW related studies to Antarctic sea ice.”
I cited and linked to this study earlier in this thread, hardly what one might consider ignoring. Furthermore, don’t you find it slightly suspicious that Zhang is responsible for both deflating Arctic Sea Ice Volume;
http://psc.apl.washington.edu/ArcticSeaiceVolume/IceVolume.php
while simultaneously trying to minimize the importance and obscure the causes of increasing Antarctic Sea Ice?
“It seems that as we see the Arctic sea ice NOT recover, and new weather patterns emerge (the Dipole Anomaly for example) from the changes in the Arctic that could have major consequences for the majority of the worlds population that live in the N. Hemisphere”
Yes, as I noted above, “the last time Arctic Sea Ice likely diminished greatly, during the Medieval Warming Period, was very catastrophic, Vikings thriving is Greenland, longer growing seasons, crops grown in Northern latitudes such as vineyards in the North of England, giant cathedrals built across Europe, etc. Scary stuff…”
“that the AGW skeptics want to shift focus to other things such as the Antarctic.”
You mean like shifting focus to the more accurate proxy of Earth’s temperature and temperature trend, which currently seems to indicate that Earth is cooling? Guilty as charged…
I watched a recent History Channel program entitled “Who Really Discovered America” and thoroughly enjoyed a segment about the exploits of Zheng He in the 15th century. It highlighted a map copied from the map made by the Zheng He party in the early 1400’s. The map shows open water at the North Pole, not as an anomaly, but as the norm.
Wow I has never seen such poor science represented as truth. Steve, your mother should be ashamed of you for deliberately misleading your readers and your father should be ashamed of you for not mastering science and not understanding what you see. You bring shame upon your family. Shame on you.
You may wish to read a few books on climate science and mayhaps the latest IPCC report, especially the “Physical Basis for Climate Change” section.
The graph showing the complementary growth and decline of Antarctic and Arctic Sea Ice should be pointed to each time the AGWs get pushy on regional Arctic issues. Also, I find it useful to remind my friends who are terrified by the sex poodle’s prognostications about the Arctic Ice, that floating ice upon melting has little change in the sea level (Archimedes principle). Next I point out to them that something like 90% of polar ice is at the South Pole, where it has been getting slightly colder, not warmer, the last few decades. Lastly, I try to explain that the truth of these issues most likely lies somewhere in understanding ocean current oscillations, the activity of the sun, changes in cloud cover, and subtle changes in the Earth’s orbit over the millenia…..plus a heavy dose of chaos.
Those with a religious commitment to the AGW “tenets” are not persuadable by facts or logic. They hate and despise us heretics. They long for an Apocaplypse, any apocalypse, to satisfy their feeling/belief that Man is evil, a disease upon the Earth, and God (Gaia) will punish him. The Warmistas are mostly post-Christian nihilists, who cannot turn for satisfaction to the Book of Revelations for their need to believe that punishment is coming.
But I have friends who have sipped the Koolaid, do not like its taste, and are casting about for real facts and arguments to counter the constant proselytizing from the AGW hysterics. WUWT is a great direction to point these people toward, to find what they need to escape this anti-human insanity.
And I saw this mentioned on History or National Geographic:
http://www.eurekalert.org/pub_releases/2008-06/uoca-gic061808.php
I know I know, it was regional warming only so the current warming is still “unprecedented”! lol
Check out Cryosphere Today,
In the last couple of weeks the ice area in the Arctic basin has started to decrease.
And you can’t argue with facts, there are at this time sheep farms in Greenland, and no Greenland does not import all of its food.
They even grow cabbages and broccolli there.
Jongo Gurmola says:
June 29, 2010 at 11:22 am
Could you please be more specific in your accusations? Broad all-encompassing comments about Steve’s parents do not a good argument make.
Personally, I don’t agree with all the conclusions/statements that Steve makes, but I don’t go making broad claims about shaming his family, etc…
-Scott
Just the Facts said:
“whereas the Arctic is stuck with the impact and memory of non-temperature related events, such as the Arctic Dipole Anomaly you’d prefer to talk about.”
___________
Ummm, have you actually read the research on the Dipole Anomaly? I would imagine that if you had you wouldn’t have made this comment.
You could start here, and simply read the first few sentences:
http://www.arctic.noaa.gov/reportcard/atmosphere.html
“It is apparent that the heating of the ocean in areas of extreme summer sea ice loss is directly impacting surface air temperatures over the Arctic Ocean, where surface air temperature anomalies reached an unprecedented +4°C during October through December 2008. There is evidence that the effect of higher air temperatures in the lower Arctic atmosphere is contributing to changes in the atmospheric circulation in both the Arctic and northern mid-latitudes.”
Really, to call yourself “Just the Facts”, and then to ignore them…seems like you may want to change your name to “Just the (cherry picked) Facts.”
Tracie Potts is a journalist for NBC news. I don’t rate her as an authority on Antarctic ice. I’m not sure she even got the scant information in her very brief article right.
The general view from scientific ‘authorities’ (ie, scientists) is that the antarctic ice cap is is melting – nit precipitously, as yet. Antarctic sea ice, on the other hand, has increased slightly over the last 30 years.
Steve, you’ve gone from no melting of Antarctic ‘sea ice’ (correct), to no-melting Antarctic ice cap (likely incorrect), and now just ‘Antarctica’ (huh?). The original quote is referenced to a hit count from a google search. These conflations are way too woolly to address. If you cannot be more precise, your commentary only has rhetorical value – and rhetoric is what you are attempting to dislodge. Thus, your comments read like counter-propaganda instead of reasoned analysis.
It is agreed by all that Antarctic sea ice has increased slightly over the last 30 years. So, do you take issue with the notion that the Antarctic ice sheet (cap) has likely decreased slightly, as the science suggests? This appears to be your position according to your post.
Jongo Gurmola says:
June 29, 2010 at 11:22 am
Jongo, you forgot /sarc off
Jongo Gurmola,
Since you are privy to the Truth, why don’t you make a prediction.
barry
Nice FUD
OK, continuing for Hypnos,
There is an anomaly for the geoid given by GRACE:
http://earthobservatory.nasa.gov/Features/GRACE/page3.php
It is the difference for the month of August of 2002 from the average of the year for 2001.
So on a scale of tens of meters, (as the GOCE plot of two months shows in the other thread,) anomalies are of the order of mms all over the globe.
It seems very risky to me to assign these anomalies to ice melts, when the underlying continental shelfs may be redistributing on these scales. I know that Africa approaches Europe something like 2cms a year. From wikipedia plate tectonics:
The lateral relative movement of the plates varies, though it is typically 0–100 mm annually.[1]
Tectonic plates are able to move because the Earth’s lithosphere has a higher strength and lower density than the underlying asthenosphere. Their movement is thought to be driven by the motion of hot material in the mantle. Lateral density variations in the mantle result in convection, which is transferred into tectonic plate motion through some combination of drag, downward suction at the subduction zones, and variations in topography and density of the crust that result in differences in gravitational forces. The relative importance of each of these factors is unclear. Bold mine.
Maybe that is why there is only one author for the paper though there must be a multitude of scientists working for GRACE.
Anyone noticed the 2 holdouts have joined & ALL 4 Norsex Indexes are now at Record Low Arctic Ice for this date … along with NSIDC, AMSR-E & PIOMAS. http://arctic-roos.org/observations/satellite-data/sea-ice/ice-area-and-extent-in-arctic
However: Barrow Break-up Day is not considered to include areas opened by the Wind.
The South ? North ? Winds should be Labeled as ‘From Siberia’
In 2007 this:
1. Pushed the Whole Mass towards Greenland. Much curved away into the North Atlantic.
2. The suddenly Open area soaked up Sun & heated to 40 (F) degrees, melting Ice from underneath.
. . . the whole area rolled up like a Carpet towards the Pole
http://www.arctic.noaa.gov/reportcard/figures/Fig5c2_2008.jpg
You should read that Sea Ice Oulook.
Funny stuff when they refer to 2007 in charts where the melting was 5 times the expected.
The Problem is not the AGW predicting a Decline: they want a GRADUAL DECLINE ~ 300 cubic Kilometers a year.
… it has been going below record by that much MORE, every week for 9 weeks until the 18th.
The problem, is the (Natural, if unusual) El Nino Plus the Gradual warming of the last 30 years being TRIPLED by CAP & TRADE.
(.39 Gradual + 1.09 Cap&Trade + 1.1 from the El Nino = 2.5 (C) over normal for the last 6 months http://vortex.nsstc.uah.edu/data/msu/t2lt/uahncdc.lt
The PROBLEM, is, the AGW lobby is TRYING to heat things up so they can make more Trillions in fraud.
Of course the AGW lobby, funded by $100 B Euros /year, want to make it worse !
Well, they’ve suceeded.
I do not think the Ice will last July, save near Greenland.
That means 300 mph Winds in February & we all die.
Unless the Clouds come. Please.
So, Barry tries to achieve clarity using correct definitions and asks Steven to confirm/clarify his statements using those definitions. His request is hardly complex – just to properly distinguish between Antarctic land ice (the “ice cap” or “ice sheet”) and Antarctic sea ice.
And Steven replies “nice FUD”.
For some reason I’m thinking of the psychological phenomena called “projection”.
R. Gates says:
June 29, 2010 at 8:07 am
Might indicate that your PIPS 2.0 model thickness is about to go POP.
_________________________________________________
POP goes the PIPS?
I don’t think anyone has brought this up before.
PIPS X.X is used by the Navy for NAVIGATION purposes only.
Having worked for the USACE and having spent almost my entire professional career dealing with navigation and harbor issues of large ocean going containerships and bulk carriers (Ports of LA/LB, Charleston Harbor, Barbers Point Harbor, and the Panama Canal (ENSO 1997)), I can attest to entrance channel designs, dredging depths, ship drafts, over dredging, anf underkeel clearances.
In the case of submariners, they are also concerned with minimum save underkeel clearances when transiting entrance channels, likewise, when transiting ice congested areas, submariners would be concerned with “overkeel” clearances. In other words, you don’t want to bump your head on the ceiling of ice, EVER.
You want to be absolutely certain that the navigation charts you use guarantee that you don’t hit something, on the bottom, or ON THE TOP.
And that’s all that PIPS X.X does, it gives the submariner absolute certainty that if he keeps his head down, thet’ll never hit the ceiling of ice.
Thus, PIPS X.X overestimates ice thicknesses, as a factor of safety, guaranteeing absolute certainty that your sub won’t be damaged under ANY CONDITIONS.
GFW
Why is it that some people feel the need to constantly drag the conversation off topic ?
R. Gates says: June 29, 2010 at 11:58 am
“Ummm, have you actually read the research on the Dipole Anomaly? I would imagine that if you had you wouldn’t have made this comment.”
No, I did a cursory review to understand how the Arctic Dipole Anomaly impacts sea ice;
http://research.iarc.uaf.edu/amg/acs2.html
http://adsabs.harvard.edu/abs/2008AGUFM.C51A0538W
but haven’t had time to dig any further, as I have two full-time jobs (neither of which is for a fossil fuel company or a cushy Warmist blog seeding gig like you’ve got), think Steve is doing an exceptional job researching the Arctic and prefer to spend my WUWT time on less addressed areas, i.e. currently the Antarctic. Furthermore, the statement I made above stands, the Arctic Dipole Anomaly impacts Arctic Sea Ice via wind, not temperature.
“Really, to call yourself “Just the Facts”, and then to ignore them…seems like you may want to change your name to “Just the (cherry picked) Facts.””
Now that’s amusing, perhaps I’ll use that some day, right after you change your name over to “R. (Warmist Stooge) Gates”… 🙂
Reply: Both sides stop the name calling. ~ ctm
Just The Facts said:
“Furthermore, the statement I made above stands, the Arctic Dipole Anomaly impacts Arctic Sea Ice via wind, not temperature.”
________________
Uh…did you decide to shift gears away from what you said originally, which was:
“…whereas the Arctic is stuck with the impact and memory of non-temperature related events, such as the Arctic Dipole Anomaly…”
You said the DA was a non-temperature RELATED event. You weren’t talking about what causes what. If you’d taken even 2 minutes to actually read the research I provided for you you see that the DA is all about being a temperature related event– and more critically, a potential positive temperature related event, meaing that seems to have been caused by higher temps and then turns around and brings higher temps to the Arctic.
Finally, a Weather 101 fact for you…you can never separate wind from temperature. They go hand in hand like heads and tails on a coin as proxies for or forms of energy.
Funny how the global ‘ coolers ‘ suporters ignore the fact that just 20,000 years ago New York was under a kilometer of ice ! Doing the math ( 100,000 years between glaciantions peak means that half the way we are in the middle of WARMING !! ) , means that right now we are very close to the warming peak , at least another 1,000 years before achiving it …
When the global sea water is going UP fro the last few decades it takes either a moron or some one with a hiden agenda to deny the present global Warming .
See world solutions at RecipeForaNation.vox.com
BBC has the the following article:-
http://news.bbc.co.uk/1/hi/science_and_environment/10450425.stm
“Cryosat-2 focuses on ice target”
“The Cryosat-2 mission is delivering on its promise to make high-precision radar measurements of polar ice.”
HOW TO MEASURE ICE THICKNESS FROM ORBIT
I don’t know enough to evaluate this article, but thought it maybe of interest
Hot of the Press and of great interest to those who love to study the cryosphere. Early calibration data from CryoSat-2 starting to come in…and it is nothing short of stunning. See:
http://news.bbc.co.uk/2/hi/science_and_environment/10450425.stm
Both the PIOMAS and PIP x.x and CICE and countless others are going to have lots to look at when the full data starts to come in later this year. Some models will rise, some will be modified, and some will be left behind. None of us will look at sea ice in the same way, and probably many other things as well because of what CryoSat-2 will show us…
villabolo says:
June 29, 2010 at 12:26 am
A little knowledge is a dangerous thing. One needs to know the whole background before making a judgment.
Amino Acids in Meteorites says:
June 29, 2010 at 7:18 am
And your judgment is the correct judgment?
VILLABOLO RESPONDS:
That’s a rhetorical answer. Concerning the other statements you made on June 29, 2010 at 7:48 am let me state the following:
You did not read the Wikipedia article carefully. The “perhaps” was stated in context of rainfall that came immediately after the Ice Age ended. The article then specifically states that the Sahara dried out right after that specific event. The “greater heat = more rain” explanation was with reference to how the Sahara got wet afterwards.
Furthermore you paint yourself into a corner by implying that this “Heat Pump” explanation, the universally accepted one, is not worthy of attention. How then, in your opinion, did higher temperatures make the Sahara green?
As for the PHYSICIST whose video you posted, he states two things:
A) Higher Carbon Dioxide levels today will increase temperatures and mimic the “Wet Sahara”.
B) Should the situation today be preferred over that of the Holocene? He answers no. Meaning of course that he was recommending the CLIMATE back then.
Please note that he stated that the “heresy” was not necessarily true but that “it won’t harm us to think about it”. Well Amino, when you do think about it the following becomes obvious:
1) Since you’re using “Arguments of Authority”, which are illegitimate in logic, let’s play with that game for now. He is a “PHYSICIST” not a CLIMATOLOGIST. If you’re too prejudiced to acknowledge the importance of getting the right professional, then by all means, go to a Heart Surgeon to perform your brain surgery.
Also you give no credence those you deride as ‘ALARMISTS” and yet you quote a physicist, who is not only well known for being a Skeptic (I will me be more gracious than you and not use the “D” word), but who clearly admits that:
“My objections to the global warming propaganda are not so much over the technical facts, about which I do not know much, but it’s rather against the way those people behave and the kind of intolerance to criticism that a lot of them have.”
http://www.e360.yale.edu/content/feature.msp?id=2151
I don’t know who he means by “those people” and their intolerance since I’ve seen plenty of this on the Skeptic side but one thing is sure.
He says that his “OBJECTIONS TO THE GLOBAL WARMING PROPAGANDA ARE NOT SO MUCH OVER THE TECHNICAL FACTS, ABOUT WHICH I DO NOT KNOW MUCH”. He therefore says, in the same breath, that it is “propaganda” but he’s ignorant of the facts!
How can one rationally assume that something is propaganda if he simultaneously admits that he admits ignorance of it?
2) Some very basic knowledge and sense should allow us to agree on his first assumption as far as CO2 reestablishing a “Wet Sahara” but that is where his sense stops all together.
3) His thinking goes out the window when he starts generalizing the situation in the Sahara and portions of Europe to the whole Globe. I do not even have to be a Geologist to see through the absurdity of that.
4) Throughout past eras the Earth has had a kaleidoscopic changing of ecozones but, with some radical exceptions, not a homogeneous ecology from pole to pole. The exceptions are Snowball Earth and other periods when the Earth was virtually all desert.
SO WHY DOES HE AND YOU ASSUME THAT THE CONDITIONS THAT CAUSE A “WET SAHARA” IS GOING TO BE GOOD FOR THE WHOLE EARTH? IT IS INTUITIVELY OBVIOUS THAT DESERTS WILL SIMPLY BE SHIFTED IN POSITION. WHAT IS NICE AND WARM FOR ONE AREA WILL BE DAMNABLY HOT FOR ANOTHER.
In fact this was the case with the immediate vicinity of the “Wet Sahara” where the region to its south became desert. That region, until recently, was productive farmland but it is being encroached on by the Sahara which is expanding south and also north to the southern fringes of Spain.
When taken together with the greening this expansion is a clear indication that the desert area of the Sahara, is, not so much disappearing, but simply shifting to other locations.
5) I stated in conclusion of the post you quoted “As to making a comparison with today’s situation, a continuing increase in CO2 will nullify any effect a previous amount would have had. It is simply not wise to argue by analogy.”
Since you have given credence to that Freeman Dyson’s assumption that CO2 is obviously a full fledged Greenhouse Gas (otherwise why quote him at all?)* why do you not factor in what CONTINUOUS INCREASE IN CO2 WILL DO? Just because he assumes that a certain level of CO2 is good for the greening of the whole Earth that does not mean that further increases in CO2 will have no further impacts which could then be negative.
Do you really think that the Universe is set up in such a way that by adding an indefinitely increasing amount of ANY element or substance to a situation it will improve things INDEFINITELY?
6) In conclusion, we cannot make simple minded predictions for Earth based on one dimensional thinking.
Furthermore, it is in a normal Interglacial that Civilization came to be and altering the climate within a span of several decades is going to do, at best, a changing of ecozones, with all the mass migrations and starvation that implies. At worse it will cause a radical shrinkage of the inhabitable Earth.
SO WHY IN HADES DO YOU WANT TO SCREW AROUND WITH THE CLIMATE WHEN YOU HAVE NEITHER FIGURED THINGS OR ARE NOT EVEN IN CONTROL? HAVEN’T YOU HEARD OF THE SAYING “IF IT AIN’T BROKE WHY FIX IT”?
__________________________________________________________
*By the way I thought that you did not believe that CO2 was a contributor to any warming whatsoever? Nevertheless you are using the argument of a Geologist who assumes that it is.
R. Gates says: June 29, 2010 at 2:45 pm
“You said the DA was a non-temperature RELATED event. You weren’t talking about what causes what. If you’d taken even 2 minutes to actually read the research I provided for you you see that the DA is all about being a temperature related event– and more critically, a potential positive temperature related event, meaing that seems to have been caused by higher temps and then turns around and brings higher temps to the Arctic.”
Into weeds with you. I am not going to argue what you know I meant and what you want to construe it as. How about an answer to the question you dodged above, which of Earth’s poles’ sea ice offers a more accurate proxy of Earth’s temperature and temperature trend, and why?
sod says:
June 29, 2010 at 7:49 am
“i notice that the goalposts are already being moved over to the antarctic….”
VLLABOLO SAYS:
You seem to be right but even before then they seemed to be moving in the direction of “Ice Free Arctic is Common and Harmless”.
Jack Simmons says:
June 29, 2010 at 9:05 am
There are also maps of the northern coastline of Greenland from the time of the Vikings. That coastline is now covered with ice. There had to of been less ice in the Arctic in the time of the Vikings.
stevengoddard says:
June 29, 2010 at 10:19 am
Usual suspects – please take a chill pill. You all seem to be hyperventilating.
LOL, it’s true.
Interglcial John says:
June 29, 2010 at 11:09 am
I watched a recent History Channel program entitled “Who Really Discovered America” and thoroughly enjoyed a segment about the exploits of Zheng He in the 15th century. It highlighted a map copied from the map made by the Zheng He party in the early 1400′s. The map shows open water at the North Pole, not as an anomaly, but as the norm.
…………………………………………………………………………………………………………………
Do you recall the title of the program?
I saw a program on History that was about how far the Vikings could have traveled into what is now the US. They think they got as far as what is now Manhattan. They also talked about a skirmish in Canada near the Atlantic in which Lief Erikson’s brother was killed by, what they called, a Canadian Indian. They showed a drawing of those Indians. They looked just like people dressed in clothing of the Ming Dynasty. So Lief Erikson’s brother may have been killed by a Ming Dynasty soldier.
I wish I could remember the title of the show!
R. Gates says:
June 29, 2010 at 3:28 pm
Hot of the Press and of great interest to those who love to study the cryosphere.
And I’ve noticed you’re quite the student of that.
sarcoff
villabolo:
June 29, 2010 at 3:36 pm
you’re really sloppy. you’re just flinging stuff anywhere.
R. Gates says:
June 29, 2010 at 3:28 pm
Hot of the Press
Oh, thanks for being the first, err, second to tell us.
villabolo says:
June 29, 2010 at 3:36 pm
And your judgment is the correct judgment?
VILLABOLO RESPONDS:
That’s a rhetorical answer
Of course, because you’re always correct. And we didn’t think so all we have to do is ask you and you’ll tell us so.
Pamela Gray, please use “forecast” not “prediction”.
Unless you’re using a crystal ball.
villabolo, all I can say is “damn”!
Short version: The climate is Dynamic (active and changing)
stevengoddard at June 29, 2010 at 5:58 am,
How do you know that it is due to sensor errors? Did someone publish something about this or make a statement?
And I am still curious regarding your area figures for the Arctic basin. Your graphs from a few posts back seem to show that there has been a 15 per cent decline in artic basin ice area between this time last year and this time today. You did not publish these ice area figures – I just worked them out using the formula you gave of volume = area * thickness. Is this 15 per cent decline figure correct, or have I made another error?
Amino Acids in Meteorites says:
June 29, 2010 at 4:11 pm
“Of course, because you’re always correct. And we didn’t think so all we have to do is ask you and you’ll tell us so.”
VILLABOLO SAYS:
It would be nice if you responded to the issues I brought up.
Please remember, it was you who brought up Dysons video. I loved Dyson back in the 1980’s when I loved what he had to say on space colonization, something that I was very much into at that time.
Nevertheless, you brought up someone who himself admitted that he did not know much about Global Warming. It only took a quick Google to find that quote.
Steve says … “off-topic”.
I thought the Topic was Sea Ice.
Phil: … I stand Corected: the Barrow site Steve uses still predicts July 6 Ice Break-up but the Webcam shows NO Ice & the Radar ONLY a patch of Landfast Ice 1000 yards by 50 (Range about 10km). Rain, & Warm water pushing the Ice Edge North, is making “Break-Up” Day moot. At http://seaice.alaska.edu/gi/observatories/barrow_breakup … Click RADAR or WEBCAM to the Left: There are Clear skies & NO ICE VISIBLE on the Webcam a couple hours ago (the photo below the CLOUD Chart on the main page is not a current photo),
>>> But the Most Fun was tracking down the source of Steve’s MASS-BALANCE Charts that “show” thickness still hasn’t changed:
http://seaice.alaska.edu/gi/observatories/barrow_sealevel
[exerpt] : ” Barrow Sea Ice Mass Balance Site 2010
The Mass Balance Probe was recovered from the ice and is not operational anymore since 14 June 2010.
Snow depth data are incorrect since a bear tampered with the instruments on 5 June, 2010. ”
… imagine: ‘ Mommy, Bear ate our Data’ … Don’t Worry: Steve can put it to use … as Proof the Ice has stopped melting & We’ll SAVE THE WORLD by pretending that it has. If we all Pretend together that makes it True, right ?
… OK, in REALITY, if _I_ didn’t see that for weeks, so: Steve missed it _Unintentionally_ .
But that is not the ONLY fun thing.
Zhang is co-author of the Evil PIOMAS Model, dripping with EVIL at every pore.
Continue to the page bottom:
” This is a summary of recent weather observations at the Barrow airport (courtesy ) and a weather forecast for Barrow based on a regional weather forecast model (courtesy Zhang and Krieger , ARSC). Note that weather forecasts are unreliable beyond approx. 3 days (cf. dispersion in GFS ensemble forecasts due to uncertain initial conditions. ”
The “ensemble” is Zhang’s GROUP, most of them here : http://www.arcus.org/files/search/sea-ice-outlook/2010/06/images/summary/sioresultschartfig1rev.jpg — that’s me, the 1.0 party-crasher. But the “ensemble” predicted a 1% chance of beating 2007, something happenning on ALL major indexes ! But that’s Science. I picked the El Nino strength 1.8 to 2007’s 1.1, as my Theory. They are not bad, it’s just that the Weather followed my theory. And it can CHANGE, too — something the Weather is FAMOUS for doing.
More !
Not only does Zhang do the Barrow Forecast, but he Updated Pips too !
. http://www.oc.nps.edu/~pips3/stand_alone_ice.html
” ice rheology of Hibler (1979) with more efficient numerics of Zhang and Hibler (1997)”
and here is why: his wife is NAVY ! & worked with Pips’s current supervisor Wieslaw Maslowski in 2000: http://www.arsc.edu/support/news/T3Enews/T3Enews200.shtml “We are at the Department of Oceanography of the Naval Postgraduate School in Monterey California.” > Home page URL? http://www.oc.nps.navy.mil … The best Discussion of Pips is in the American J. of Meteorology:: http://journals.ametsoc.org/doi/full/10.1175/1520-0426%282004%29021%3C0944%3AFVOTPI%3E2.0.CO%3B2 … note especially the 3rd paragraph of #2.
.
Ahhhh, but Obi Wan: maybe that was Before he turned to the Dark Side ?
BUT Enough Fun: THIS IS _IMPORTANT_:: Ocean Warming REVERSING ??
Steve hit the Nail on the head here.
— We need updates of Dr Roy’s Ocean Temp Chart cf to the Average (at drroyspencer.com), which is PLUNGING.
That … is REAL.
Proving IF we survive this year, we’ll find we are REALLY in the cold half of the 30-year cycle (the present El Nino is just the Weather being its usual wacky self).
… But we need updates … most sites give a Map that show only … that Temps get colder to the North.
We need the DIFFERENCE from norm = “Anomaly”:
http://bulletin.mercator-ocean.fr/html/produits/bestproduct/welcome_en.jsp
Hint: pick the button, below right, saying “Deviation from seasonal norm” .
Not a Chart, though, only a MAP — so I have to make memory serve me — but hasn’t the former North Atlantic Hot Spot become the “Slightly Warmer” spot ?
And Mercator does a Pip-like Thickness:
http://bulletin.mercator-ocean.fr/html/produits/psy3v2/ocean/regions/bull_ocean_arc_en.jsp?nom=psy3v2_20100623_22088#ici
Watch out for the trademark of Pips-type Thickness — look at the Arctic: where the Photo Satellites show those 3 big Open water patches, Mercator shows Blue = BELOW normal. As I warned you: on the simpler sites Open Water shows up as MORE Ice. Pips itself manually cuts Open Water areas off, but compare 2009 to 2010 — WOW — Open Water is Eating the Arctic
Pips shows the Open spots quickest, if you have Dial-up like Me:
http://www7320.nrlssc.navy.mil/pips2/archive/retrievepic.html?filetype=Thickness&year=2009&month=6&day=29
… for 2009 … for 2010, just change the 2009 in the url above. Scary.
David Gould
Satellite photos show that there isn’t any missing ice in the Arctic Basin.
villabolo
June 29, 2010 at 5:12 pm
You also believe in the Hockey Stick?
villabolo
June 29, 2010 at 5:12 pm
I think we are on different wave lengths or something here. Maybe you can exchange comments with someone else. There may be others who will relate to you more.
Freeman Dyson on global warming (a topic I’ve just been told he knows little about, because a quick Google said so)
stevengoddard,
On the cryosphere today map, their definition of the Arctic Basin does seem to include areas that are empty of ice – I am looking at the region between the two islands (one is likely Spitzbergen, but I am not completely sure, to be honest). There also appears to be some open water to the north of the Canadian Archipelago. This is right on the edge of the Arctic Basin/Beaufort Sea areas, but some of that open water looks as though it protudes into the region defined by cryosphere today as the Arctic Basin. (This is using the map on the main page for 26 June). I may be reading it wrong, however.
What about my other questions re your arctic basin ice area calculations? Am I wrong? If so, how/where? Again, these are genuine questions.
villabolo
He actually says no ones knows much about it.
There also looks to be some open water to the side of the Nares Strait – a very thin strip up against the Canadian Archipelago. This was also in Modis imagery I saw yesterday. This may close due to winds, but it looks like open water at the moment.
And, indeed, there appears to be open water in the Arctic Basin next to the Kara Sea. Again, it is tricky to tell for sure with some of these, as the orientations of the maps are different. But using the islands as reference points seems to work. (However, I should also note that my spatial sense is not the best …)
Thanks to Just The Facts for the explanation on what PIPS means.
Wattsupwiththat (WUWT) is writing the book on how to defeat Big Media, Big Academia & Big Bureaucracy, their lies, falsehoods and their DELIBERATE ignorance of the INCONVENIENT TRUTHS that prove them wrong. Your work is really impressive. I wish so much that a place like WUWT existed for macroeconomics “science” since macroeconomics is among the worst pseudosciences that exist. It is obvious that you scientists have rigour and are trained in the scientific method.
But economists have a really appalling lack of rigour and do horrifying damage with their pseudoscience, it is not surprising that Jeffrey Sachs, a very well known economist, wrote “one of the slimiest post ever” against WUWT, the superb blog that is destroying Academia, Media & Bureucracy world of falsehood and lack of logic.
Macroeconomics is one of the most corrupt of the pseudosciences, it would be so great that honest macroeconomists visited more often places like WUWT to LEARN how you actually do science.
Cheers, keep the superb work going.
middle of September is coming soon, we will see that there is no alarming thinning
Amino Acids in Meteorites,
Again, I say that it is not coming soon enough. 😉
Steve says: … there isn’t any missing ice in the Arctic Basin.
There’s no Open Water in the Arctic ???
Just look at PIPS 2.0.
The Navy wouldn’t Lie.
You said.
2009: http://www7320.nrlssc.navy.mil/pips2/archive/retrievepic.html?filetype=Thickness&year=2009&month=6&day=29
2010: http://www7320.nrlssc.navy.mil/pips2/archive/retrievepic.html?filetype=Thickness&year=2010&month=6&day=29
It must be the Internet Moths. They’ve eaten holes in the website pic. Off West Canada. And Central Siberia (the New Siberian Islands). Off the Bering Strait too, but that was large in both years
…just like 2007:
http://www7320.nrlssc.navy.mil/pips2/archive/retrievepic.html?filetype=Thickness&year=2007&month=6&day=29
… And how about the AMSR-E at http://www.ijis.iarc.uaf.edu/cgi-bin/seaice-monitor.cgi (another site you can pick days out of the past).
>>> It’s warm, admit it.
In the ARCTIC.
You’re Right, the Antarctic is gaining Ice.
And I, for one, Hope the rapid-reversal of Global Sea Temps continues
http://www.drroyspencer.com/wp-content/uploads/AMSRE-SST-Global-and-Nino34-thru-June-17-2010.gif
And Of course, you ARE right about the Ice: it’s not missing. It never left. It’s still there.
It’s Water now.
This shows a picture of a sub in open water at the North Pole. Why are we investing so much in the Arctic ice melt? Worse yet why do I look at it enery day? It’s like watching paint dry!!
http://wattsupwiththat.com/2009/04/26/ice-at-the-north-pole-in-1958-not-so-thick/
Amino Acids in Meteorites says:
June 29, 2010 at 5:47 pm
villabolo
June 29, 2010 at 5:12 pm
I think we are on different wave lengths or something here. Maybe you can exchange comments with someone else. There may be others who will relate to you more.
**********************************************************************
Amino Acids in Meteorites says:
June 29, 2010 at 5:54 pm
Freeman Dyson on global warming (a topic I’ve just been told he knows little about, because a quick Google said so)
**********************************************************************
June 29, 2010 at 6:02 pm
villabolo
He actually says no ones knows much about it.
**********************************************************************
VILLABOLO RESPONDS:
Amino Acids, did you actually READ my post at 3:33 PM, June 29? I clearly quoted and cited what he said in a magazine interview. I assumed that you read my link.
http://wattsupwiththat.com/2010/06/28/sea-ice-news-11/#comment-419828
Here, once more, is the portion I quoted from Environment 360; June 09, 2009 with the link (the quote is at the end of Dyson’s first exchange with 360, right under the audio link) :
http://www.e360.yale.edu/content/feature.msp?id=2151
“My objections to the global warming propaganda are not so much over the technical facts, about which I do not know much, but it’s rather against the way those people behave and the kind of intolerance to criticism that a lot of them have.”
David Gould says:
June 29, 2010 at 6:04 pm
There also looks to be some open water to the side of the Nares Strait – a very thin strip up against the Canadian Archipelago. This was also in Modis imagery I saw yesterday. This may close due to winds, but it looks like open water at the moment.
The Nares strait is very interesting, in most years it is blocked off by ice until late in the summer, when some ice floes (the thickest ice in the Arctic) leak out into the Baffin Sea where it later melts. One of the unusual factors of summer 2007 was that the Nares strait opened very early and much more ice escaped. The same thing happened this year and ice has been flowing out all spring. If you look at the strait on Modis at the 250m scale you’ll see that it’s filled with small floes passing through.
Here for example, about halfway down, choose 250m from the side and scan down.
http://rapidfire.sci.gsfc.nasa.gov/realtime/single.php?T101802240
Notice also outside the entrance to the strait all the breaks in the ice that Steve says aren’t there, he really needs to use the zoom button more.
Am