By Steve Goddard

JAXA shows the area immediately west of Barrow, Alaska as ice free. And it appears to be melting away from the shore.
The animation below shows the month of May so far.
This apparent melt surprised me, because the University of Alaska reports sea ice at Barrow 4-1/2 feet thick and topped by another foot of snow. The ice has thickened six inches during the past month and about 18 inches since the start of the year.


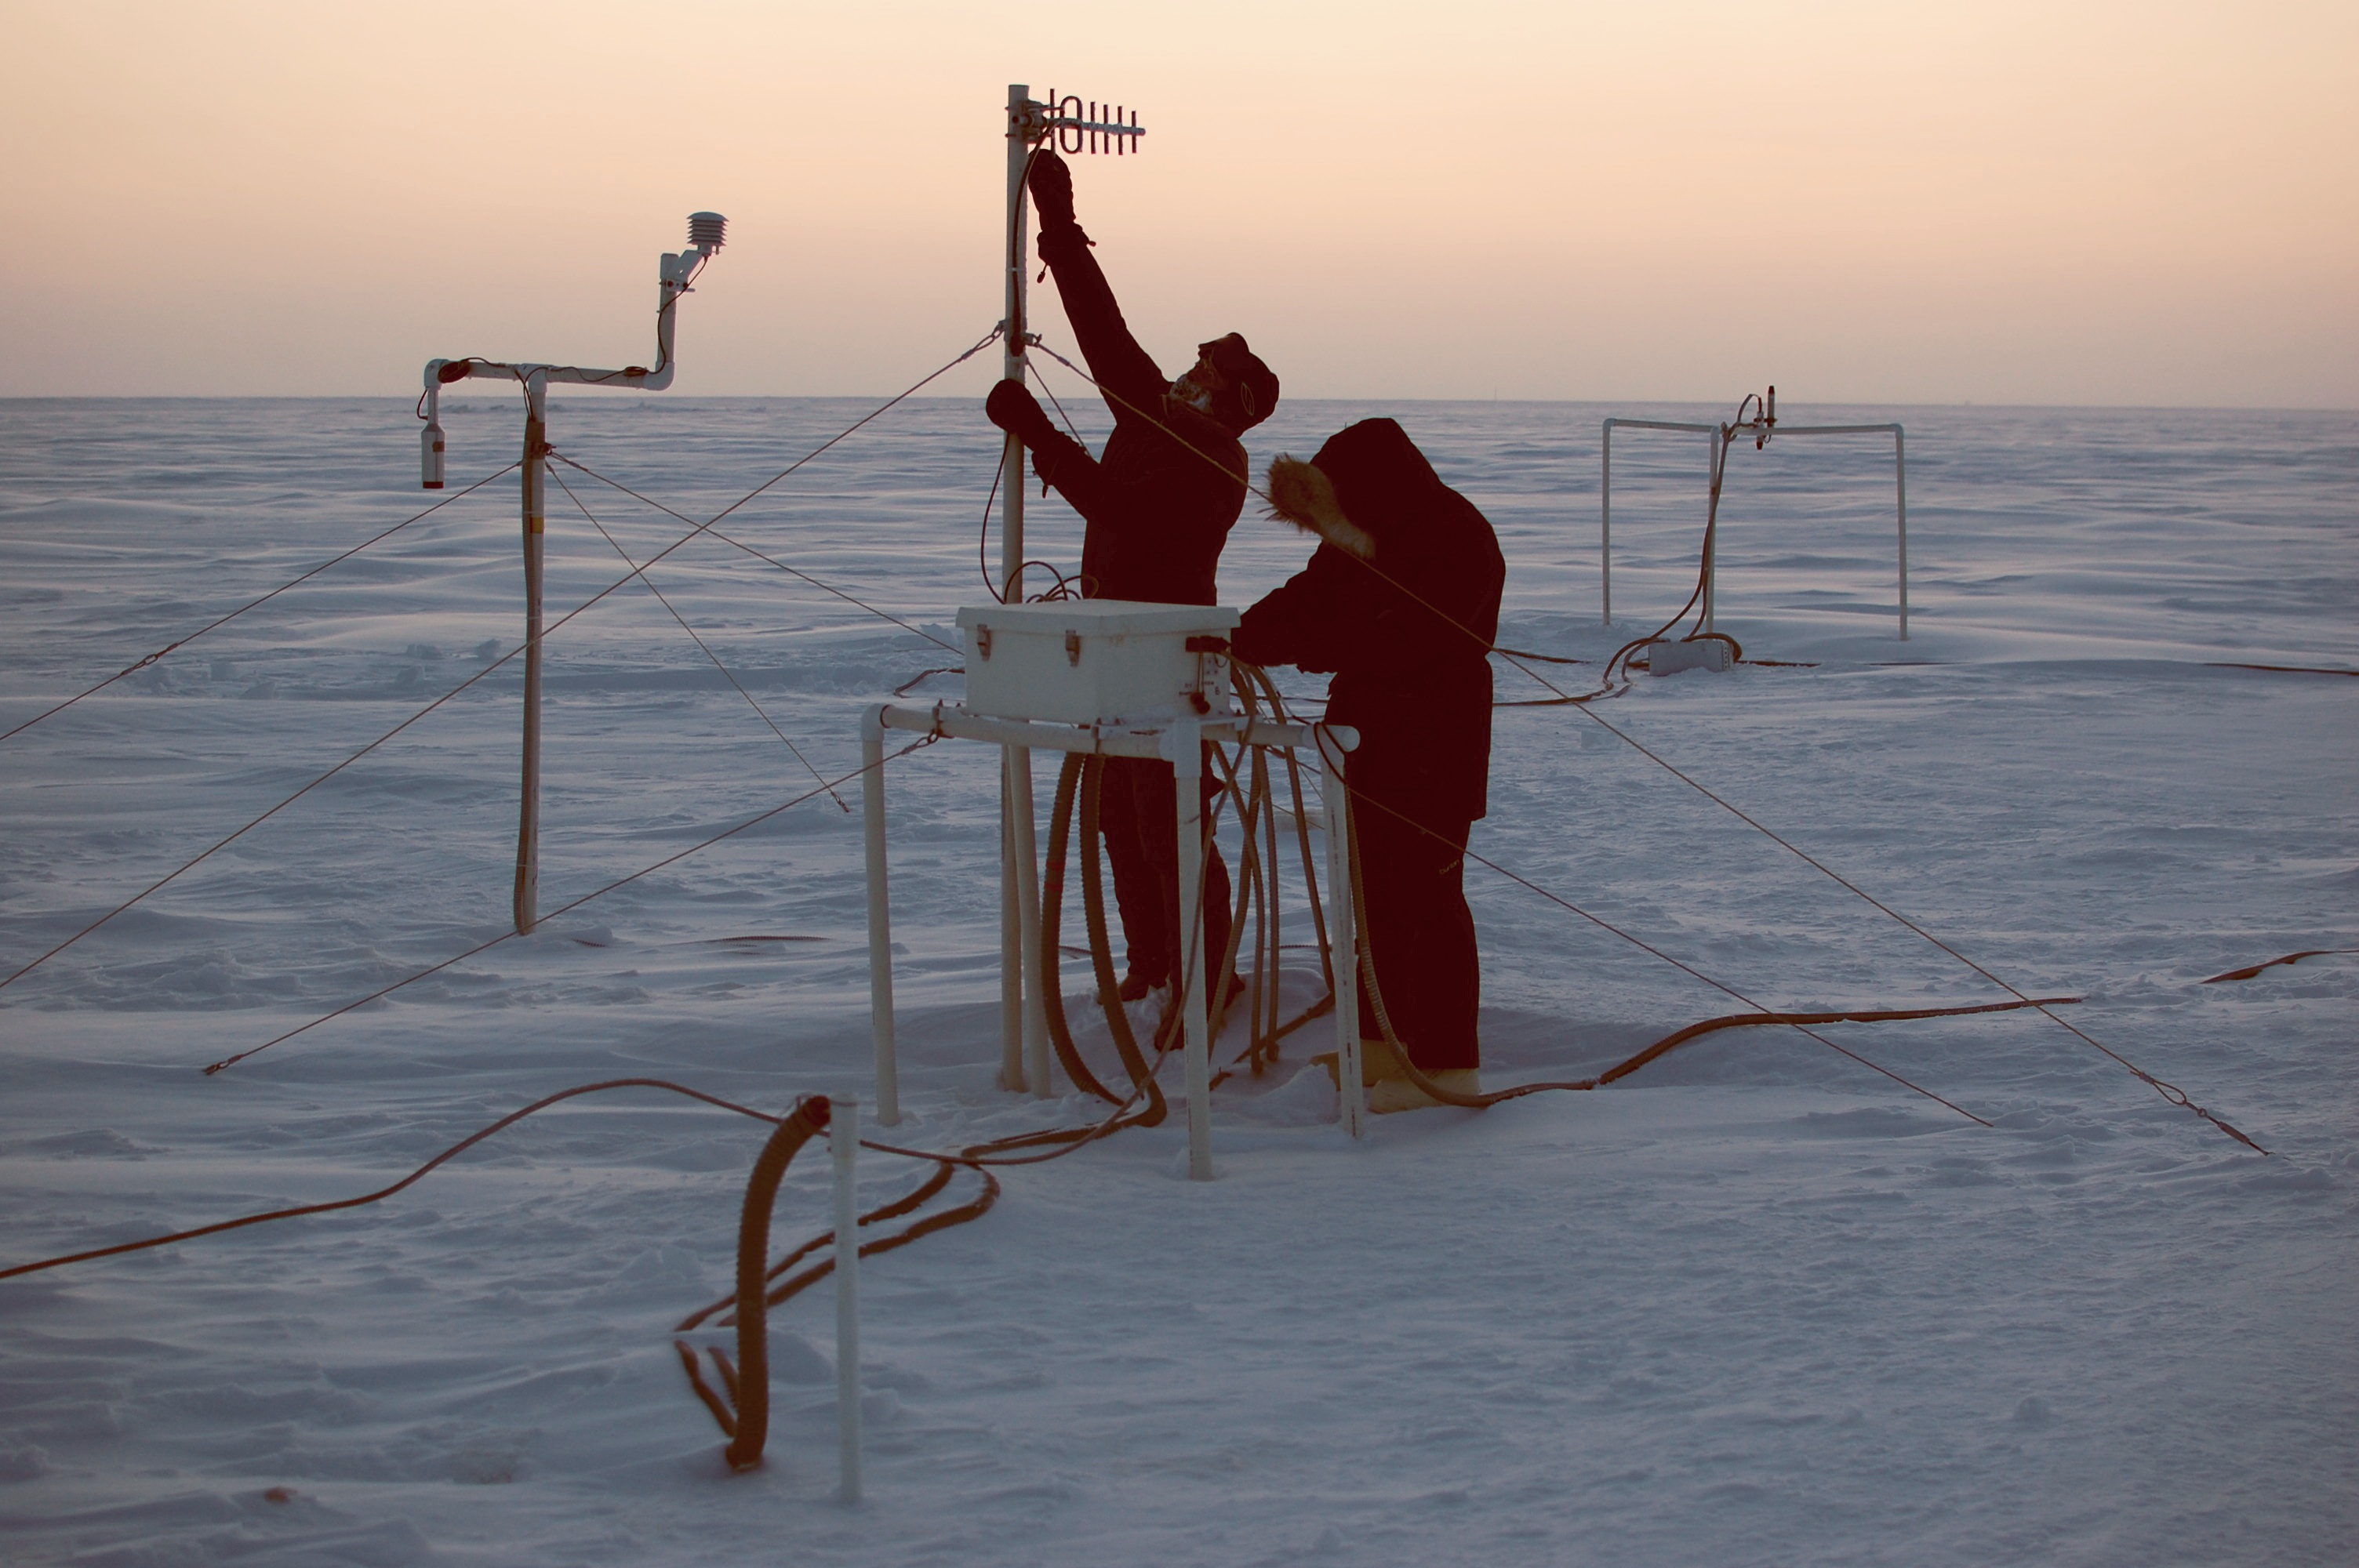
The sensor is located immediately offshore of Barrow, as seen below.

Below is the current view of the ice from Barrow.

We have an apparent paradox. The ice has been steadily thickening all year, yet a big hole has appeared in the ice near Barrow. The hole can be easily seen in the enhanced NASA satellite image below.

What could be causing the hole? The edges of the ice are clean and it has been too cold all month to melt, so something else must be going on.
The video below of the entire Arctic makes it clear. There has been a clockwise circulation which is shearing the ice away from the land in at least four locations (outlined by blue squares.)
We have found the recent decline in the JAXA extent graph, and it isn’t primarily due to melt.

From Billy Liar on May 27, 2010 at 11:59 am:
Current and former metalworkers may talk about shear nonsense, as they are best able to gauge it. 😉
As noted, the daily high at Barrow and Prudhoe Bay as reported on the evening news just broke freezing. It hit a high of 38F yesterday. Normal winter temps run around -35F, so this winter arctic warming does not mean much.
Isn’t it obvious? Some one pulled the plug from the Arctic Ocean floor. The water is swirling clockwise as it drains. This pulls the surface ice along creating the shear. There’s only one thing that needs to be done: Plug the damn hole!
Dave Wendt says: May 27, 2010 at 12:37 pm
Tamara says:May 27, 2010 at 9:16 am
The Beaufort Gyre is not a fixed phenomenon (anymore than any other aspect of the climate). See this site: http://www.whoi.edu/beaufortgyre/results_fwcdecadal.html
It appears the Gyre was stable from the 50′s through the 80′s, then shifted in the 90′s. Could this be yet another 30 year oscillation?
At any rate, I think it is safe to assume that the shearing effect of the BG could vary from year to year, and is at least as likely to be contributing to the current conformation of sea ice as is CO2.
I have suspected for some time now that the primary driver of the decline in Arctic sea ice was the dramatic shift in the BG and the Transpolar Drift which occurred in 1989.
Interesting that what you propose also agrees with the snowmelt in the northern hemisphere: (which I posted earlier rebutting R. Goates on http://wattsupwiththat.com/2010/05/25/the-western-snowpack-is-137-of-normal/ )
The discovery of a sharp decline in late winter and early spring snow
cover starting in the 1980s until 1990 was revealed after researchers
made overdue adjustments to decades of daily snow cover maps.
After the fine tuning the maps, New Jersey State Climatologist and
Rutgers University professor David Robinson found a 1990 decline in spring
snow extent that we still see today.
“It has remained lower over the past 20 years compared to the previous 20 years in
North America and Eurasia,” he said.
http://climate.rutgers.edu/snowcover/chart_anom.php
?ui_set=0&ui_region=nhland&ui_month=4
Comments
1. There should be evidence of folding or buckling or of one sheet overriding another in areas where the rotation has caused compression. It would be interesting to look for that.
2. Such a shear process should decrease ice extent but have a much lesser impact on ice volume since the ice is simply moving and not melting. I seem to recall some story being told a week or tow ago about ice extent being unimportant and ice volume being the only thing that matters.
3. At some point, maybe this year – maybe in a few year’s time, we will have another big melt. The world DID warm slightly over the last decade or two of the 20th century. We should expect to see more frequent big melt events as a result. Big melt events do not validate AGW just as their lack does not invalidate it. I see an unfortunate tendency for people of all persuasions to get sucked into thinking that it is all about the extent – volume – whatever – of arctic ice.
R. Gates
“Now I can begin to see what your repsonse and other AGW skeptics may be…”
We skeptics aren’t a monolith like the “consensus”. Heck, we take each other to task regularly. FWIW, I too, find Steve’s post this time a thin bit of unconvincing rationalization on ice decline – a bit like the NSIDC’s, 2nd lowest, then 3rd lowest and then 4th lowest minimum with the rebound when common sense tells us that if it is in recovery, then it is most likely to go through a staged increase. In any case, as a geologist, I can’t get too excited by changes in a handful of years one way or the other.
The founding of “nouveau” climate science started off on the wrong foot 30 years ago or so when astronomers and physicists began examining the short instrumental record of temperatures (not even a fraction of a second in a long geological record) and used these to arrive at uprecedented this and robust that. When paleoclimatologists (geologists) started coming out of the woodwork to teach them that there is indeed a venerable record of climate change going back 4B yrs or so and what we have now is in the middle of the spectrum of change, then, and only then, did the problems start. Having gone beyond the point of no return on their entrenched positions and the hyperbole to describe these alarming events (and the considerable arrogance that seems to be in the field of physics and astronomy), they spent the next couple of decades actually rediscovering the various warming and cooling periods and devising methods of “neutralizing” these inconvenient swings in climate so as not to have to go back on their dire assessment of an unprecedented and out-of-control warming. As they ran aground on many of these issues (still trying to get things hotter than the 1930s, pictures of subs surfaced at the north pole in March 1950, drying Lake Mead filled back up with water, snow in Johannesburg, Buenos Aires, Melbourne, the Emirates, Jerusalem, etc), they were forced to give up or change horses and switch the concerns to “climate change” and we got all this “cold and ice is because of warming” and worst winter in 50 years or more with new cold records in UK and much of Europe. Even the Copenhagen Summit got deservedly snowed on and ravaged with “unseasonable” cold. The desperate machinations and conspiracies with data and black-balling of sceptics from publishing and the like then came to light in the Climategate affair which showed the world that peer review was rigged, the non peer-reviewed propaganda from WWF, Greenpeace, Koffie Annan and other socialist and anti-American entities and individuals made up significant portions of IPCC reports. This is where we are now in the Climate ‘Debate’. Actually most scientific sceptics hold the position that the climate has been warming a degree or two as it rises out of the Little Ice Age – the ad hominem assaults, the insulting flat earther labels and the references to Nazi era horrors (“deniers, death trains, and the like) in putting down sceptics is in itself enough to discredit the entire “consensus” and it is no surprise that many scientists in the fold began to back away from it and the public began to melt away along with this. You get the general idea.
Phil,
So you are suggesting that the ice is simultaneously thickening and melting? Good call.
stevengoddard says:
May 27, 2010 at 11:45 am
Anu
If you believe undersea currents are melting the ice, then you should also believe that cold temperatures in the north Pacific hints at a significant recovery this summer.
If I believed the 53 mile wide Bering Strait (with an average depth of 30 to 50 meters) was as important to Arctic warm water transport as the 770 mile wide (ocean part, not including Iceland), deep (800m and 600m channels), Greenland Scotland Ridge,
then yes,
I might believe in a “significant recovery” this summer.
But record melt rates this Spring hint at a different outcome:
http://www.ijis.iarc.uaf.edu/en/home/seaice_extent.htm
The warm Atlantic is the dominant oceanic influence on the Arctic.
Anu,
The unusual “melt” in 2007 was on the Pacific side, in the Chukchi and east Siberian seas.
The 3,000,000 or so sq. km of ice extent lost in the Arctic since the yearly high on March 30 didn’t all vanish by shearing nor by melt, or being washed out of the Fram Strait by the currents…it was a little bit of each of them. What they all have in common is that they involve energy. Here in Denver and along the front range, the quickest way to melt snow is rarely by air temperature being raised, but by wind. The Chinook winds come in and ‘eat’ the snow, (Chinook means snow eater). But wind is another form of energy, and can be considered as a “macro-temperature” as it is the macro-motion or kinetic energy of large masses of air, as opposed the molecular level kinetic energy. Both wind and air temperatures are primarily driven on this planet by solar insolation, and so they are both expressing the same source in different ways.
So, AGW is an issue of energy imbalance. Those who believe it is happening would say more net energy is entering earth’s systems than leaving. How might that energy show up? And where the heck is it? This causes scientists like Kevin Trenberth and John Fasullo no small amount of toil “looking” for it, as we all know. Wind and ocean currents are another form of energy, and if they cause ice to go away, along with higher water and air temps, then in a system that is experiencing an overall energy imbalance, does it matter what clears the arctic of ice…or what combination it is since ultimately it energy all the same, right?
\
Obviously created by
those giant Russian
nuclear tourist icebreakers
making their first excursions.
http://www.sailwx.info/shiptrack/shiplocations.phtml
You will have to look
for them.
R. Gates says:
May 27, 2010 at 2:46 pm
In other words what you are saying is CO2 is the Kevin Bacon of the climate system. Throw in six degrees for any weather or climate issue and you get back to CO2. Thanks for clearing that up.
R. Gates
Arctic sea ice extent has declined almost as low as 2006, which had the second largest summer extent in the JAXA record. Scary ….
I’m trying to put this all together.
The ice in the Arctic Basin is rotating (clockwise)
It’s pulling away from land in at least 4 areas, opening big holes
This shear away from the coast is causing the decline in ice area
The ice is not melting
OK. So that’s a lot of ice – where is all this ice? I’ve been puzzling over the satellite photos http://ice-map.appspot.com/ trying to find where it went… I see lots of cracks where the ice is pulling apart.
Ok, I will wade in.
1.) The chart from Barrow shows the ice they are measuring is still increasing and is now at 4.5 feet. with even more insulating snow on top of it.
2.) The air temperature has increased to a whooping 30F (still below freezing)
3.) There is a hole forming offshore relatively near where these measurements are being taking.
We are told the Ice is “melting” but the above data does not support that especially with a strong negative AO (low sea water temp.)
As Steve points out shear does explain the hole especially since it is shaped like a long narrow “tear” The other “holes” along the shore line are also long narrow tears.
Excerpt from: R. Gates on May 27, 2010 at 2:46 pm
From IARC-JAXA data (csv file):
So March 31 was actually higher, according to them.
14,407,344 – 11,300,781 = 3,106,563 km^2 lost from the 3/31 max to now.
Those numbers are fun to play with once you get them crammed into a spreadsheet, which I did for practice with Open Office yesterday. Going by the full datasets for 2003 to 2009, going by the max and min, 2007 did have the largest drop by percentage, only retaining 30.5% of the maximum. Yet while 2008 had less percentage loss at 32.4%, it had a greater extent loss than 2007 and greatest of the group, 9,809,062 km^2 versus only 9,691,094 in 2007.
Wow, play with these numbers long enough and you can start to believe they actually mean something.
jakers
Ice is three dimensional. If it is losing area on the leeward side of a peninsula due to shear, then it is increasing volume by piling up on the windward side.
stevengoddard says:
May 27, 2010 at 3:03 pm
R. Gates
Arctic sea ice extent has declined almost as low as 2006, which had the second largest summer extent in the JAXA record. Scary ….
______________
Absolutely terrifying! But 2006 had a much different dynamic as it essentially bounced around a -1,000,000 sq. km. negative anomaly the entire year, whereas this year, as we all know, we were almost at normal back in April and have seen a steep drop since then.
I certainly don’t expect the steep drop to continue, but I do think we’ll end up below Sept. 2006’s summer minimum (and 2008 and 2009)…and if we don’t, of course and a mea maxima culpa for Steve!
R. Gates says:
May 27, 2010 at 2:46 pm
The 3,000,000 or so sq. km of ice extent lost in the Arctic since the yearly high on March 30 didn’t all vanish by shearing nor by melt, or being washed out of the Fram Strait by the currents…
…yada, yada, yada. Give it a rest, please.
You go on and on in an attempt to establish AGW as an energy imbalance. Of course it is! Climate is an energy imbalance by its very nature. Why, then, do you concentrate on the loss of Arctic ice with no mention of Antarctic sea ice gain? If you look at any one part of a system, you most certainly will find an energy imbalance, but that also means you are looking less closely at the other part or other systems, increasing the likelihood of missing the big picture.
One of these “big picture” items is your oversimplification in implying that wind is a “macro temperature”, suggesting that global warming leads to greater wind energy. This is not necessarily so. As you must know, winds depend more on a varied or wider temperature gradient and not simply an increase in temperature. And according to the IPCC (and I gather, the great “consensus”), AGW is not so much manifested by an increase in daytime highs as it is in an increase of night time lows. In other words, AGW should result in an INCREASED HOMOGENIZATION of temperatures, and thus a decrease in temperature gradients.
I’m not claiming that wind energy is lower or higher than normal, globally. I just find your reasoning that AGW is at the root of it lacking.
JJ says:
May 27, 2010 at 10:47 am
The sea ice situation is worse than it appears. All of that ice in the Bering Sea will rapidly melt in the coming days and at the time the true anomaly will become apparent and we’ll be way below any other year for this date.
REPLY: I think you are off in that prediction. We’ll see in about one to two weeks. Commenters take note. -A
stevengoddard says:
May 27, 2010 at 11:00 am
JJ
No doubt all that 4-1/2 foot thick ice will melt during the next week with 30 degree air temperatures.
______________
But since JJ said the Bering Sea and the 4.5 foot thick ice is at Point Barrow in a completely different ocean, I’m wondering how Steve’s comment makes any sense? There is not much (if any) 4.5 foot thick ice remaining in the Bering Sea right now. JJ is probably right…Bering Sea ice will be gone in the next few weeks….
Daniel M says:
May 27, 2010 at 4:07 pm
“I’m not claiming that wind energy is lower or higher than normal, globally. I just find your reasoning that AGW is at the root of it lacking.”
____________
AGW or not, one of the forms of energy that sunlight is converted to wind…and so when looking at the total energy balance of a system, you need to look at all the forms of energy that solar radiation may be converted to and that multiple forms of energy (that once were sunlight) can cause sea ice to melt. That was my point. I never said wind would increase or decrease because of AGW. But but one thing is certain, if AGWT is correct, that extra energy that is not leaving the earths systems will be somewhere.
Anu says:
May 27, 2010 at 2:00 pm
“The warm Atlantic is the dominant oceanic influence on the Arctic.”
I would tend to agree, especially for the present rather rapid decline. Recent work suggesting increased warm flow into the Barents and Greenland seas seem to align well with where the most precipitous declines are occurring
http://wattsupwiththat.com/2010/02/16/greenland-glaciers-melt-due-to-sea-current-change-not-air-temperature/
http://wattsupwiththat.com/2009/10/08/new-paper-barents-sea-temperature-correlated-to-the-amo-as-much-
Actually the beaufort gyre has been strong all winter. That publicity seeking bunch of polar walkers struggled with it in trying to reach the pole remember?
The ice moves/rotates all the time and you consequently always get these areas where the sheets are pulling apart. In winter the open water so created quickly freezes. As it gets warmer this freezing slows and you reach a temperature where it happens too slowly to cope with the rate at which the sheets are pulling apart. Then you start to see open water. Nothing has to melt. The temperature doesn’t even have to go above freezing for this to happen.
This is probably how the ice cap breaks up every year. It is just part of the natural mechanism by which that happens.I don’t think there is much point quibbling over whether this means the ice has moved or melted. The bottom line is that natural processes are starting to diminish the extent of the pack ice as they do every year, and that this year, after a very slow start, the process now seems a little ahead of schedule.
R. Gates
So you are saying that a 1 Mkm^2 anomaly in 2006 is different than a 1 Mkm^2 anomaly in 2010?
I’m just curious about what has happened up there. The ice is spinning faster than the Earth??
Or, did the Earth slow down ever so slightly that the ice continues and tears away?
Or (c) unknown forces at work.
It is, however, most interesting that the ice has continued to thicken.