By Steve Goddard
I like to watch the sea ice graphs as much as anyone, and have wondered how much value they have in forecasting the summer minimum. So I researched it a bit and discovered that their predictive power this early in the melt season is very poor. The DMI graph below highlights the problem:

http://ocean.dmi.dk/arctic/icecover.uk.php
Note that 2006 had the highest summer minimum, yet was lowest most of the winter and through part of the spring. The graph below shows the rsquared correlation between relative monthly ranking and September ranking, and indicates poor correlation prior to August 1.

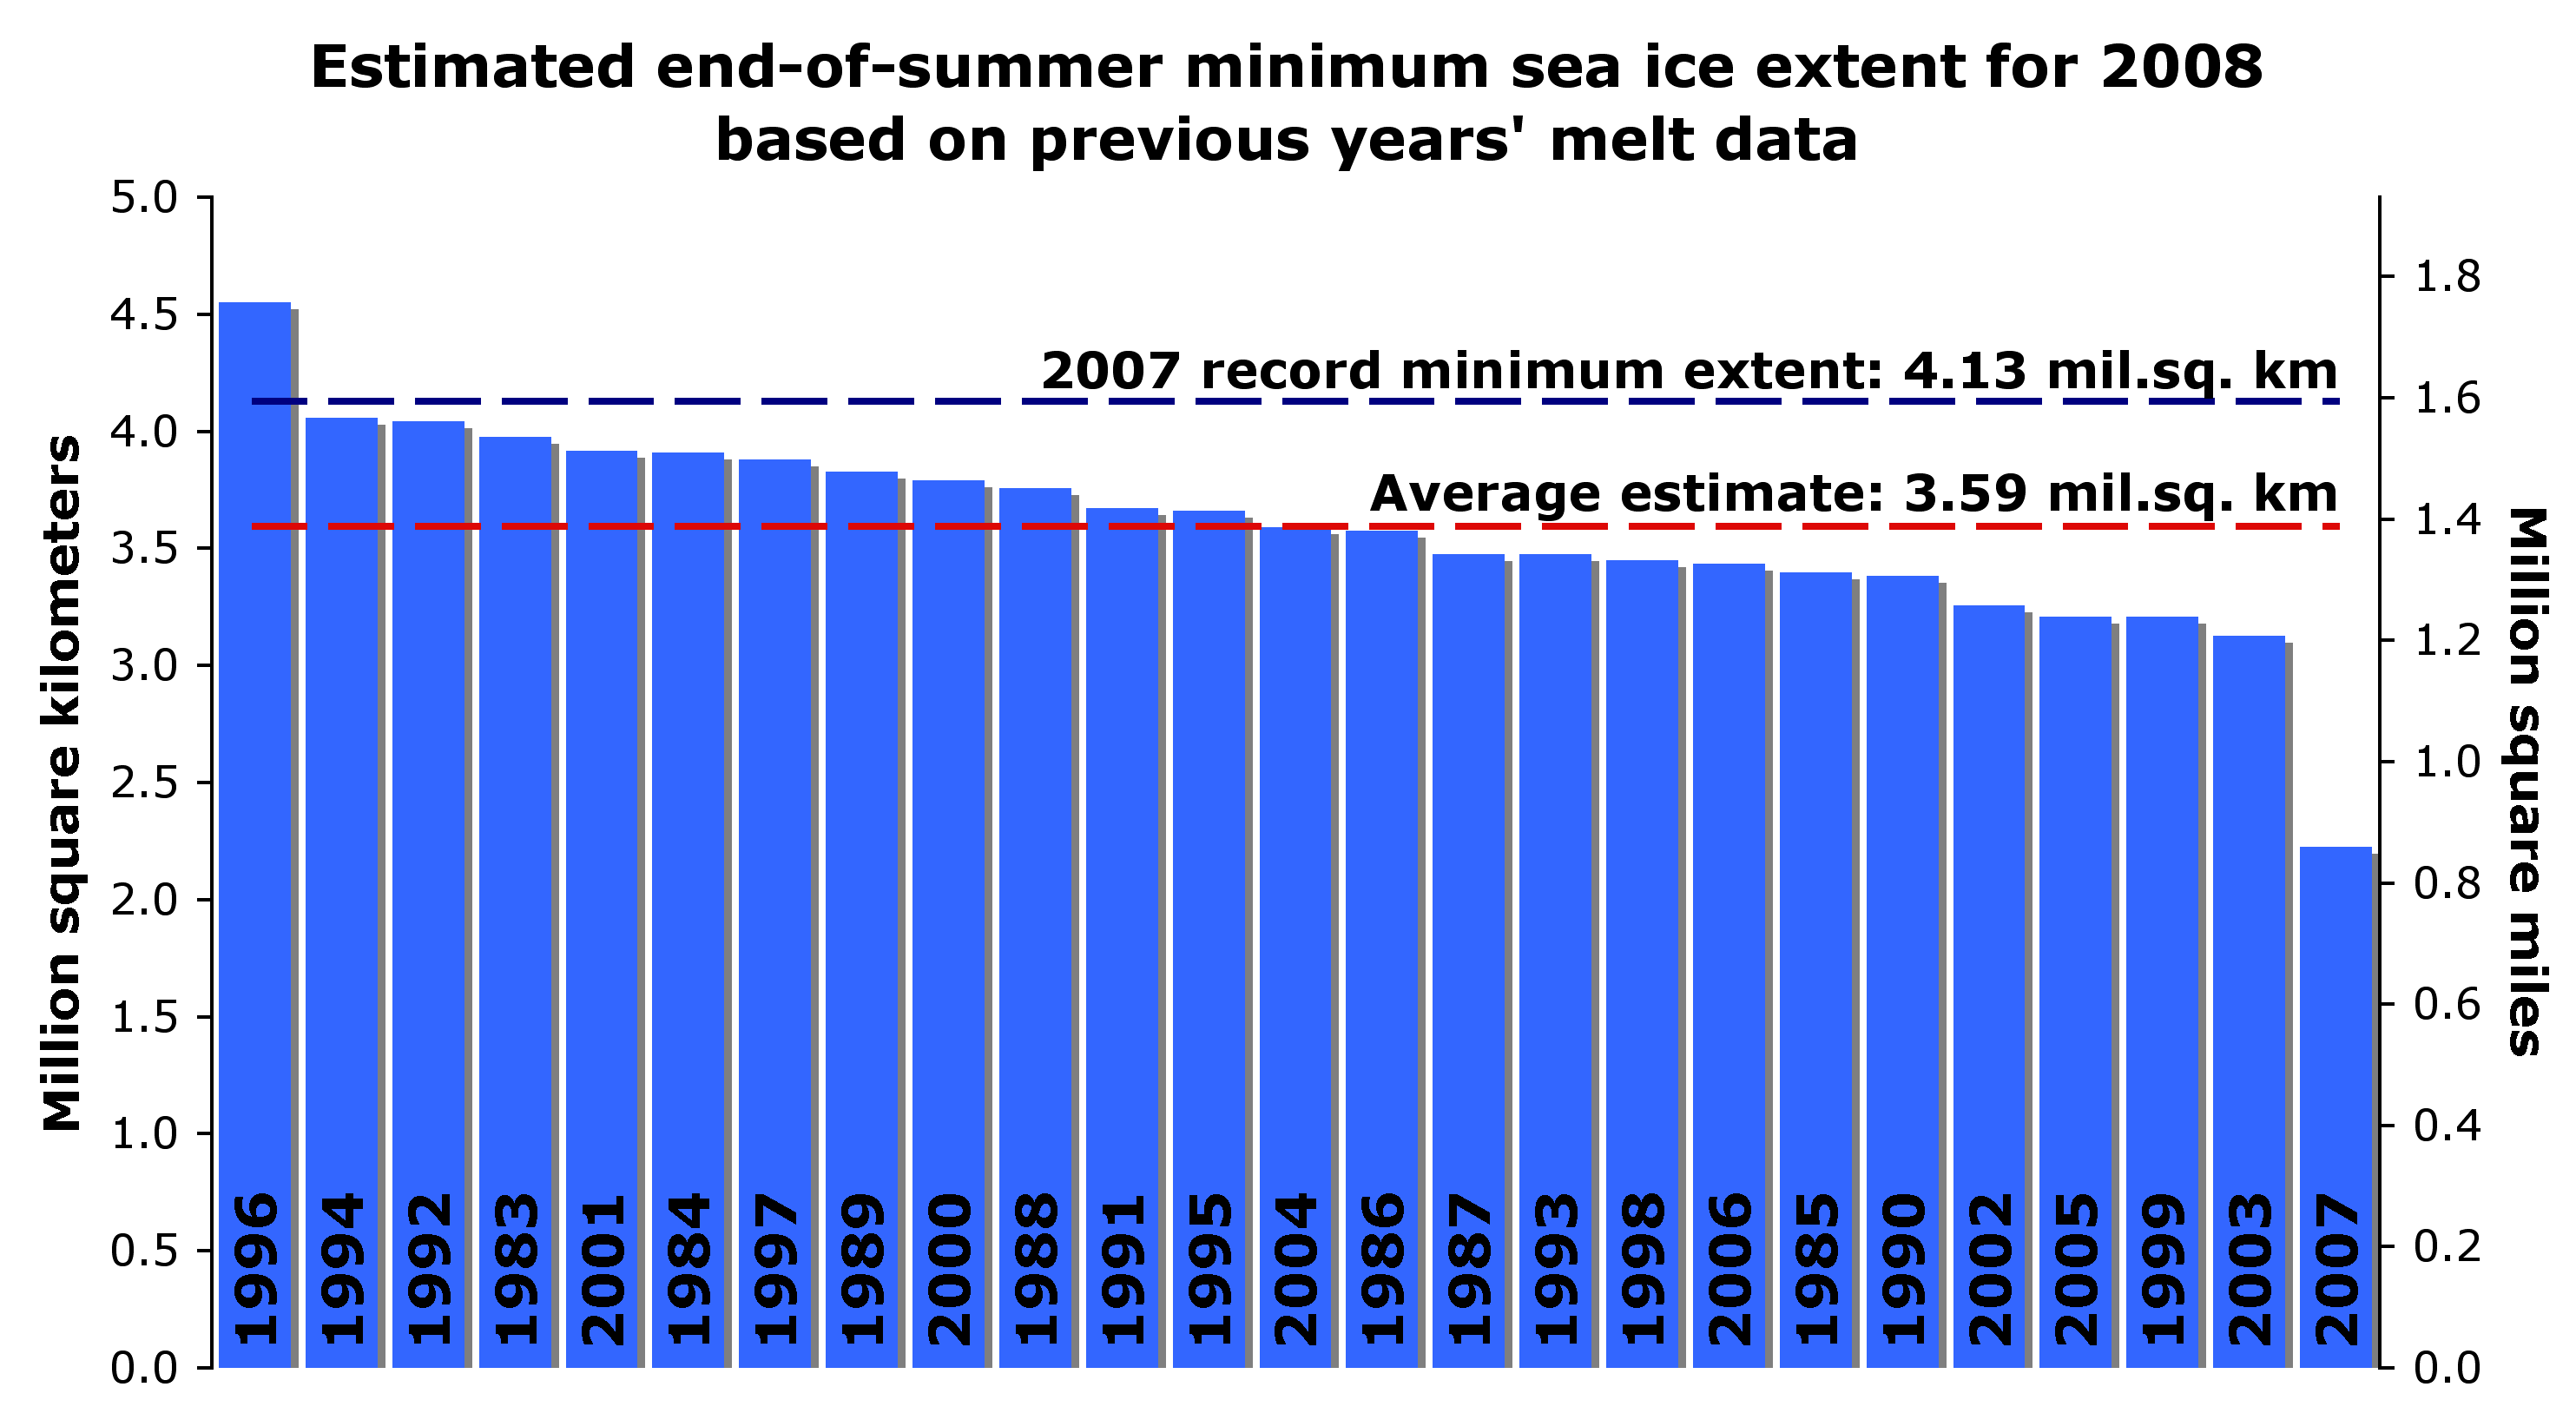
Conclusion: Prior to August 1, the graphs tell us just about nothing about how the summer minimum is likely to turn out. The fact that April, 2010 had the highest extent in the DMI record tells us little or nothing about the summer minimum. There are too many dependencies on ice thickness and summer weather to make a meaningful prediction based solely on the extent graphs. NSIDC has used other methods of prediction, and done poorly – such as this forecast of a record low made in May, 2008.

http://nsidc.org/images/arcticseaicenews/200805_Figure4.png
The Barrow Ice Observatory has studied the relationships between cloud cover and ice breakup date, and found some correlation, seen below. They believe breakup occurs after the ice has received 700 MJ/m² of solar energy. A sunny summer means an earlier breakup date. A cloudy summer means the ice will break up later. The three earliest breakup years occurred in 2002, 2003, and 2004. The last two years were among the latest.

It is also interesting to note how dirty the snow and ice is around Barrow. No doubt this is a contributing factor.

http://seaice.alaska.edu/gi/observatories/barrow_webcam
Discover more from Watts Up With That?
Subscribe to get the latest posts sent to your email.
Alexej Buergin says:
May 16, 2010 at 11:56 am
“Anu says:
My prediction: the first CryoSat-2 data will show the Arctic ice volume continues to trend down.”
The satellite will be in orbit for only a few years and cannot therefore establish a climatic trend (about 30 years necessary).
As Polar 5 showed last year, the thickness of the ice is not well known (was up to twice as thick as thought). Therefore the published volumes are not much more than guesswork.
The volume is only being discussed because the extent did not do as wished.
If CryoSat-2 was the very first data on arctic sea ice thickness, you would be correct, but they have been measuring this for decades with ICESat, submarines and airplanes.
You might argue that the scientific estimate of arctic sea ice thickness (assimilating all known measurements into a model of the arctic sea ice) is not accurate enough for your standards of perfection:
http://psc.apl.washington.edu/ArcticSeaiceVolume/images/BPIOMASIceVolumeAnomalyCurrent.png
but you cannot argue “the volume is only being discussed because the extent did not do as wished.” Arctic sea ice volume is a crucial parameter for understanding this part of the cryosphere, since the ice is so thin (centimeters to a few meters), and satellites like ICESat were being designed back in the 1990’s, which had nothing to do with “sea ice extent did not do as wished” in 2008 or 2009.
As for the aircraft Polar 5, they concluded:
All in all, the ice was somewhat thicker than during the last years in the same regions, which leads to the conclusion that Arctic ice cover recovers temporarily
http://tinyurl.com/yeyxpq4
The “Financial Post” might have thought the sea ice was “up to twice as thick as thought”:
http://network.nationalpost.com/NP/blogs/fpcomment/archive/2009/05/04/lawrence-solomon-deep-arctic-ice-surprises-scientific-expedition.aspx
but the researchers themselves don’t say that.
Unfortunately, airplanes can only measure limited areas of the Arctic, which is why satellites like ICESat and CryoSat-2 are important.
I’d be quite surprised if the PIOMAS model was not already incorporating this April 2009 data, since that’s what it does – incorporate all known measurements of Arctic sea ice thickness. Maybe the Polar 5 data is part of the little blip of ice volume growth in 2009.
Anu says:
May 17, 2010 at 12:43 pm
Although “Sea Ice Graphs Have Limited Predictive Value”, they are interesting to look at during the long wait for the summer minimum:
http://www.ijis.iarc.uaf.edu/en/home/seaice_extent.htm
Zoom in on the 2010 red line (save it locally, then zoom in): it quickly dropped down past the 2009 curve, then the 2008 curve, then more slowly crossed the 2003 curve, then the 2005 curve. Next up – 2007.
++++
Uh huh. And look at 2007 vs 2006 for this date. How’d that work out for their respective extent minimums?
And where did the divergence really begin to show up for those two? July 1, right where I’ve been pointing for several weeks now.
Steve, I don’t know how DMI differs from JAXA; presumably they are both measuring the same planet; but both of them show the 2007 fall minimum coming somewhat later than the 2009 and also the 2008 minimum but not so much. As I recall, the JAXA 2008 minimum came quite a bit earlier than 2007; and then some time later they revised it, and quite changed the shape of the 2008 refreeze.
And of course that was what I had cited that barefoot girl said I was totally wrong on; well it wasn’t my data; I just read the graphs they put out.
As for predicting what 2010 will do; or anything else about it; well I plan to be a spectator, and predict it after the fact. I have no basis for guessing what will happen; and I’m only curiosity interested in seeing what happens; I’m sure it will be different again and I still won’t have any reference as to what the total sea ice mass is; or is doing. I know that is of concern to researchers; and I guess Gaia will run the ice down to where she wants it to be.
I love it when some researcher or maybe it’s a reporter; says that the ice is twice as thick as they thought; or is disappearing twice as fast as they thought;
Why on earth are they thinking it is different from what it is. Why not observe what it is; and then report that; and cut out these faster than we knew silly statements. It is growing just as fast as it is; or now shrinking actually so that is what you should be thinking; not some other numbers.
geo says:
May 17, 2010 at 3:52 pm
Yes, it is not predictive, just interesting.
Interesting that it dropped below four previous years so quickly, and is now poised to drop below 2007.
That’s all.
George E. Smith says:
May 17, 2010 at 4:37 pm
That comment was twice as reasonable as I expected.
This is an interesting video showing Woods Hole researchers, including Sarah Das, in the field studying the melt-water lakes that form on the surface of the Greenland ice-sheet. They observe that these lakes sometimes will suddenly drain through a crack in the ice to the bottom.
It appears that they all believe that man-made global warming is adversely affecting the ice-pack there. Other than simply stating their personal opinions to this effect, however, as far as I can see, they present no evidence that their observations are abnormal, unprecedented, or exacerbated by man.
Paul Nottingham says:
May 15, 2010 at 3:15 pm
Quick question. When you look at the IJIS graph then there is a little blip just before the start of June where the extent of sea ice increases for a short time. Can anyone tell me why this is?
You’ll be pleased to know that JAXA have changed their method so that this no longer happens (they said last year that they were attempting to do so).
“[Updated on May 18, 2010] Previous version of data processing had made an erroneous blip of sea ice extent on June 1st and October 15th which was seen in the graph of sea ice extent as a small peak on these dates. We improved the processing to make the graph much smoother. The apparent blip had arisen due to a switching of some parameters in the processing on both dates. The parameter switching is needed because the surface of the Arctic sea-ice becomes wet in summer due to the melting of ice which changes satellite-observed signatures of sea-ice drastically. By this improvement most of the sea ice extent values are not affected at all except for the period of May 20-June 11 and October 8-26 of each year.”
Spector says:
May 17, 2010 at 11:51 pm
…
as far as I can see, they present no evidence that their observations are abnormal, unprecedented
Why is it important if the Greenland ice sheet, or all the ice sheets in the world, were gone 800,000 years ago, or 3 million years ago, or 1.3 billion years ago ?
Something doesn’t have to be “unprecedented” to present a problem now – and if the disappearance of the cryosphere will affect the climate upon which Civilization is based, that is an issue for now.
And if it is an issue for now, it is important to understand why it is happening now. This is what Science does – attempts to understand the natural world. Pointing out that something similar happened a long, long time ago, for reasons unknown, is just marginally useful context for understanding what is happening now.
RE: Anu: (May 18, 2010 at 9:44 am) “And if it is an issue for now, it is important to understand why it is happening now. This is what Science does – attempts to understand the natural world. Pointing out that something similar happened a long, long time ago, for reasons unknown, is just marginally useful context for understanding what is happening now.”
Yes, that is all true. It is important to do all we can to understand what is happening to the Greenland ice-pack now and in the past. That is science. The report I linked (May 17, 2010 at 11:51 pm) does show valuable field research in progress. However, as reported, that study did not provide any evidence of man-caused pollution or contamination of the ice-surface which might be accelerating the melting process. The determination of the degree that human activity may have influenced the climate of the Modern Warm Period was beyond the scope of their study.
As far as I can see, there is, as yet, no convincing evidence that our modern global climate has been seriously impacted by human activity except in local urban heat concentration areas. I do not think we would be here today if the dangerously high positive feedback levels required to make carbon dioxide responsible for the modern warming of the last 100 years were in effect.
stevengoddard says:
May 15, 2010 at 4:37 pm
u.k.(us)
I flew over Greenland during the late summer 2007 Armageddon, and the ice was filthy for many miles on the western side. Dirty snow/ice plays a big part in Arctic melting.
=====================================
Here is a nice view of local dirt being blown onto the Greenland icesheet dated 5/10/10, I imagine by the end of summer it will be everywhere.
It must happen anytime the ground is exposed and weathering.
http://rapidfire.sci.gsfc.nasa.gov/gallery/?2010130-0510/Greenland.A2010130.1330.250m.jpg
Amazing photos NASA has, all that is needed is a clear day.
Their archive goes back to 2001.
Just thought you might be interested.
Now it’s dropped below 2007, and is poised to drop below 2004, then 2006.
Nothing “predictive”, but it’s dropping like a rock, at a steeper rate than any of the IARC-JAXA years (which are all post-2000, when the Arctic ice really started worrisome summer melts).
Just interesting.
Guys. The extent doesn’t matter now. The rate doesn’t matter now. Wait until the line passes towards 8e6 sqkm and look at the rate then. If the rate of loss is high, that will tell you if we are headed towards a minimum.
Do we have any information regarding sea ice volumes before or concurrent with NSIDC or JAXA? I think unless we have this information we have no way of knowing whether to prefer volume versus extent as a metric is valid. I’d appreciate an answer if anyone out there knows.