By Steve Goddard
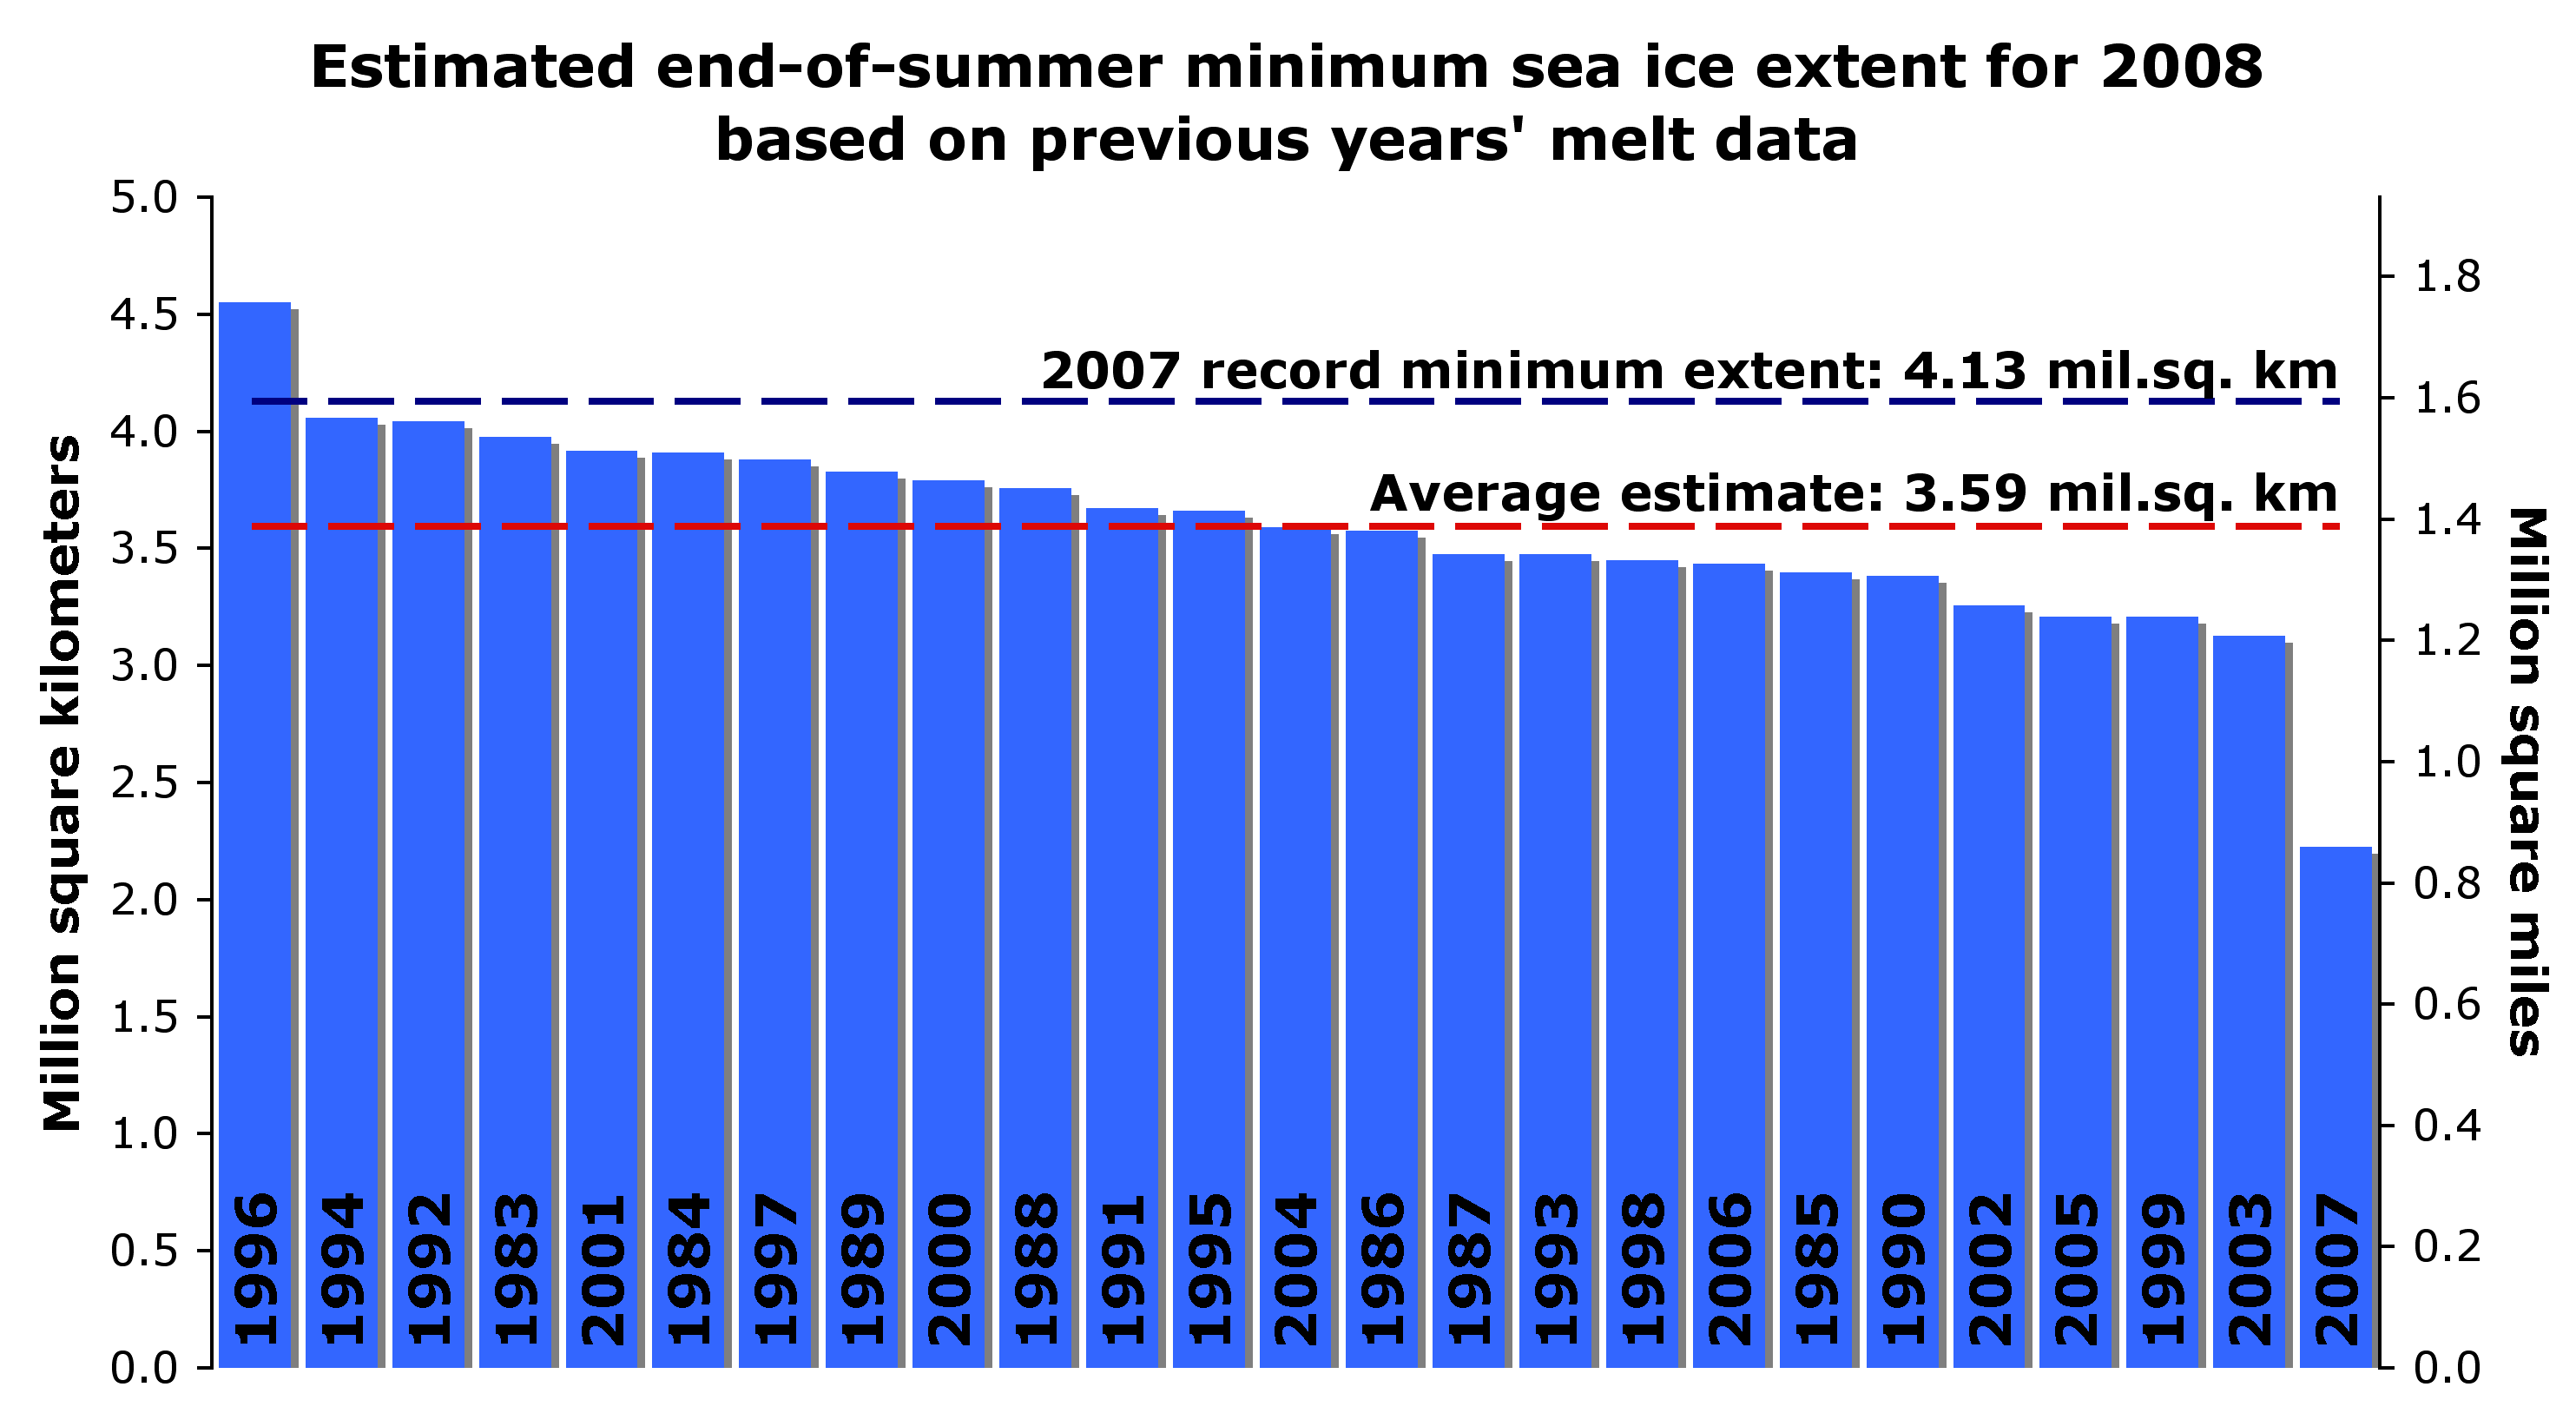
I like to watch the sea ice graphs as much as anyone, and have wondered how much value they have in forecasting the summer minimum. So I researched it a bit and discovered that their predictive power this early in the melt season is very poor. The DMI graph below highlights the problem:

http://ocean.dmi.dk/arctic/icecover.uk.php
Note that 2006 had the highest summer minimum, yet was lowest most of the winter and through part of the spring. The graph below shows the rsquared correlation between relative monthly ranking and September ranking, and indicates poor correlation prior to August 1.

Conclusion: Prior to August 1, the graphs tell us just about nothing about how the summer minimum is likely to turn out. The fact that April, 2010 had the highest extent in the DMI record tells us little or nothing about the summer minimum. There are too many dependencies on ice thickness and summer weather to make a meaningful prediction based solely on the extent graphs. NSIDC has used other methods of prediction, and done poorly – such as this forecast of a record low made in May, 2008.

http://nsidc.org/images/arcticseaicenews/200805_Figure4.png
The Barrow Ice Observatory has studied the relationships between cloud cover and ice breakup date, and found some correlation, seen below. They believe breakup occurs after the ice has received 700 MJ/m² of solar energy. A sunny summer means an earlier breakup date. A cloudy summer means the ice will break up later. The three earliest breakup years occurred in 2002, 2003, and 2004. The last two years were among the latest.

It is also interesting to note how dirty the snow and ice is around Barrow. No doubt this is a contributing factor.

http://seaice.alaska.edu/gi/observatories/barrow_webcam
“A sunny summer means an earlier breakup date. A cloudy summer means the ice will break up later.”
Nah, couldn’t be. That would actually follow known laws of physics. For which 23 different models (showing the science is settled) is not required.
It has to be the result of more CO2 trapping emitted radiation and bouncing it back down to the ice, sorta like a laser bounces light between two parallel mirrors until it builds up sufficient power to blast through the partial mirror end. The ice has to heat up to eventually get the radiation past all that CO2 and into the vast blackness of space. Ice can only heat up so much, then it must melt (something about properties of water ice, melting point, etc).
But to attribute this to increased incident solar radiation (insolation, or “sunny summer”), and less albedo (“cloudy summer”) is just far too speculative.
(/sarc)
There. I feel better now.
GeoFlynx
My expectations for the summer minimum haven’t changed.
Sea-ice extent graphs are not predictive. They are observational records,as Crosspatch points out. Why should they have any predictive value?
Mining that graphic from the NSIDC May 2008 press release is not very illuminating; in its actual context it was not presented as a hard prediction,but more as a discussion point,a ‘simple estimate’. Two actual model projection projects were then discussed,the second of which [fromUW’s Applied Physics Laboratory] was on the money. The press-release was headed: “Arctic sea-ice forecasts point to lower-than-average season ahead”. Which is very much how it panned out.
If you want to discuss prediction,why not look at various groups modelling projects?
stevengoddard says:
May 15, 2010 at 4:37 pm
u.k.(us)
I flew over Greenland during the late summer 2007 Armageddon, and the ice was filthy for many miles on the western side. Dirty snow/ice plays a big part in Arctic melting.
=========
O.K. agreed I guess.
How far off might a long warming trend throw off the ice core timeline.
What about the Arctic “wind flushing”.
Did you fly over Greenland during the cooling scare of the 70’s.
Nothing personal, i’m just sick of this never ending AGW hype.
My comment came out wrong, not sure what i was trying to say.
stevengoddard says:
“My expectations for the summer minimum haven’t changed.”
————–
Steve,
On what do you base your prediction, and exactly what is your prediction for summer minimum arctic sea ice? (please specify which data set you will base in on)
There is a long-term trend of decreasing sea ice in the Arctic even if it does proceed chaotically. We have satellite records that show a steady decline of summer ice cover since 1978 when the records first became available. This is all part of Arctic warming that has been going on for well over a century now. Kaufman et al. (Science 325:1236-1239) have pinned its beginning down to the start of the twentieth century. It started very suddenly after a two thousand year cooling trend, paused for a few decades in mid-century, and has continued on to this day. Contrary to the AGW dogma it cannot be caused by the greenhouse of effect because of its sudden beginning. That is because laws of physics demand that carbon dioxide partial pressure has to jump when a sudden warming occurs, and this simply did not happen. We need a physical process that can suddenly deliver warmth to a large geographical area of the Arctic, one that is capable of retracting as happened in mid-century, and then continuing on as before. The only possible way to accomplish this is through a rearrangement of the North Atlantic current system to direct warm water to the Arctic. Satellite views show that the Gulf Stream today carries huge amounts of warm water to the the Arctic and thereby keeps Russian Arctic ports ice free. It is likely that it assumed this northerly course at the turn of the century when Arctic warming began. Smaller amounts of warm water enter the Western Arctic Ocean through the Bering Strait. Usually that is enough to keep the Chuckchi Sea, just north of the strait ice free, but it may extend to the north coast of Alaska, depending upon the pattern of winds in the area. The big melt of 2007 was all on the Bering Strait side of the ocean, implicating warm water coming through the strait as the culprit. Together these currents are sufficient to explain all observations of Arctic warming and thereby make any greenhouse theories of warming doubly superfluous.
Stevie baby…
Let’s talk.
Solar rays and cloud cover DO have a factor. The angle of the planet to the sun and the solar rays would mean that the distance through the atmosphere would be MUCH greater. Unlike at the equator where the sunlight is just about perpendicular to the planet.
R. Gates
Same criteria I based it on when I made the forecasts. Main factors are the retention of multi-year ice this winter due to the negative AO, and the cold water in the North Pacific.
Barrow looks like that all year round (muddy and mud-splashed). It’s got lots of gravelly soil, not much asphalt, and when you plow it in to heaps like that you’re going to pick up some dirt with it. During the thaw there’s no shortage of muddy slush.
Sea ice will sometimes be pushed ashore and it (what I’ve seen) tends to be typical of coastal sea ice – grounded ice will pick up some inclusions. Ice in shorebreak (when it exists) is churned into a muddy soup and refrozen, adding to the mix.
I generally agree with you, Steve. But I’d back it up to July 1 rather than August 1. I look at the last few years and July 1-July 15 has some value, I think.
I’ve said it a few times in the last month or so. . . but I think ice concentration in the “core” as shown in the comparative tool at Cryosphere is much more indicative of eventual minimum at this time of year. We’ll see if that stays true this year –but I’m betting it will.
What we know is that areas outside the core are going to melt. They just are. To the degree they have predictive value, it could be those areas that are natural exits to the south. To the degree those areas are gummed up with higher concentrations during early melt season they could delay the exit of some ice and contribute to a higher minimum.
But outside of that, from Spring Max to July 1 I’m sitting on the concentration values of the core as the most important indicator of eventual Fall minimum.
Still sitting on 6.0-6.2M minimum.
Plane falls through High Arctic ice
The passengers, who were conducting a scientific survey in the High Arctic, spent about two hours on the ice before they were rescued.
Read more: http://www.cbc.ca/canada/north/story/2010/05/11/borek-plane-arctic.html#ixzz0o4A4aBQI
I did a phase plot of the sea ice extent. What I found was that there is no correlation between the maximum extent and minimum extent as stated in the initial post. However, there is a way to predict the minimum extent a few months in advance. Between the points of 10e6 and 8e6 sqkm, high derivatives lead to low minimum extents. It’s a pretty easy thing to do. Just plot dA/dt vs. A and take a look at what happens when A ~= 9e7 sqkm.
“When you look at the IJIS graph then there is a little blip just before the start of June where the extent of sea ice increases for a short time. Can anyone tell me why this is?”
I don’t know but the first place I would look is how sea ice extent is calculated. I vaguely remember it’s the sum of those areas that have more than 15% sea ice. If so that knuckle (or bump as you put it) might be sea ice breaking away from the main ice and covering a larger area for a short period of time. So it might not be “more ice” but the same amount of ice over a larger area.
Steve,what retention of MYI are you talking about? What ice age category? Because the ice 5 years or older actually declined even further this winter, and the 2nd and 3rd year ice that was advected into the Beaufort Sea this winter is likely not going to survive the transit through the Gyre. What exactly are you basing your prediction on? Doing some hand-waving? Statistical correlation analysis? Running a physical coupled atmosphere-ocean model? I would love to know what you use to back up your statements. Scientists could not make base their predictions on the negative AO and MYI ice cover. Data has shown again and again that it doesn’t work.
Bill says:
May 15, 2010 at 1:22 pm
I used to live in Boston and had a driveway to keep clear in the winter. Shovel early, shovel often.
…I imagine you’ll get the same effect from soot.
Or volcanic ash?
Is it dirty because of the increased droppings of the polar bear population?
skye
Given that essentially all of the first year ice disappeared in 2007, any third grade math student can figure out there isn’t much four year old ice in 2010. But there is a lot of multi-year ice on the Alaska side which wasn’t there during the last two years.
http://nsidc.org/images/arcticseaicenews/20100406_Figure6.png
September will come soon enough. Please save the spin.
u.k.(us) says:
May 15, 2010 at 1:05 pm
“It is also interesting to note how dirty the snow and ice is around Barrow”
Dirty how, and dirty why?
Is all arctic ice so dirty?
Local dirt, or transported dirt?
Looks like local dirt.
________________________________________________________________________
No it is not local dirt. It is soot from the Chinese coal fired generators. I have a friend in Alaska who about fou/five years ago was complaining about the amount of SMOG now seen in Alaska blowing in from China.
“From 500 miles in space, satellites track brown clouds of dust, soot and other toxic pollutants from China and elsewhere in Asia as they stream across the Pacific and take dead aim at the western U.S.
A fleet of tiny, specially equipped unmanned aerial vehicles, launched from an island in the East China Sea 700 or so miles downwind of Beijing, are flying through the projected paths of the pollution taking chemical samples and recording temperatures, humidity levels and sunlight intensity in the clouds of smog.
On the summit of 9,000-foot Mt. Bachelor in central Oregon and near sea level at Cheeka Peak on Washington state’s Olympic Peninsula, monitors track the pollution as it arrives in America.
By some estimates more than 10 billion pounds of airborne pollutants from Asia — ranging from soot to mercury to carbon dioxide to ozone — reach the U.S. annually. The problem is only expected to worsen: Some Chinese officials have warned that pollution in their country could quadruple in the next 15 years….
“East Asia pollution aerosols could impose far reaching environmental impacts at continental, hemispheric and global scales because of long-range transport,” according to a report earlier this year in the Journal of Geophysical Research. The report said that a “warm conveyor belt” lifts the pollutants into the upper troposphere — the lowest layer of Earth’s atmosphere — over Asia, where winds can bring it to the U.S. in a week or less….”
Read more: http://www.mcclatchydc.com/2008/08/31/51148/scientists-fear-impact-of-asian.html#ixzz0o5c2E5ed
Paul Nottingham,
read http://www.ijis.iarc.uaf.edu/en/home/seaice_extent.htm please. They describe it very well in “Method for calculating sea-ice extent”.
I should have added to my above post that I am talking about sea ice and wilderness snow cover that would not be effected much by local human activity.
“Is it dirty because of the increased droppings of the polar bear population?”
Yeah. Global warming scares the poop out of them.
stevengoddard says:
May 16, 2010 at 3:59 am
skye
Given that essentially all of the first year ice disappeared in 2007, any third grade math student can figure out there isn’t much four year old ice in 2010. But there is a lot of multi-year ice on the Alaska side which wasn’t there during the last two years.
http://nsidc.org/images/arcticseaicenews/20100406_Figure6.png
September will come soon enough. Please save the spin.
Indeed it will. We know where that MY ice came from, it’s drifted from the Canadian shoreline where the oldest ice always accumulated. The trouble is that it’s broken up over the last few years and become more amenable to drifting, and is being replaced by one and two year ice, hence the dramatic reduction in ice volume. The Arctic sea ice is becoming seasonal like the Antarctic sea ice.
This movie shows the breakup starting in late 2007, similar breakup is causing that tongue of ice north of Barrow that you showed.
http://ice-glaces.ec.gc.ca/content_contenu/SIE/Beaufort/ANIM-BE2007.gif
If there is another SEARCH Sea Ice Outlook competition this year, we will be able to see how the experts are doing (last years answer: very badly).
The prognosis of NSIDC-personnel in AUGUST 2009 (for September 2009) was 4.7 millions square kilometers.
As one can see here:
http://www.arcus.org/search/seaiceoutlook/2009_outlook/full_report_august.php
(click on Meier et al)
they tried to “apply statistical averages of rates of decline” and failed because they “took into account the nature of younger ice”.
Gail Combs says:
May 16, 2010 at 4:07 am
No it is not local dirt. It is soot from the Chinese coal fired generators.
You mean to say soot might be melting the ice and not massive AGW???
Let’s see wood stoves, coal burning, diesels generators(electricity in northern communities), vehicles (planes, trains, and automobiles), forest fires, volcanoes, fires, explosives, controled and uncontroled burns, grass fires, oil well fires…hmmm.
Now let’s see..winds carry soot so far (unless an up draft can carry them further),but water particulates in clouds can carry them much further before depositing them.
Black absorbs more solar heat…hmmm.
The science says, you could be right.
But it is not peered reviewed or published so… sorry you lose.
It is therefore incorrect!
kwik says:
May 15, 2010 at 2:16 pm
I wonder what thet hump is in june, in the JAXA plot. DMI doesnt have the june-hump.
++++
This is a perennial question that comes up many times every year at this time. NSIDC has an algorithm they apply from June to October or November (I forget which) that takes into account the fact that puddles of water on top of the melting ice make it harder for the satellite to tell what is open water and what is ice. So during that period they make an adjustment to allow for it, and when they turn it on and turn it off again it causes a blip up in June and a blip down later on when they quit doing it.