By Joseph D’Aleo, CCM ICECAP.US
El Nino is still hanging on but likely not for very long. Warmer than normal water can still be seen along the equator in the tropical Pacific. It is even warmer in the sub-tropical North Atlantic because of the suppressed winter jet stream and subtropical high which meant lighter than normal winds and less clouds.

Signs of the demise of the El Nino are numerous. It is likely given the flip of the PDO which favors shorter El Ninos and stronger, more frequent and lengthy La Ninas that a moderate to strong La Nina is next in the cards this year and next.

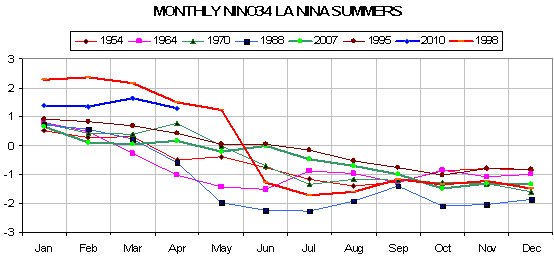
Notice in the temperature anomaly plot for NINO region 34 (region shown on the CDC map below)

How we are somewhere between 1998’s super El Nino and a cluster of more moderate ones and how they declined quickly by the summer on the graph that follows (enlarged here). Values are given in STD of NINO 34 SSTA.

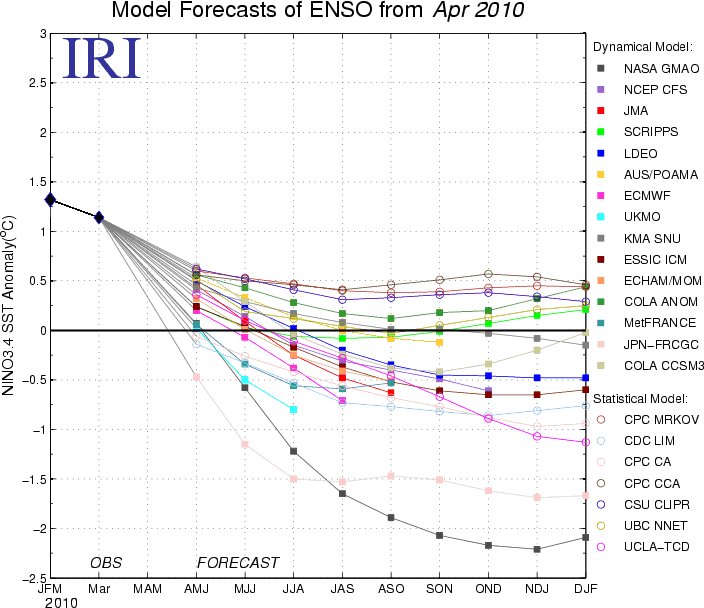
ENSO models, both dynamical (coupled air and ocean models) and statistical suggest a rapid cooling with all models dropping below threshold El Nino levels by summer (JJA – June-July-August) and perhaps half reaching La Nina values by summer or fall.

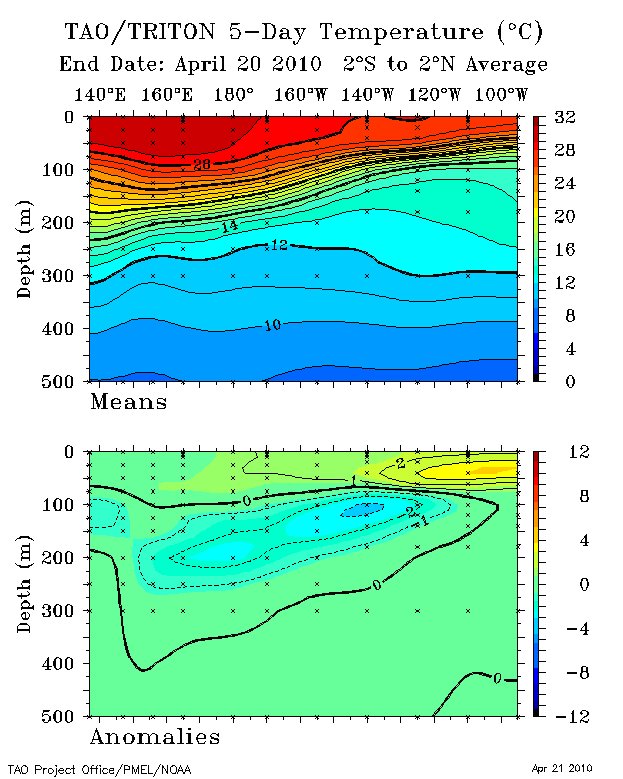
In the depth cross section across the entire tropical Pacific that is built from the TAO-Triton buoy data, we can see the warm water in the eastern top water which was 5C above normal has diminished as the water mixes with cooler surface water and the thermocline is lifted. Notice the developing strong cold pool not unlike that in 1998 at 100 meters across most of the Pacific. Notice the amazing cool down of NINO34 in 1998 from May to June in the multiyear graph above.

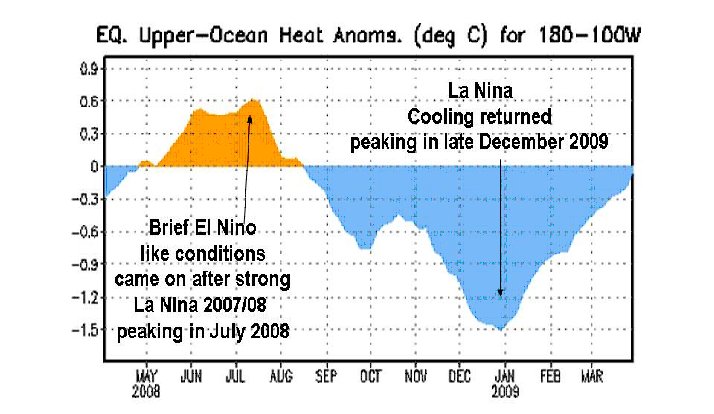
The El Nino followed two years of La Nina with below normal temperatures in NINO34 and in much of the Pacific leading to below normal ocean heat content in the tropical eastern half of the Pacific. A strong La Nina in 2007/08 was followed by a summer rebound then another dip in January.

We can see in the heat content the last year, a peak last summer a fall decline and then a multi peak winter warming fed by westerly wind bursts this past winter, notice the decline as we started April.
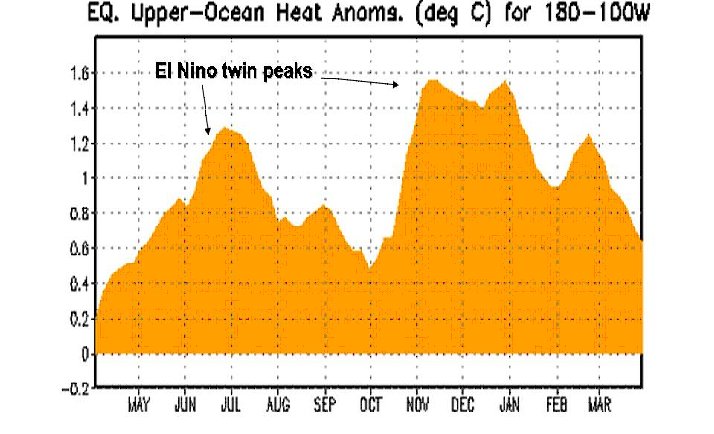

The Southern Oscillation Index which was in positive La Nina territory in 2007/08 and 2008/09 dropped into negative El Nino territory reaching an incredible 8 STS in early 2010. It has rebounded to positive and usually leads the change of ENSO state by a few months given credence to a return of La Nina.
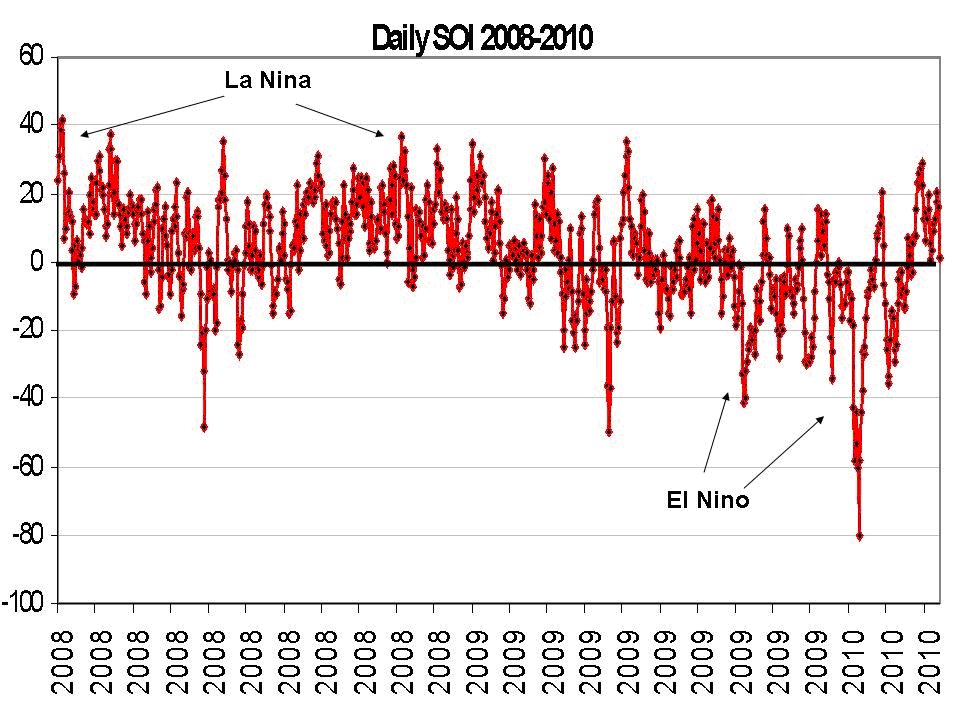

See much more on the possible implications for the summer and following winter (with recognition of the possible influence of the solar and volcano wildcards) here.
Re: Stephen Wilde April 27, 2010 at 4:34 am
Good points Stephen. Bob seems to be challenging us to make a distinction between decadal SOI & decadal PDO based on SLP. I like this direction.
Certainly you are correct that we cannot curb the “common usage” of PDO. The dictionary will have to have more than one entry and people throwing fits about this can be ignored.
vukcevic
April 27, 2010 at 4:26 am
It would make sense that solar wind, not cosmic rays would be responsible for any warming.
SAMA is huge compared to the current tiny hotspot off S.America.
I wonder if there is a slow westward creep of the S. Aurora oval too,
http://www.swpc.noaa.gov/pmap/gif/pmapS.gif
it is fairly opposite SAMA, and stays well put, unlike the N.Aurora oval, which moves considerably week by week. http://www.swpc.noaa.gov/pmap/gif/pmapN.gif
Ulric Lyons says: April 27, 2010 at 1:50 pm
“It would make sense that solar wind, not cosmic rays would be responsible for any warming. SAMA is huge compared to the current tiny hotspot off S.America.”
Perhaps I should be a bit more explicit: The warm spot I think is a suspect (erroneous) value obtained by the satellite sensors, reading being affected by the excessive cosmic ray intensity due to fall in the sunspot activity during the last fortnight (it appears to vary with SS count), this being area of the weakest point of the Earth’s MF.
See quote my from Wikipedia:
vukcevic says: April 27, 2010 at 4:26 am
The weakest part of anomaly (grey area in the graph) http://image.gsfc.nasa.gov/poetry/tour/tr7.gif
is of a similar size as in here
http://icecap.us/images/uploads/SST.jpg
Note the gradual transition in both illustrations.
@ur momisugly Tenuc April 26, 2010 at 8:48 am
My goodness. Don’t you know that the weak solar cycle 24 is caused by too much CO2 from humans burning too many hydrocarbons? The LIA wasn’t caused by too few sunspots; it was the other way around – too many cows farting and wood burning in fireplaces caused the sunspots to go away.
And our industry is what put the black hole at the center of the Milky Way.
And our cars are what caused the Big Bang.
It’s all our fault. Everything’s our fault. We, humans, are evil. We should just depart the planet and leave it up to the animals and plants to live in Edenic bliss until the sun goes nova. And the nova will be, of course, our fault, because we didn’t shut down our widget factories in time…
[Cue rending of cloth and beating of breast…]
Snarking aside, yes to all of the above, and more we don’t know anything about yet. We have been studying the atmosphere for such a short time, we should continually be humble about what we know about, as compared to the vast amounts we have yet to learn. Attempts at modeling the measurable affects of complex systems is not the same as understanding them. Writing code is not the same as understanding the big picture. To write code is to separate the parts into bits we can attempt to understand in isolation – but putting Humpty Dumpty back together (Grand unifies theories like AGW) again is something several decades or centuries in the future. We are only at the point of gathering facts about affects; assigning causes is beyond us at this point. Any jumping to conclusions about what causes what – that is getting the cart ahead of the horse. And we will be WRONG in those conclusions. Even if they are good guesses that seem to give good results, we can’t yet be sure we aren’t getting the right results for the wrong reasons. (Velikovsky did that for the surface temperature of Venus – and IMHO so did Sagan with his runaway greenhouse effect.) For now, to ask and keep asking is the proper approach.
As ideas to help us comprehend some of it, it is okay, as long as we only ask, like you did: “Perhaps this. . . along with that. . . and mixed in with this other thing?” Asking is fine.
Concluding? Correct concluding is beyond us right now. All conclusions have to be tentative, all understandings merely impressions. Seriously.
It is a good thing to TRY, but we just have to remember to not put much stock in the conclusions. Today’s conclusions are only steps toward full understanding, but they are not understanding any of it, in and of themselves.
What we don’t know far, far outweighs what we DO know. Some things appear to affect other things – but could it be the other way around?
With a system with so many feedbacks, who can be sure? Hansen? Mann? Havelock? Hardly… We are infants taking our first steps.
So, yes, perhaps. Perhaps, perhaps, perhaps. That is all we can do, is say, “Perhaps.”
No, that font is even more difficult to read.
Yowch! That was posted on the wrong post!
vukcevic says:
April 27, 2010 at 2:27 pm
I very much doubt that. Take a look at Jan 11th;
http://weather.unisys.com/archive/sst/sst_anom-100110.gif
=low solar wind velocity;
http://www.lmsal.com/solarsoft/last_events_20100113_1033/index.html
then 7th Feb;
http://weather.unisys.com/archive/sst/sst_anom-100207.gif
=higher solar wind velocity;
http://www.lmsal.com/solarsoft/last_events_20100209_1047/index.html
On a daily basis, circulation is a pivotal issue, look at the `potential temperature`
animation, Tropopause Maps (S.H) on here;
http://www.pa.op.dlr.de/arctic/index.html
you can get a clearer picture of daily changes in the region.
I had a brief look through the archive; http://weather.unisys.com/archive/sst/
and the area does show +ve anomalies that correspond to weekly global +ve anomalies
within the last year. SAMA induced, or just a circulation issue, I would say the temperature anomaly is real.
SAMA does interestingly, geographically lie on a stronger gravtational anomaly:
http://www.ngu.no/geodynamics/gplates/gravi-450dpi.jpg
vukcevic says:
April 27, 2010 at 2:27 pm
SAMA is fragmented and spread across the entire South Atlantic;
http://denali.gsfc.nasa.gov/research/crustal_mag/prep/pmc.JPG
Someone asked for a commentary on the Australian summer…..
Generally speaking…..quite warm (above average), but without the extremes. (eg. Melbourne had 7 days over 40c last summer, it had 1 day (over 40c) this summer – we average about 4-5 days over 40c each summer). Very warm nights (lots of cloud cover) across the SE region. Rainfall was average to slightly above average across the continent (slightly above average in the drought-affected SE areas but very high in the North (typical when El Nino starts to fade), with massive floods in the central desert regions resulting. A relatively quiet summer with respect to cyclones.
The SW wind patterns that bring cool changes to SE Australia every 8-10 days during summer were practically non-existent. These cool changes still did occur, but were accompanies by warmer NW winds instead of SW (3-4c difference). This was one of the main reasons (plus cloud cover) for the warmer average temps across SE Australia in our summer.
Good news for Australia, is the propsect of both a La Nina and negative IOD situation in our spring and summer, which SHOULD bring about widespread above-average rainfall in this period. Its the first time for over a decade that both these ocean conditions could eventuate at the same time. (its been frustrating – when we’ve had a -ve IOD, its been El Nino, and when its been La Nina, we’ve had a +ve IOD). Finally, we might just get both!!
After a decade of below average rains, Im looking forward to it!!
The Southern Oscillation Index which was in positive La Nina territory in 2007/08 and 2008/09 dropped into negative El Nino territory reaching an incredible 8 STS in early 2010.
The Australian Bureau of Meteorology (BOM), in March this year, attributed that SOI dip to
“……………. a sharp decline in
mean sea level pressure over Tahiti; in part due to several tropical depressions and Severe Tropical Cyclone Oli passing over the
region. ”
So this may have been an anomaly due to the Cyclone and not part of a usual SOI dip pattern.
I remember reading this in the March 3 Report. http://www.bom.gov.au/climate/enso/archive/ensowrap_20100303.pdf
Ulric Lyons says: April 27, 2010 at 5:53 pm
“SAMA is fragmented and spread across the entire South Atlantic;
http://denali.gsfc.nasa.gov/research/crustal_mag/prep/pmc.JPG “
Crustal Anomaly (imbedded static crust field, localised magnetization of the Earth’s crust) is a different feature to the Geomagnetic field strength. For the SAA see NASA’s International Geomagnetic Reference Field Model −− Epoch 2005, Main Field Total Intensity:
http://www.ngdc.noaa.gov/geomag/data/mag_maps/pdf/F_map_mf_2005.pdf
“vukcevic says:
April 28, 2010 at 12:06 am”
Recent SAMA maps;
http://heasarc.gsfc.nasa.gov/docs/rosat/gallery/misc_saad.html
http://earthobservatory.nasa.gov/IOTD/view.php?id=617
It corresponds fairly well to the crustal features, and the gravitational anomaly.
This may interest you;
http://www.neuralnetwriter.cylo42.com/node/2508
Global mag. anomaly map
http://ccgm.free.fr/WDMAM_b_gb.html
Ulric Lyons says: April 28, 2010 at 3:36 am
……..
Thanks for the links. The crustal field is a (geological) record (frozen in the rocks) record of fluctuations during many millions of years. It is much localised, and due to the polarity reversals, the overall effect over larger area is usually neutralised.
Geomagnetic Field on the global scale is continuously changing and evolving as you can see here:
http://www.vukcevic.talktalk.net/LFC1.htm
for the period 1600-2000.
vukcevic says:
April 28, 2010 at 5:02 am
Safe; http://www.appinsys.com/GlobalWarming/EarthMagneticField.htm
Fig 7 looks like the Siberian temperature record!:
http://www.geomag.bgs.ac.uk/earthmag.html
U.
Some time ago I have compared two North hemisphere Geomagnetic highs with temp records and found decent correlation.
http://www.vukcevic.talktalk.net/LFC18.htm
vukcevic says:
April 28, 2010 at 8:38 am
Interesting work; http://www.vukcevic.talktalk.net/GandF.htm
Got any predictive power of temperature change at {1} a weekly/monthly level,
{2} El Nino forecast (eg. did you predict the current one), and {3} season by
season climatic forecasts for the next 30 years?
Have you done individual monthly trends on CET, and seen the stronger warming
signal at the Equinoxes (stronger than Dec/Jan warming)?
The answer has to be NO to all. As far as CET is concerned there is this:
http://www.vukcevic.talktalk.net/CETt.htm
But this is more based on solar cycle anomalies (shown in green),
which again appear to have some correlation to the Geomagnetic field.
http://www.vukcevic.talktalk.net/LFC9.htm
http://www.vukcevic.talktalk.net/LFC8.htm
Only predictions I made are related to the solar cycles, based on a formula. There is selection of graphs here: http://www.vukcevic.talktalk.net/GandF.htm
” vukcevic says:
April 28, 2010 at 12:24 pm”
Nice, http://www.vukcevic.talktalk.net/CETt.htm can you see the 179yr pattern?
” rbateman says:
April 26, 2010 at 10:09 pm
What the heck is that persistent hot spot off South America (Uruguay/Paraguay) ?”
I am beginning to wonder whether it is to do with 10,000 tons per second of water up to 24 degree C coming out of the River Uruguay, fed by numerous hot springs up river. http://www.idrc.ca/en/ev-58878-201-1-DO_TOPIC.html
===========================================================
Back to El Nino, 200 hPa Zonal wind and 30/50 hPa Zonal (QBO) wind have a way to go before they start to turn +ve. This does not look good for a La Nina or a busy Atlantic tropical storm season. http://www.cpc.ncep.noaa.gov/products/CDB/Tropics/figt3.gif
Ulric Lyons says:
April 28, 2010 at 2:56 pm
Up to 30deg. Centigrade actually;
http://earthobservatory.nasa.gov/IOTD/view.php?id=42270
My opinion: Winter red will be affected in the western part of the US, so will trend down in yield, slightly up in price. Yields will be average in the plains, where the majority is grown anyway. Spring wheat will be down due to late start, frost and snow, short season. Winter red is the preferred bread wheat so it is possible that prices for high end flour and cake flour will rise somewhat.
Grape harvest will be down but the grape quality may be very good. Wine made from red grapes will continue to hold up and may rise in price. Buy previous good years now, since poor current yields will increase the price of previous year wine still in the barrels/bottles at the wineries.
This will be another bad year for corn, oranges, toms, melons, and gourds (IE pumpkins). Peas and other cool season crops should do very well.
“Pamela Gray says:
April 28, 2010 at 5:51 pm
Grape harvest will be down but the grape quality may be very good”
Most European vintage years are about a year or two before solar max.
Erl Happ would agree with that.