By Joseph D’Aleo, CCM ICECAP.US
El Nino is still hanging on but likely not for very long. Warmer than normal water can still be seen along the equator in the tropical Pacific. It is even warmer in the sub-tropical North Atlantic because of the suppressed winter jet stream and subtropical high which meant lighter than normal winds and less clouds.

Signs of the demise of the El Nino are numerous. It is likely given the flip of the PDO which favors shorter El Ninos and stronger, more frequent and lengthy La Ninas that a moderate to strong La Nina is next in the cards this year and next.

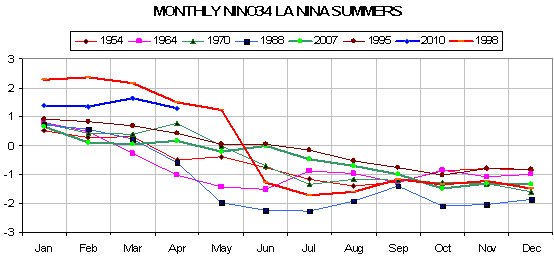
Notice in the temperature anomaly plot for NINO region 34 (region shown on the CDC map below)

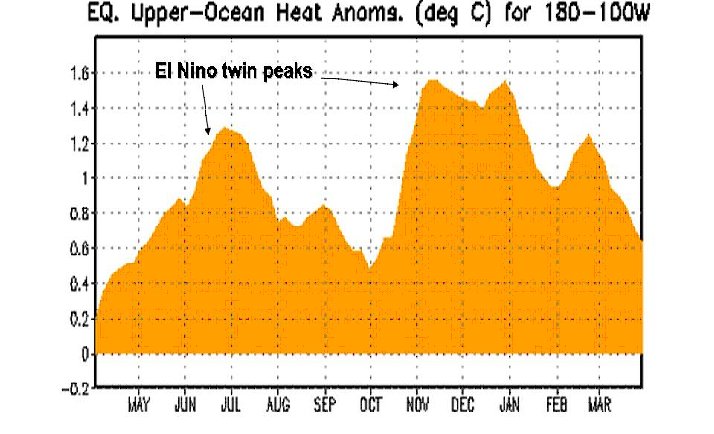
How we are somewhere between 1998’s super El Nino and a cluster of more moderate ones and how they declined quickly by the summer on the graph that follows (enlarged here). Values are given in STD of NINO 34 SSTA.

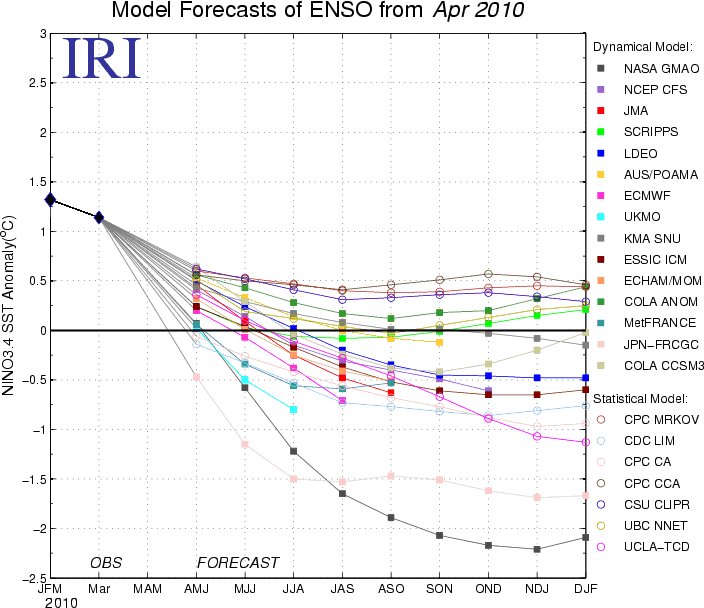
ENSO models, both dynamical (coupled air and ocean models) and statistical suggest a rapid cooling with all models dropping below threshold El Nino levels by summer (JJA – June-July-August) and perhaps half reaching La Nina values by summer or fall.

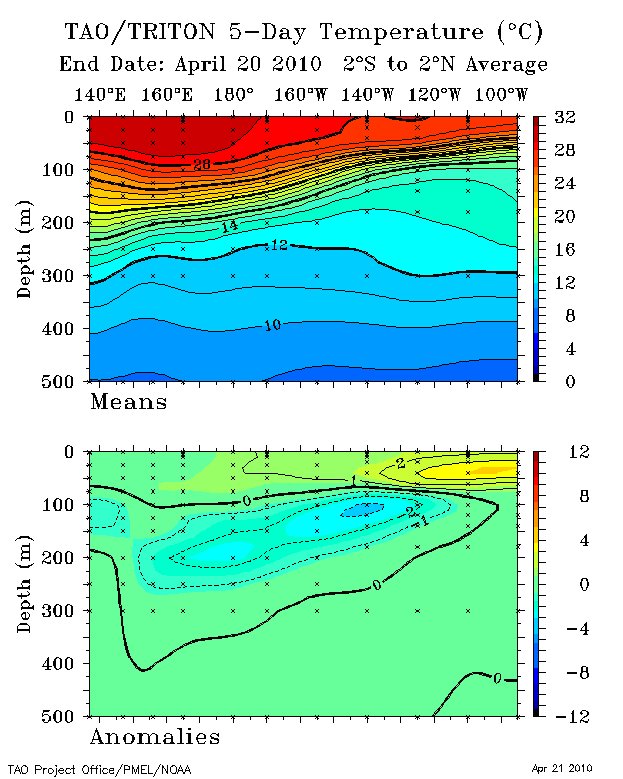
In the depth cross section across the entire tropical Pacific that is built from the TAO-Triton buoy data, we can see the warm water in the eastern top water which was 5C above normal has diminished as the water mixes with cooler surface water and the thermocline is lifted. Notice the developing strong cold pool not unlike that in 1998 at 100 meters across most of the Pacific. Notice the amazing cool down of NINO34 in 1998 from May to June in the multiyear graph above.

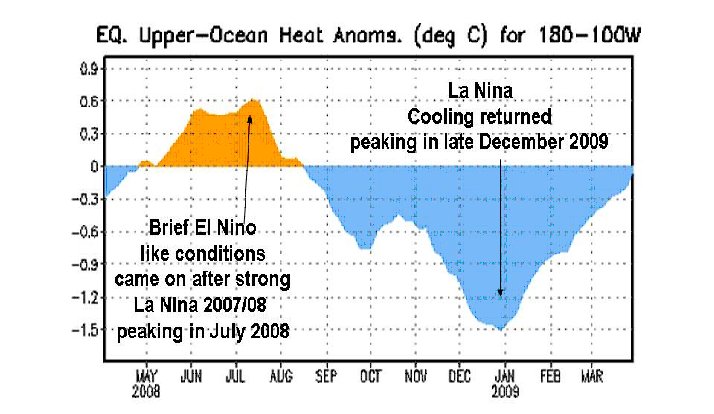
The El Nino followed two years of La Nina with below normal temperatures in NINO34 and in much of the Pacific leading to below normal ocean heat content in the tropical eastern half of the Pacific. A strong La Nina in 2007/08 was followed by a summer rebound then another dip in January.

We can see in the heat content the last year, a peak last summer a fall decline and then a multi peak winter warming fed by westerly wind bursts this past winter, notice the decline as we started April.

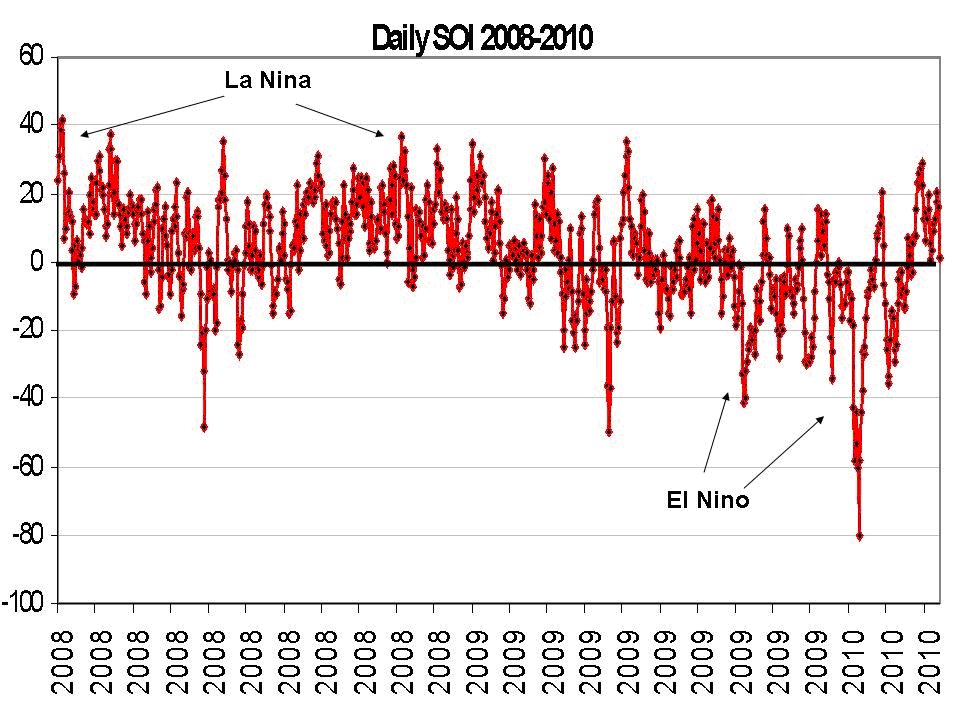
The Southern Oscillation Index which was in positive La Nina territory in 2007/08 and 2008/09 dropped into negative El Nino territory reaching an incredible 8 STS in early 2010. It has rebounded to positive and usually leads the change of ENSO state by a few months given credence to a return of La Nina.

See much more on the possible implications for the summer and following winter (with recognition of the possible influence of the solar and volcano wildcards) here.
Andy… they’ll all be blamed on global warming.
AndyW,
I don’t think the word “hot” is correct for the temps off of Africa, the phrase “large pool of cold” comes to mind.
And Yes, a really hot half decade would make me really happy, I’m moving to Alaska this summer for at least three years and probably more then five, so I want my global warming!!! Al Gore Promised!
The Very Preliminary April SST anomaly data were available today through the NOAA NOMADS website. I presented the preliminary April data here.
http://bobtisdale.blogspot.com/2010/04/very-preliminary-april-2010-sst-anomaly.html
NINO3.4 SST anomalies are down, while global SST anomalies are up.
Regarding the statement in the post, “It is likely given the flip of the PDO which favors shorter El Ninos and stronger, more frequent and lengthy La Ninas,” the PDO is an aftereffect of ENSO
http://i41.tinypic.com/34znfvr.png
It is more likely that the frequency and magnitude of ENSO events caused the “flip of the PDO.” Then again, the other major contributor to the PDO is North Pacific Sea Level Pressure. Refer to:
http://i41.tinypic.com/dng9xz.png
And to the post:
http://bobtisdale.blogspot.com/2010/04/is-difference-between-nino34-sst.html
phlogiston (10:52:47) :
It was supposed to be sarcasm, should have used /sarc flags. I meant to add bracketed NOT at the end but my mobile phone keyboard – Nokia E71 – doesnt have brackets. How many people now think I’m a troll?
Probably no more than usual. 😉
I’m reading the Google cache of an entry in a (former?) blog, a review of the E71. Says the brackets are moved to the Symbol menu however he’s actually talking about the parentheses. Are the square brackets in that Symbol menu?
I’m seeing the Nokia E71 described as a “smartphone.” However if you really want something smart and useful, and want to avoid looking stupid (again?), get a phone that works with a RedFly. Then wonder if you need a netbook/laptop at all.
Paul Vaughan (12:46:24) :
The vast majority of what I am reading suggests that the April’s Icelandic volcano did not send anything high enough to reach the stratosphere and spread over the globe. Essentially, no sulfate aerosol particles are expected.
For example, see
http://www.wunderground.com/blog/JeffMasters/comment.html?entrynum=1462
Caleb (09:12:25) you wrote, “and and the PDO is cooling…”
The PDO does not represent sea surface temperatures of the North Pacific. The North Pacific SST anomalies have declined over the past six months, but that’s the seasonal variation:
http://i42.tinypic.com/2eve0lk.png
Refer also to the next comment also.
And Joe D’Aleo, you wrote, “given the flip of the PDO…” assumedly referring to a change from a positive to a negative PDO.
The PDO has been positive (with the exception of one month) since August of 2009:
http://jisao.washington.edu/pdo/PDO.latest
Douglas Dc – I don’t presume to speak for the Aussies (I don’t want to either but that’s another story!), but NZ’s Summer was all over the place. Auckland and North was sunny sunny sunny for months, drought conditions, while further South the sunshine arrived late and left early.
There’s some interesting El Nino / La nina stuff on these two links (ignore that one is from AGW-loving NIWA!):
http://www.niwa.co.nz/our-science/climate/information-and-resources/clivar/elnino
http://www.pmel.noaa.gov/tao/
PS – Phlogiston – I got the sarc (winks)
All you northern hemisphere people have your seasons reversed. Us southern hemisphere types are generally willing to tolerate your eccentricity. But it annoys us when you persist in referring to December-February as `winter’ even when commenting on southern hemisphere events.
The Nino-Nina events happen in the south pacific (actually equatorial – but definitely more on the south side than the north). If you are going to persist in using seasons to talk about these events then winter must surely mean June-August.
phlogiston,
I caught your sarcasm immediately, and enjoyed it! 😉
mf
Anybody got a well reasoned explanation for the odd-looking hot spot off the east coast of South America?
On same Topic:
http://hidethedecline.eu/pages/posts/the-death-of-global-warming-from-below-176.php
K.R. Frank Lansner
BJ (09:26:20) :
A friend made a similar comment (different subject) on Facebook.
I mentioned that alot of people make that mistake. (Sometimes I’ll tell people that all they have to do is remember an alot is a small, furry animal.)
Richard Sharpe (10:19:02) :
Lamb recanted 4 years later. Perhaps Jones will soon, too..
JP (10:49:07) :
If I recall correctly, Schmidt claims that the hotspot is still there, just that the thermometers don’t see it.. they claim that windshears show that it is there. Apparently wind indicators are better thermometers than thermometers.
vukcevic (11:06:18)
“This may be just a coincidence, alternatively it may point to a relationship between ocean currents and geomagnetic field in the area.”
That is simple enough to be right. Iff:
The small amounts of iron in the oceans are drawn to the magnetic poles, they are small but they are many.
The drag caused by the iron induces the ocean currents that we see.
As the magnetic poles move towards the equator the ocean currents follow the magnetic movement.
When the poles are near the equator we have an ice age because there is no heat moving to the poles, but the net amount of heat is the same as before.
The duration and severity of the cold phase North and South of the tropics would depend on the speed of the magnetic polar movement.
Hmmm.
The typical conception of an El Nino is at the Vernal Equinox at hotter March/April`s, some 9 months before its celebrated arival at Peru around Christmas, with it getting a second uplift at the Autumn Equinox.
http://www.cpc.ncep.noaa.gov/products/analysis_monitoring/ensostuff/ensoyears.shtml
These months of doiminant warming can also be seen in individual monthly trends in CET, or other local temperature series, as when most of the warming such as in the last 30 or 100 years can be seen. Have a look at CET for the linear trend for Feb or May over the last 100yrs, they are as flat as a pancake. The Equinoxes are when the Aurora and solar storms are strongest, and we connect with the solar wind better, giving more warming potential.
Conversely, a cold Feb/Mar/Apr will tend to extinguish the El Nino condition.
I think there is a good chance of current El Nino following the 1968 to 1970 pattern and lasting till next spring.
Rhoda R (13:55:03) :
So global warming is going to send us into an ice age?
That’s why alarmists now refer to it as: “Climate Change”; because it covers all the bases. Even if we enter a long cold period, they’ll blame it on humans.
I should point out the SOI on positive, but that is 30-day mean, if you see monthly mean SOI, it is still in deep negative.
For El Niño observation, NINO3.4 SOI is the key index: both weekly and monthly SOIs are drop now which fit the prediction by NOAA that we will go El Niño neutral this June.
http://www.weatherzone.com.au/climate/indicator_enso.jsp?c=nino34&p=monthly
http://www.weatherzone.com.au/climate/indicator_enso.jsp?c=nino34&p=weekly
Enneagram (13:45:13) :
SOI on positive:
http://www.weatherzone.com.au/climate/indicator_enso.jsp?c=soi
Forget to put the monthly SOI which is still negative:
http://www.weatherzone.com.au/climate/indicator_enso.jsp?c=soi&p=monthly
Re: An Inquirer (14:34:01)
Not very confident in their gross oversimplification of circulation & latitudinal dependency, but thanks much for the constructive leads, which turned up more on ENSO/volcano connections:
http://www.meteo.psu.edu/~mann/shared/research/Adams2003Volcano/Adams2003Volcano.html
http://www.virginia.edu/topnews/releases2003/volcano-nov-19-2003.html
http://www.meteo.psu.edu/~mann/shared/articles/Kerr%282003%29_VolENSO.pdf
Note that WUWT’s good friend Mann has been looking at this. The main SAOT paper has Hansen as a co-author. Seems I’ve got something that might attract funding.
Bob Tisdale,
Thanks for the corrections. I’ll find time to study your work, as I always glean something, every time I snoop about your site.
You’ll have to forgive me if I at times seem guilty of gross over-simplifications. I tend to leap from subject to subject, trying to gain an overview of the many factors involved in “forcing” the climate this way and that way.
I think you are not guilty of leaping from subject to subject, but rather are doing great work by focusing on ENSO, as a central theme. In many ways I think your observations have a power lots of theory lacks, as yours are observations founded on the bedrock of truth. Truth is always the best teacher.
As I leap from subject to subject I am less certain than you seem to be that the ENSO is the “driver.” At times, especially in 1998, I think it is the “driver,” but other times I think it gets a bit flabby and is more able to be listed among the “driven.”
As an aside, you might be interested (or at least amused) to know my personal measurement of the negative PDO involves no crunching of negative or positive numbers. Instead I look for its signature on the surface temperature anomaly maps of the north Pacific. It’s signature is the letter “C,” backwards and in blue. Although the blue has grown fainter, and even a bit spotty, that “C” has remained even though the PDO has been in statistically positive territory in recent months. Now that “C” is growing stronger.
Therefore two things are obvious. The first is that I am allergic to numbers, and avoid them whenever possible. And the second is that the “negative” PDO may involve a switch in the oceanic set-up, more than mere numbers.
Just an observation. And thanks again for yours.
Great. Cold and dry. No pasture past October and my sewer freezes again. Just great. It takes a lot of cold to freeze a ranch sewer system. Just freakin great.
Douglas I am totally with you on that one. Short season, cold winter. And on the side, I invite you and yours to a Friday night tavern experience at the LT in Lostine. Would love to have your company and introduce you both to the locals. Ya’ll are welcome.
phlogiston (08:45:07) :
“Looking good for a hottest on record 2010.”
Ironic kook is ironic.
One sits with bated breath waiting for the kook korps to issue corrected adjusted modified altered amended edited temperature records to reflect the errors at Eureka Nunavut.