By Joseph D’Aleo, CCM ICECAP.US
El Nino is still hanging on but likely not for very long. Warmer than normal water can still be seen along the equator in the tropical Pacific. It is even warmer in the sub-tropical North Atlantic because of the suppressed winter jet stream and subtropical high which meant lighter than normal winds and less clouds.

Signs of the demise of the El Nino are numerous. It is likely given the flip of the PDO which favors shorter El Ninos and stronger, more frequent and lengthy La Ninas that a moderate to strong La Nina is next in the cards this year and next.

Notice in the temperature anomaly plot for NINO region 34 (region shown on the CDC map below)

How we are somewhere between 1998’s super El Nino and a cluster of more moderate ones and how they declined quickly by the summer on the graph that follows (enlarged here). Values are given in STD of NINO 34 SSTA.
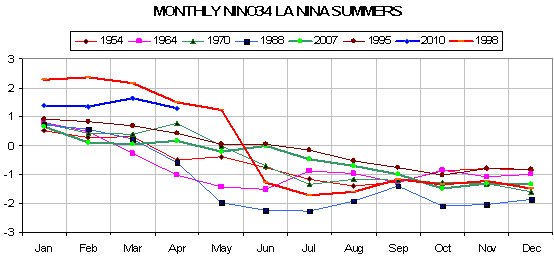

ENSO models, both dynamical (coupled air and ocean models) and statistical suggest a rapid cooling with all models dropping below threshold El Nino levels by summer (JJA – June-July-August) and perhaps half reaching La Nina values by summer or fall.
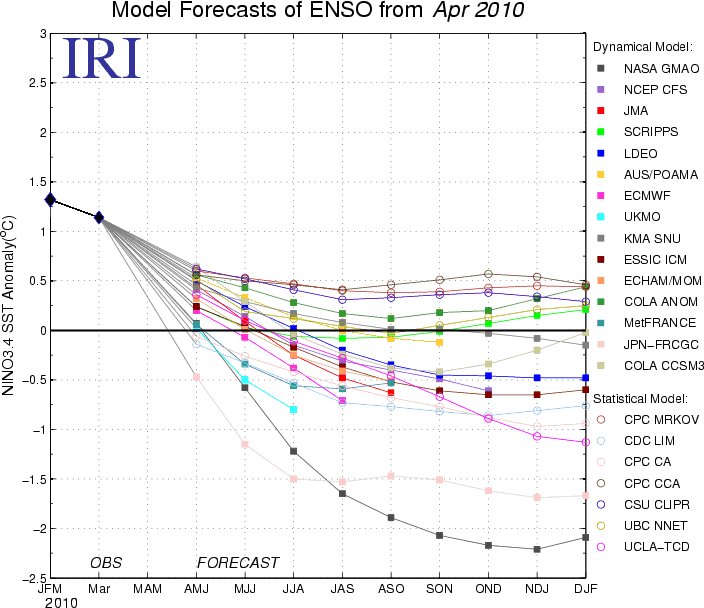

In the depth cross section across the entire tropical Pacific that is built from the TAO-Triton buoy data, we can see the warm water in the eastern top water which was 5C above normal has diminished as the water mixes with cooler surface water and the thermocline is lifted. Notice the developing strong cold pool not unlike that in 1998 at 100 meters across most of the Pacific. Notice the amazing cool down of NINO34 in 1998 from May to June in the multiyear graph above.
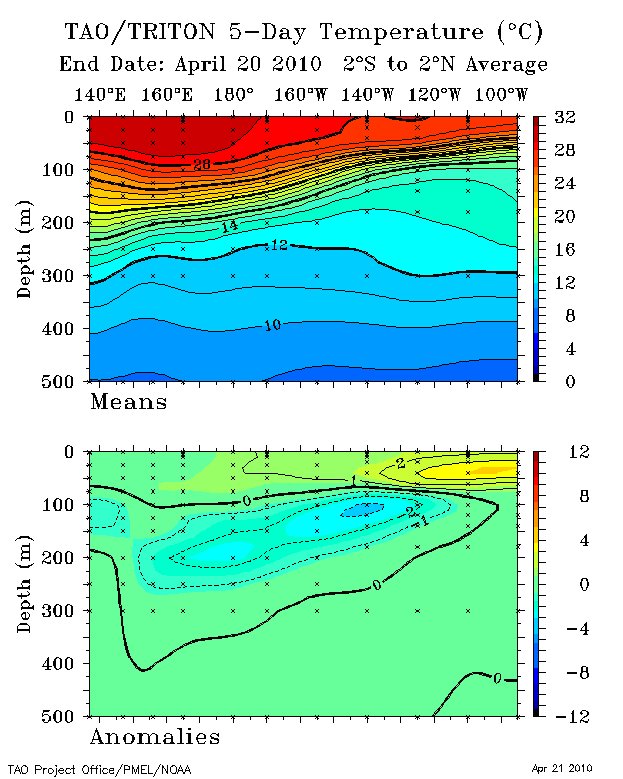

The El Nino followed two years of La Nina with below normal temperatures in NINO34 and in much of the Pacific leading to below normal ocean heat content in the tropical eastern half of the Pacific. A strong La Nina in 2007/08 was followed by a summer rebound then another dip in January.
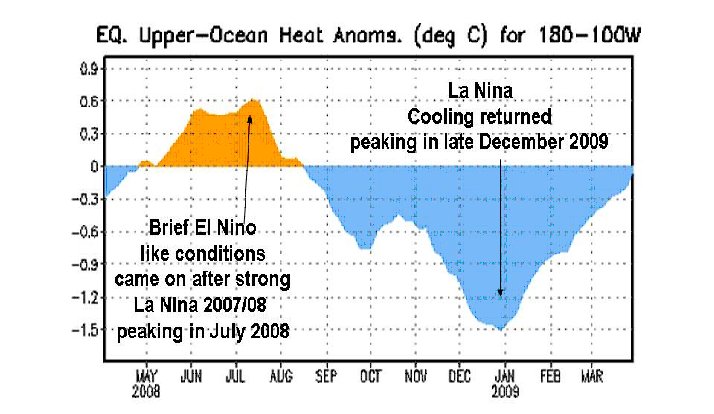

We can see in the heat content the last year, a peak last summer a fall decline and then a multi peak winter warming fed by westerly wind bursts this past winter, notice the decline as we started April.
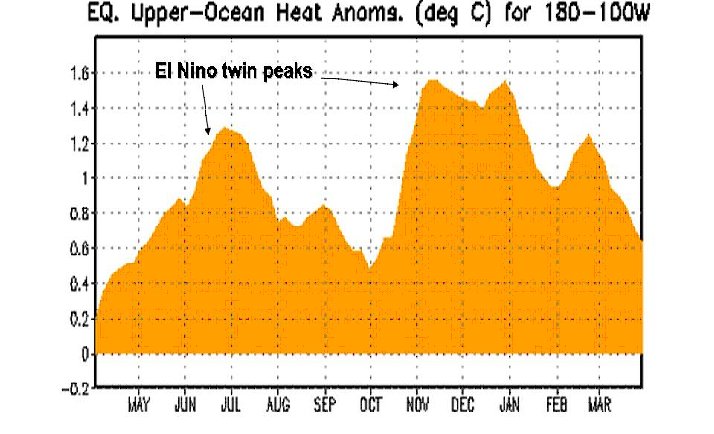

The Southern Oscillation Index which was in positive La Nina territory in 2007/08 and 2008/09 dropped into negative El Nino territory reaching an incredible 8 STS in early 2010. It has rebounded to positive and usually leads the change of ENSO state by a few months given credence to a return of La Nina.
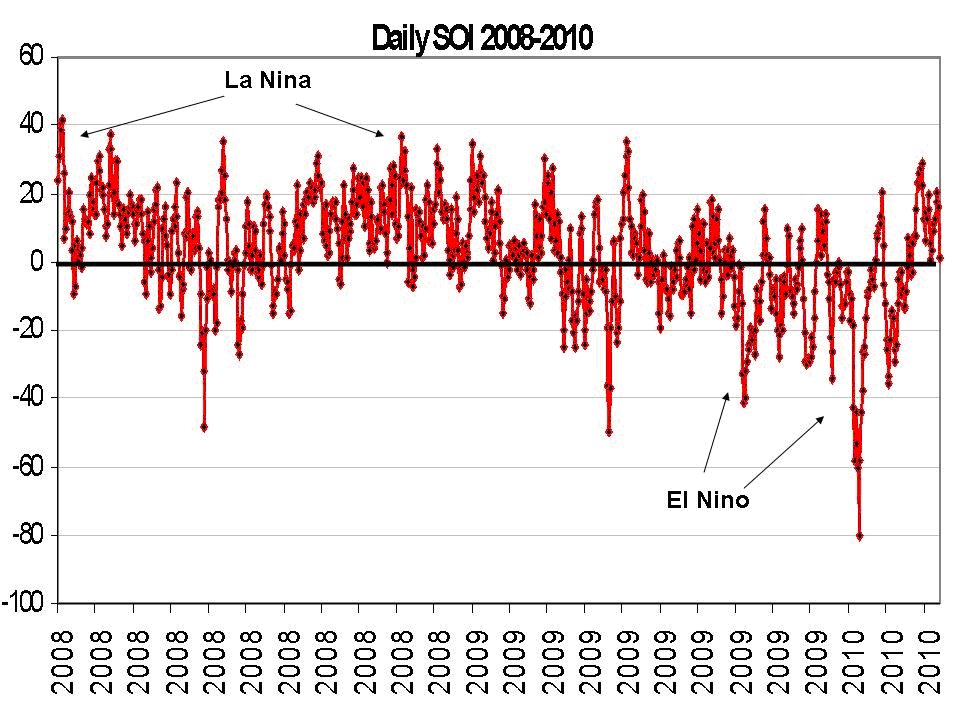

See much more on the possible implications for the summer and following winter (with recognition of the possible influence of the solar and volcano wildcards) here.
I don’t understand much of this, but it sounds to me as if it support Svensmark’s theories about how the intensity of cosmic rays influence cloud formation based on variation of the sun’s magnetic field.
Quote Enneagram (08:34:47) :
Quiet Sun, SSN=0 for 11 days in a row, low speed “solar “wind”” and if we read:
INFLUENCE OF SOLAR WIND ON THE GLOBAL ELECTRIC
CIRCUIT, AND INFERRED EFFECTS ON CLOUD MICROPHYSICS,
TEMPERATURE, AND DYNAMICS IN THE TROPOSPHERE
BRIAN A. TINSLEY
Discussion and Conclusions
Of the three inputs into the global electric circuit that are modulated by the solar wind, two of them do not involve cosmic rays or other particles that are energetic enough to penetrate to cloud levels and directly affect clouds. But all three inputs cause Jz variations that extend all the way down to the surface. So we have concluded that in all three cases it is most likely that Jz variations are causing changes in cloud microphysics that then produce correlated changes in weather and climate.
http://www.utdallas.edu/physics/pdf/Tin_rev.pdf Unquote
Ref – Enneagram (08:34:47):
__________________
The Sun is merely like a catalyst that doesn’t really do anything regarding the weather except kinda keep it going; the Sun dosen’t “change” and it’s all the fault of the Earth’s tilt and orbit that makes everything toppsyturvy, kaddiwampus and variable.
I know how you feel, it was hard for me to believe too.
PS: Planets have no impact whatsoever. They’re too small and don’t have a negative charge like electrons (I think;-)
“Looking good for a hottest on record 2010.”
I disagree. While 2010 is currently leading 1998 throught March, the Super El Nino in ’98 held on far longer than this one is. April ’10 should come in WELL under April ’98 and propel 1998 back into the lead. I expect at a minimum weak La Nina conditions by Thanksgiving. This should take us even further away from 1998.
When it’s done, I think 2010 will be a top 10 year, perhaps even top 5. But 1998 should likely keep it reign as the warmest year on record. Again…
Is this what they meant by “new ice age scares” confined to newspaper stories?
http://bishophill.squarespace.com/blog/2010/4/26/hubert-lamb-on-ice-ages.html
From Bishop Hill. That is the Hubert Lamb who was director of the CRU.
Henry chance (09:02:24) :
“I can clearly see the hotspot next to Iceland that caused the heat/melting and volcano recently.”
Run the “potential temperature” N.H Tropopause animation on here;
http://www.pa.op.dlr.de/arctic/index.html
After crossing Iceland, you can see it heading towards Scotland where it was 17deg. for a couple of days, much warmer than the south UK. I have established a clear relationship between temperature rises and new eruptions, but it is very interesting to witness the precise local conditions to the day.
The GISS temperature for Jan, Feb, and Mar are at record highs (70, 73 & 81). The coming La Nina will have to be as severe as the one that followed 1998 to offset those numbers. The odds offered on Intrade.com the “2010= hottest year?” bet (75%) therefore reflect confidence in an insurmountable lead. (I’ve bet the other way.) We shall see.
Judging by how sensitive ENSO was to last March/April and the end of June heat wave, I reckon this El Nino has more time yet. You can see it respond to the recent stronger solar signal here; http://www.cpc.ncep.noaa.gov/products/analysis_monitoring/enso_update/sstanim.shtml
My forecast for May is above average temperatures, and a heat wave starting around June 12th.
“Looking good for a hottest on record 2010.”
Phlogiston,
I stopped paying attention to our surface records (or more appropriatly – reonstructions) many years ago. However, there is an AGW metric that the IPCC says should be quite pronounced -tropical mid-tropespheric temperatures. The so-called tropical hotspot has failed to materialize. I think Gavin Schmit at RC a year or so complained that this feature never materialized (much to his befuddlement).
So, if 2010 turns out to be a record hot year (whatever that means) it isn’t due to Greenhouse Gases. The Tropical tropesphere has failed to warm.
It was supposed to be sarcasm, should have used /sarc flags. I meant to add bracketed NOT at the end but my mobile phone keyboard – Nokia E71 – doesnt have brackets. How many people now think I’m a troll?
Mr. D’Aleo
The South Atlantic magnetic anomaly is moving into Pacific. This movement can be tracked by locating the crossing of the magnetic (Z-component) and geographic equators.
The equatorial crossing has moved east-wards during the last four centuries with a trend reminiscent of the global temperature trend for the period.
http://www.vukcevic.talktalk.net/LFC19.htm
This may be just a coincidence, alternatively it may point to a relationship between ocean currents and geomagnetic field in the area. This is an area of increased flux of energetic particles; the SAA is the Earth region where the Earth’s magnetic field is weakest.
http://www.vukcevic.talktalk.net/GandF.htm
This forecast doesn’t bode well for the climate scientology team out there . . . after all how can the scare the crap out of people, blackmail truckloads of research money out of politicians and take lovely tax payer funded trips to Bali if Mother Nature refuses to validate the scary scenario.
Time to short sell climate scientology and go long on the next great eco scare campaign.
I’m betting they’ll try and frame either oxygen or water as the next great eco culprit.
Deanster: I think I would trust AMSU 100%. The El Nino always causes a rise in temps, but its about to collapse so like 2010 will not be the warmest on record probably 2 or 3rd maybe. Next year could easily be one of the coolest, if La Nina kicks in though. R Spencer did post something last month about a single hotspot being responsible for the high gobal Feb March temps I believe….
I love following and rooting for the consequences of the extended solar minimum. I enjoy seeing the states and municipalities that used up all their snow removal funds and will probably need to increase those budgets for the next winter. I enjoy reading about the crop failures all the way down to Florida’s decimated orange, tomato, and other crops. The only reason I enjoy reading about the death toll of people and Manatees due to the extra cold winters is because, I know corrupted people will only be able to snap out of their delusional belief in the fraud of man-made global warming, is by inflicting so much natural pain on them from the magnificent solar minimum till they cry uncle.
I wouldn’t believe it if I hadn’t seen it with my own eyes. There is a winter storm warning for Vermont and Upstate New York for 6-12 inches of snow. Here in Stowe Vt that means 12 inches or more.
http://weather.unisys.com/surface/sst_anom.html
Doesn’t look like the watery part of earth’s surface should show a positive anomaly this month to me. If Dr. Roy Spencer comes up with another hottest month outcome I for one will have little faith in the peculiar machinations that produce his series.
Tenuc:
I suspect that if the Arctic Oscillation stays as it is then the consequence for the UK will be a long hot summer, as the blocking high we are experiencing now, and which contributed to our freezing winter, will hang about for most of the season.
I would really look forward to such a BBQ summer, except for the smug nagging of the AGW brigade, and the hose-pipe bans and ‘drought’ warnings of the water companies and their government lackeys.
I have been keeping a close eye on the “boys and girls” and sunspots for about 30 years now. Short term climate has a big influence on commodity prices and skiing conditions in Alberta. I have had some good success and some not so good, in trying to predict even 6 to 12 months. Now I know why. It’s those damn wild-cards and plus 30 year cycles. Back to the “size of the white man’s wood pile”, I guess. Damn again, we all switched to natural gas didn’t we.
Sonicfrog (08:16:01) “I’m curious to see if temp anomalies will drop with the combo of the recent volcano and the death of El Nino.”
I’m still waiting for a report on whether the recent Icelandic volcanic eruption has impacted SAOT (stratospheric aerosol optical thickness).
Lot’s of eruptions don’t:
http://www.sfu.ca/~plv/SAOT,DVI,VEI,MSI_SOI,L90,SOI+L90.png
http://www.sfu.ca/~plv/SAOT_Lunar_aa_SOI.png
[ Definition of terms here: http://www.sfu.ca/~plv/VolcanoStratosphereSLAM.htm ]
Note that one of the factors influencing impact is circulation – (hardly a surprise, but I’ve never seen these results anywhere.)
Clusters of major eruptions coinciding with decades of primarily La Nina seem to miss the persistence that stems from stratospheric residence time. No wonder studies that look at only 2 variables at a time (simple linear amplitude correlation) arrive at misleading conclusions; multivariate conditional dependence is key.
Hear, hear:
Caleb (09:12:25) “It’s a pity politics has everyone so worked up, because it would be nice to just admit how little we know, and to just sit back and observe, and learn.
Folks I deal with claim that such behavior, while sensible, would be “unprofessional”. (clarification: I’m quoting them, not agreeing with them.)
FWIW I actually think its going to be bloody cold by the end of the year.
I agree with others such as Caleb who have said here and elsewhere that this el Nino will end with a sharp drop to cooler temperatures. Like the 1998 one and all el Nino’s I have seen. When did an El Nino end in an elevated plateau? Its always a symetrical spike, up then down. Thus the article by Joseph D’Aleo about the incipient La Nina made it all the more clear that this drop is well underway.
This explains my attempt at sarcasm which clearly failed abjectly.
No El Nino and hot temps off the west coast of Africa .. sounds like a high ACE this year then. Wonder how many cat 5 hurricanes there will be.
Andy
vukcevic (11:06:18) : That is amazing! If you see there have been four low depth earthquakes, from 5.1 to 5.7 Richter, in the last five days, in the Sandwich islands region. (57°S, 26°W). That “moving red shadow” also reaches the chilean city of Concepcion, where there was a big 8.9 earthquake last february 27th. and one of 5.9 Richter on april 23rd.
maggieblanco (11:08:18) “Time to short sell climate scientology and go long on the next great eco scare campaign.”
Bets are already being hedged to cover all the bases — see the last paragraph here:
http://www.telegraph.co.uk/science/dinosaurs/7624014/Dinosaurs-died-from-sudden-temperature-drop-not-comet-strike-scientists-claim.html
“The drop in temperature is thought to have occurred because high levels of CO2 were in the atmosphere which caused global temperatures to rise and polar ice to melt – a phenomenon currently predicted for Earth.”
RE: ACE and hurricane activity, the most analogous year to this one is…..2005!
All that heat in the Atlantic plus the weak Azores hi plus the weakening El Nino tends to show lots of cyclonic activity is on the way.
See Hurricanetrack.com for lots of good info.
SOI on positive:
http://www.weatherzone.com.au/climate/indicator_enso.jsp?c=soi