
Guest Post by Steven Goddard
Steve McIntyre points out that NOAA’s Susan Solomon saw fit to exclude a statement of measurements from IPCC WG1. With such certainty then, it’s no wonder she’s certain that our current situation is “irreversible”. Well then, let’s not worry about it if one of NOAA’s lead scientists says the effects are well nigh irreversible. What she’s serving up is pure alarmism.
NOAA has issued a warning to the occupants of (some) planet :
Global warming has reached the point of no return, a study published in the Tuesday edition of the Proceedings of the National Academy of Sciences by a joint team of the U.S., French and Swiss researchers concludes. Even if the world reduces emissions of CO2 to the level before the industrial revolution, it will take at least 1,000 years to reverse the climate change effect that have already taken hold, AP on Sunday quoted the team as saying. Dr. Susan Solomon of the U.S. National Oceanic and Atmospheric Administration’s Earth System Research laboratory led the study. “People have imagined that if we stopped emitting carbon dioxide the climate would go back to normal in 100 years, 200 years; that’s not true,” she said, adding the effects are well nigh irreversible.
That got me wondering what she meant by “back to normal.” Perhaps it means sea ice at normal levels? No that can’t be it, because sea ice area has already recovered to “normal.”![]()

http://arctic-roos.org/observations/satellite-data/sea-ice/observation_images/ssmi1_ice_area.png
Perhaps she means violent weather, like strong tornadoes? Longing for a return to the 1970s, when there were lots more of them?

http://lwf.ncdc.noaa.gov/img/climate/research/tornado/tornadotrend.jpg
In 1908, a hurricane formed on March 6, the earliest on record. Ah, for the good old days of early spring hurricanes…..
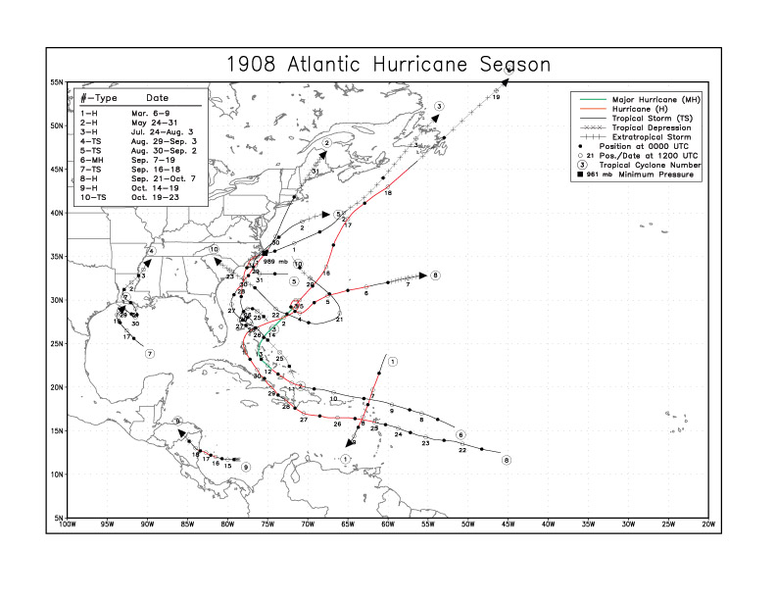
http://en.wikipedia.org/wiki/File:1908_Atlantic_hurricane_season_map.png
In 1954, Hurricane Alice formed on December 30, the latest on record. Nothing like a New Year’s hurricane to brighten up the holidays.

http://en.wikipedia.org/wiki/File:1954_Atlantic_hurricane_season_map.png
In 1961, Hurricane Carla made landfall in Texas. It was the most intense hurricane to ever hit the US.

http://en.wikipedia.org/wiki/Hurricane_Carla
In 1900, a hurricane killed 8.000 people in Galveston, Texas.

http://en.wikipedia.org/wiki/Galveston_Hurricane
In 1780, a hurricane killed more than 27,500 people in the Carribean.

http://en.wikipedia.org/wiki/Great_Hurricane_of_1780
In 1960, 60% of the farmland in China received no rain. Somewhere between 20 and 43 million people died due to extreme weather and mismanagement by the socialist government.
In the 1930s, the US suffered extreme heat and drought, resulting in the dust bowl. It was the warmest decade on record in the US (at least before USHCN cleverly adjusted it downwards.)

http://www.giss.nasa.gov/research/briefs/hansen_07/fig1x.gif

http://en.wikipedia.org/wiki/Dust_bowl
jeff brown (06:50:38) :
“As for the null hypothesis, how about you try to prove the null hypothesis that humans are not in part responsible for the warming observed today. Can you do that?”
I doubt whether any scientist who knows what he is doing nowadays attempts to “prove” a hypothesis.
“And that gets to a more fundamental question I’ve always had, do you not think going from 1 billion to nearly 7 billion people on this planet in 150 years has not had some sort of environmental impact? Look at how much the surface of the planet has changed. What if you went from 1 to 7 billion elephants, do you think you would see an environmental impact? To think humans are not affecting this planet is very naiive.”
I understand your concern and commitment. Actually I suspect many contributors to this site care very much about environmental issues, overpopulation, the use of irreplaceable resources and the future of the planet. However, they make a distinction between these important points and the question of climate changes and their causes.
Fred H. Haynie (11:11:58) :
Fred, statistics such CO2 and sea ice extent correlating does not say sea ice extent causes CO2 variability, nor does it say that CO2 variability causes sea ice extent variability. And scientists wouldn’t get very far if they base their conclusions on the climate system using such elementary evaluations. Earlier someone quoted the Ogi et al. paper on winds affecting the ice cover. They state a 30% correlation between winds and summer ice extent. Well, another correlation between 925 mbar air temperatures and summer sea ice extent explain the other 70%. So should that mean 70% is due to air and 30% is due to wind? Of course not. Statistics never have and never will show causality!! They may highlight linkages to be investigated with physical models, but that is it.
If knew how to attach a PDF here, I would share with you my results that address the climate system and where the key uncertainties actually lie in the field.
But since I don’t know if this site makes that option available, I will say that if you read the scientific journals on the subject, you will find that attribution of changes observed today require the inclusion of anthropogenic causes. Natural forcings alone have been insufficient to explain the observed changes. I will repeat: Only when you include anthropogenic effects can you adequately account for the observed record of temperature changes.
What is more interesting to me, is the question of how much the Earth will warm in the future given the fact that humans are going to continue to put more GHGs into the atmosphere (which will warm the atmosphere further, and allow the atmosphere to hold more water vapor which has been shown in a 2008 study by Climatic Dynamics to be the main cause (water vapor that is) for the increases observed in land surface temperatures).
To know how much the Earth will warm in the future then requires detailed assessments of all the uncertainties in predictions. There have been a number of studies looking into the radiative effect of different forcings, including GHGs, aerosols, water vapor, solar irradiance, surface albedo changes from land use, volcanic eruptions, etc. There remains a lot of uncertainties in many of these, and some simply are not known. So the real issue is not whether or not the planet is warming, or whether or not GHGs cause warming (if you trap a bunch of GHGs in an atmosphere, they will cause warming…that is elementary physics and radiative transfer), but how all the feedbacks will manifest and what sort of self-regulating responses may kick in (such as more clouds in locations where clouds may cause a cooling, more snow fall, etc.).
Consider the energy balance equation for the global mean surface temperature dT:
cpdT(t)/dt = F(t) – ldT(t) – phi(Kv)
where cpdT(t)/dt = the change in global mean heat content
F(t) = future forcings
lT(t) = Net feedbaks, l=1/S
phi(Kv) = flux of heat into deep ocean
This is a good framework for organizing where the uncertatiny exists.
However in practice for state-of-the art models, each uncertainty is an aggregate quantity and cannot be identified with any one specific model component of process.
Play around with this for a while and see what you get.
George E. Smith (10:54:15) :
George, I know all about orbital variations and their affects on the incoming solar distribution on Earth and how this affects our temperatures. What I am saying is that trends in solar variability over the modern observational record (not paleoclimate records) indicate that the sun’s variability explains less than 10% of the observed warming. And there are some scientists arguing that solar variability such as seen during the 11-year cycle really have no effect. There are two camps right now in solar physics as to the temperature effects of the solar variability (not the Earth’s orbital variations–they are two separate things since the sun’s variability more or less stays the same even as the Earths orbit changes).
BTW…here’s a study you may be interested in reading (Compo et al., 2008 in Climate Dynamics). In fact I think you’ll like it.
I include the abstract below:
Evidence is presented that the recent worldwide land warming has occurred largely in response to a worldwide warming of the oceans rather than as a direct response to increasing greenhouse gases (GHGs) over land. Atmospheric model simulations of the last half-century with prescribed observed ocean temperature changes, but without prescribed GHG changes, account for most of the land warming. The oceanic influence has occurred through hydrodynamic-radiative teleconnections, primarily by moistening and warming the air over land and increasing the downward longwave radiation at the surface. The oceans may themselves have warmed from a combination of natural and anthropogenic influences.
One of the strongest indicators of man-made global warming is a warming lower atmosphere (troposphere) and a cooling upper atmosphere (stratosphere). Greenhouse gas emissions are very effective at trapping the outgoing IR radiation. As these greenhouse gases increase, more heat will be trapped in the troposphere which means there will be less incoming heat into the stratosphere above. Furthermore, the greenhouse gases in the stratosphere will still be very effective at emitting their heat into the regions above. The net effect is that the stratosphere will be emitting more heat upward than it receives from below resulting in a cooler stratosphere.
For more information see: http://www2.sunysuffolk.edu/mandias/global_warming/greenhouse_gases.html#stratospheric_cooling
Fred H. Haynie (11:11:58),
Fred, I didn’t see your email, but I would like to email so please post it if possible, thanks
jeff brown (16:38:57),
First, let me thank you for your singular efforts in ratcheting up the hit counts for WUWT. I don’t know how you have the time to sleep. You haven’t convinced anyone, but keep it up! Anthony wants us to stay #1.
And before I move on to the deconstruction, I noticed on another site that a statistician has debunked Scott Mandia, showing there is no statistical evidence that CO2 causes global warming. But I digress.
[Note: you can link to a pdf file, no problem. So that’s out of the way. Do it like Fred Haynie did.]
Next, you state:
This is where your argument fails.
You are engaging in an argumentum ad ignorantiam: the fallacy of assuming that something is true, simply because it hasn’t been proven false.
Just because you are unable to explain global warming, that does not ipso facto mean that the cause must be anthropogenic, as you state.
As a matter of fact, natural climate variability has been within certain defined parameters during the past ten thousand years [or any time scale, for that matter], and today’s climate is well within those parameters. Human emissions are not needed to explain the climate, and by stating that our emissions are the only possible explanation – simply because you can’t think of another one – renders your argument pretty much a desperate attempt to rescue your ad hoc cause.
You don’t know the sum total of climate forcings, or their respective impacts, or even which is the most important. The most knowledgeable climate scientists readily admit they don’t have all those answers, so you’re already going down the wrong fork in the road by insisting that you know the central cause. However, one thing is becoming very clear: CO2 is, at most, a minor player.
It is clear that your presumption is that temperatures can only be headed higher. Maybe, and maybe not. But you state categorically that the planet will continue warming, and that the cause is absolutely human emissions.
Since your mind is already made up, you’re trying to convince the unconverted here to your religion of CAGW. This is seen in the gradual slide from the original, evil “carbon” as the cause of runaway global warming – what Fred Haynie was responding to – to other GHGs. One way or another, you are determined to place the blame for the planet’s natural climate fluctuations on human activity.
So it is up to you to show us convincingly, by testable, reproducible, empirical measurements and methods, transparent to all scientists, that you are right. Remember that neither models nor opinions are empirical measurements. So far, you have been thoroughly unconvincing, except to yourself.
You also conflated a rising population with the question of CO2 causing global warming, so why not move the goal posts once again? You are convinced that the cause must be human. First it was global cooling, then global warming, then anthropogenic global warming, then catastrophic AGW caused by CO2 emissions, and now the cause has once more moved just out of reach. What you can’t seem to understand is that CAGW is a financial play, not a climate crisis. The climate is very benign now, despite a one-third increase in CO2.
When you understand what Prof Richard Feynman meant by cargo cult science, and that even proponents of a hypothesis must bend over backwards to falsify their own hypothesis, you will see that what you’re arguing isn’t science at all. It is only a belief system.
Jeff Brown,
I agree with you about the miss use of statistics and I mentioned that in my introduction. If you Google “Fred H. Haynie” you can find some of my publications, one of which is on the use of statistics in research. That paper has been published three times as a chapter in a handbook. Statistics is a tool that can be used to estimate the probability that some physical process is occuring and it should not be used to average out such effects. I know a good bit about physical and chemical processes and have published that knowledge in a variety of peer reviewed journals. I have done a lot of reviews for journals and was on the editorial board for one.
You can find my e-mail address near the bottom of the home page of my website. http://www. kidswincom.net. I will gladly review your work and I welcome reviews of my work by anyone who wishes to spend some time to find the truth about AGW.
jeff brown (16:44:58) :
Heat is not trapped. On average, the amount of LW radiation leaving the atmosphere is equal to the amount of SW absorbed. That is the first law of thermodynamics.
Smokey (18:30:23) :
you continue to go back to your same point that something isn’t true simply because it hasn’t been proven false. Actually that’s the how mathematical theory and physics have worked for eons. I always found that interesting in my engineering education, something was true until someone later came along and proved it false.
There are a number of attribution papers out there and I’ve pointed you to a few yet you seem reluctant to read those. Why not read those and dissect what is wrong with their studies? perhaps even do the analysis yourself so you can prove to yourself and others why those studies have reached the wrong conclusions? Why not go back and redo some of Lindzen’s work, others have and found they could not replicate his work. Spend the same amount of energy dissecting both sides of the issue so that you can build a solid foundation.
Climate scientists have built a house of evidence supporting their conclusions that the warming observed today cannot be explained without including the observed record of atmospheric GHGs. Yet you continue to throw rocks at it. Why not build your own house of evidence that GHGs could in no way at all be responsible for any of the warming?
I am confused as to what you actually believe since the message seems conflated in your posts. But I do get that many on this site believe the Earth has warmed over the last 150 years and that atmospheric GHGs have also increased over this time-period, and some, such as Steve Goddard who you respect also state that temperature varies linearly with GHGs. What is uncertain is how the system will respond in the future, what sort of feedbacks will help to regulate so the Earth doesn’t warm to the point where you can call it dangerous, etc. And on that subject I am in agreement, we don’t know. But that doesn’t mean I don’t believe we shouldn’t try to better understand the system so that we can know.
Finally, I think everyone needs to be careful with statistics on both sides of the debate. I’ll give an example. Lot of a people are interested in predicting what will happen to the Arctic sea ice cover since it has important implications for oil and gas exploration and other marine activities in the Arctic. The amount of first-year ice in spring correlates very strongly (above 0.8) with the amount of ice left over in September. So on that basis, one could have assumed that 2008 would have seen less ice than 2007 since there was so much more first-year ice in spring in 2008. Yet when you detrend the data, you don’t have this strong correlation. It seems that summer circulation remains important in the evolution of the summer ice cover, which limits predictability. It’s like taking the plot of CO2 and sea ice extent and saying they are related to each other w/o first removing the seasonal cycle or the trend. It’s the actual physics of the system that matters. Furthermore, predictions based on historical conditions may also not work as the ice thins because the physics of the system actually change.
Another example, SVD analysis between sea ice concentration and snow cover over land show strong correlations between the two fields. Does that mean more autumn snow over Siberia is expected when there is more open water in September? Theoretically you would think it’s possible, more open water means more latent and sensible heat transfer from the ocean to the atmosphere and more atmospheric precipitable water. And in fact if you download the NCEP Reanalysis fields, that is exactly what you find. Well, if you apply a cyclone tracking algorithm to the SLP and air temperature fields you find that the location of the cyclone associated precipitation is actually strongest in the Barents and Kara Seas, not over the regions where the sea ice shows the strongest trends, and is a result of lowering SLP fostering more frequent and more intense cyclones.
It’s very easy to show correlation between two variables, it’s another thing to prove the physical mechanisms behind that correlation. And that is what science is trying to do.
“”” jeff brown (16:38:57) :
George E. Smith (10:54:15) :
George, I know all about orbital variations and their affects on the incoming solar distribution on Earth and how this affects our temperatures. What I am saying is that trends in solar variability over the modern observational record (not paleoclimate records) indicate that the sun’s variability explains less than 10% of the observed warming. “””
Jeff, you seem to be entirely missing the point I was evidently missing being able to make; and you missed it again abover.
“”” indicate that the sun’s variability explains less than 10% of the observed warming. “””….””””” the sun’s variability “””””
See those wrods; “the sun’s variability”
The sun is “variable” in MANY different ways; and I don’t mean earth’s orbit variability.
TSI is one source of “the sun’s variability”, the solar magnetic field is another source of “the sun’s variability”. The “shock wave” attending the sun’st ravels, is another.
BUT just one of those sources of “the sun’s variability” namely TSI, is by itslef capable of explaining 10% of the about 0.72 deg C recent warming.
so all of those other sun-earth connections BESIDES orbital changes may be contributing to the remaining 90% of the natural variability. Svensmark’s hypothesisi of a cosmic ray/cloud modulation effect is one such possible phenomenon.
You kept saying the sun’s variability accounted for 10% instead of the sun’s TSI variability can account for 10%; all by itself. That was my entire point.
“”” jeff brown (17:52:23) :
George, with all due respect, how are anomalies a new language? It is simply a deviation from the mean. And why is forcings a new unit? It is something that causes a system to change, it has no units. It’s like when a body of motion stays in that trajectory until a force causes it to change. And how is climate sensitivity a unit? “””
Well as to your last question Jeff; you asked the question; the same one I have been asking for ages.
Numerous publications from IPCC reports, to Mann, Algore and so on, have stated that “Climate Sensitivity” is DEFINED as the change in the earth mean surface Temperature that results from a 2:1 change in the atmospheric abundance of CO2.
I’m told the concept was invented or first defined by Dr Steven Schneider at Stanford; but I have yet been able to locate his original defining paper.
Now if that is not a “Unit”, then I don’t know what a unit is. The IPCC asserts that its value (the size of that Unit) is about 3.0 deg C per doubling of CO2; well avidently +/- 50%, so it ranges from 1.5 deg C per doubling to 4.5 deg C per doubling; thereby establishing the mandatory 3:1 fudge factor that pervades all climate science.
So let’s consider the Physics behind “Climate Sensitivity”. 1/ The earth surface radiates LWIR approximately like a black body; with a radiant emittance that varies with surface Temperature according to the Stefan-Boltzmann relationship; E = sigma. T^4 Watts/m^2. Well, it seems that we have uncovereed a “forcing”. Well except that this one varies by about 11:1 over the full range of earth surface temperatures.
2/ The CO2 molecules in the lower atmosphere absorb some of the LWIR photons emitted in 1/ above; those in the so-called CO2 15 micron absorption band (mostly).
3/ Collisions with the ordinary atmospheric gas molecules, N2, O2, and Ar convey that energy as “heat” to the ordinary atmosphere, and hence raise the atmospheric temperature.
4/ The ordinary atmospehre now slightly warmed continually emits LWIR radiation, essentially isotropically, at a rate, and with a thermal spectrum dependent on the Temperature of the atmosphere.
5/ Some of that thermal emission from the atmosphere gets re-absorbed by other CO2 layers; while some of it returns to the surface, while some of it escapes to space. The emission/re-absorption process happensseveral or many times, before either escape to space or collision with the surface.
The LWIR that returns from the atmosphere to the surface, adds to the surface energy and so reduces the cooling, or warms the surface whichever way you want to consider it.
That is the CO2 process, basically. I am sure you can add conductive energy transfer to the mix.
Now the energy absorbed by the CO2 to warm the atmosphere depends on how much energy is available (the surface emittance, and how much CO2 there is to absorb it; but that LWIR available, we now know is a function of the surface temperature; so it is NOT a constant energy wsource all over the earth. So now you have a problem of sampling over the entire earth to arrive at a global mean value. There’s no current way or system in place for doing that. The earth temperatures change wildly over about 150 deg C total range, so the range of surface LWIR emittance is more than an order of magnitude, and if the CO2 absorbed some constant fraction of that energy, the change in atmospheric temperature would vary substantially; and all of that would depend on where you measure, the surface temperature, the atmospheric temperature, and who knows what else.
This is not painting for me a picture of a robust cause and effect phenomenon.
And we haven’t even begun to consider in what ways the atmospheric system, might react to the changes that this process causes.
Yet we claim that the warming and the CO2 are causally linked; and I haven’t even mentioned water vapor; which is about 25 times in abundance, more than CO2, and exhibits a much broader spectral absorption curve; not to mention the formation of clouds, which give the H2O additional atmospheric properties that neither CO2 nor any other GHG can match.
Well the proof is in the pudding. The Temperature/CO2 data, don’t show any plausible cause and effect relationshsip, based on either recent measured values, nor ancient proxy estimates.
As to “anomalies” In my dictionary, an anomaly is something that is out of place, and not doing what it is supposed to be doing. Nothing in earth’s climate is ever doing something it is not supposed to be doing. Gaia has a thermometer on every single atom or molecule on earth; so she knows exactly what each is doing and is supposed to be doing at any time.
We try to match her laboratory results with a mere handful of thermometers.
No wonder, we never get the right answer; whereas Gaia always does.