From UCSB News: (h/t to David Schnare) UCSB Geologist Discovers Pattern in Earth’s Long-Term Climate Record
![]()
| Lorraine Lisiecki |
||
|
|
||
|
|
||
|
|
||
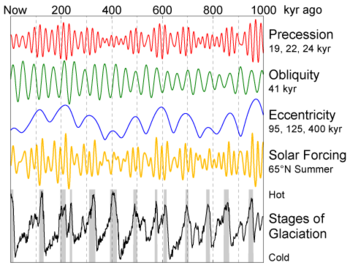
(Santa Barbara, Calif.) –– In an analysis of the past 1.2 million years, UC Santa Barbara geologist Lorraine Lisiecki discovered a pattern that connects the regular changes of the Earth’s orbital cycle to changes in the Earth’s climate. The finding is reported in this week’s issue of the scientific journal Nature Geoscience.
Lisiecki performed her analysis of climate by examining ocean sediment cores. These cores come from 57 locations around the world. By analyzing sediments, scientists are able to chart the Earth’s climate for millions of years in the past. Lisiecki’s contribution is the linking of the climate record to the history of the Earth’s orbit.
It is known that the Earth’s orbit around the sun changes shape every 100,000 years. The orbit becomes either more round or more elliptical at these intervals. The shape of the orbit is known as its “eccentricity.” A related aspect is the 41,000-year cycle in the tilt of the Earth’s axis.
Glaciation of the Earth also occurs every 100,000 years. Lisiecki found that the timing of changes in climate and eccentricity coincided. “The clear correlation between the timing of the change in orbit and the change in the Earth’s climate is strong evidence of a link between the two,” said Lisiecki. “It is unlikely that these events would not be related to one another.”
Besides finding a link between change in the shape of the orbit and the onset of glaciation, Lisiecki found a surprising correlation. She discovered that the largest glacial cycles occurred during the weakest changes in the eccentricity of Earth’s orbit –– and vice versa. She found that the stronger changes in the Earth’s orbit correlated to weaker changes in climate. “This may mean that the Earth’s climate has internal instability in addition to sensitivity to changes in the orbit,” said Lisiecki.
She concludes that the pattern of climate change over the past million years likely involves complicated interactions between different parts of the climate system, as well as three different orbital systems. The first two orbital systems are the orbit’s eccentricity, and tilt. The third is “precession,” or a change in the orientation of the rotation axis.
###
Re: The rapidity of onset of glaciation vs. warmth, here is a reference to 15°C warming in a decade in Greenland:
http://i43.tinypic.com/1zoanbc.jpg
Interesting. Good to see old science inspiring new science, really. Did Milankovitch, those long lonely years when he did his calculations in every available moment of free time, even on family vacation, ever hear of the Platonic Year? I dislike the term “forcings” as used by Ms. Lorraine, because it seems to imply there is a climatic stasis or ideal, but I note UCSB has long been a non-conformist holdout against total academic and cultural homogenization. You have to watch out for the cacti at night in Isla Vista though, when nature calls.
Paul,
I think you’re reading the graph back-to-front, “now” is at the left, so moving from right to left, there’s a very rapid rise in temperature to the interglacial temperature maximum, followed by a relatively slow temperature decline into the next glacial period.
@Stu
During the Ice Age scare in the 70’s I remember a very simple theory that a single anomalously cold summer would keep the previous winter’s snow from melting over significant portions of the northern hemisphere.
The albedo would reflect a summer’s worth of warmth back out into space, leading to even colder summers and so on, and the rapid decent would begin.
Just a cheery thought. 🙂 I’m sure it’s nonsense… :-/
Doesn’t Ms Lisiecki’s first paragraph in her (first?) post above presuppose the accuracy of the records used to “prove” the recent warming?
In addition, I’ve always wondered if short term spikes (<100 yrs or so) are able to leave enough trace for today's scientists to spot.
For those who want to chant "Old science, old science", may I point out that people who have never heared of Milankovitch CAN STILL VOTE !
Bill Tuttle:
Who says that CO2 caused the temperature rise?
Climate is very complex. CO2 is one factor in climate.
More CO2 will – all other things being equal – increase temperatures.
Less CO2 will – all other things being equal – reduce temperatures.
“..why wouldn’t it (rising CO2) prevent — or at least slow — the temperature drop?
How much was CO2 rising? Clearly other factors were driving temperature down. These factors were bigger than any forcing effect from a few more ppm of CO2.
Steve Keohane (08:51:05) :
Thanks for the reference. Re:
From the article and your posting, it appears the warming episodes can and do happen with great(er) rapidity than the cooling phases:
It appears the descents into cooling happen with nowhere near this rapidity.
“Timing of Major Climate Terminations”, M.E. Raymo, Paleoceanography, 1997
http://www.moraymo.us/1997_Raymo.Terminations.pdf
If true, “quick” warm-ups are the “norm”, on the million-year and greater time scale discussed here.
Read the graphs from right to left.
beng:
There’s much everyone would like to know about causes of past temperature rises and falls.
“..should have shown some effect on the temp curves..” – are you sure the data gives this level of accuracy?
It seems hard enough to separate out causes in modern climate with a detailed instrument record.
When I read through the comments here and on other recent posts the picture “presented” is 1000s of climate scientists writing frantically about CO2.
-Why don’t they look at the bigger picture?
-Don’t they realize that climate is much more than CO2?
-Why this narrow focus?
Perhaps climate science is not as pictured..
Subjects of research –
– how much water vapor is in the stratosphere (plus past trends as can be uncovered) and how it gets there
– effect of stratospheric water vapor on stratospheric and tropospheric temperatures
– how the thermohaline current has changed, what effect it has on climate, what caused it to change in the past, how to model it better now
– what factors affect ice sheet melt, how to measure ice melt and understand the sea level budget
– cloud formation, cloud effect on climate, how to measure cloud effect (the “gordian knot” of climate models)
– measurement of aerosols, changes in aerosol composition, optical properties
– measuring water vapor more accurately in the troposphere, understanding the changes in water vapor
..it’s a long list, these were just the ones that came to mind.
There are lots of things that aren’t measured very well and need more comprehensive, more accurate measurements.
There are lots of factors that are poorly understood and need more research.
Not many people working out CO2’s effect on temperature.
Surprising?
RockyRoad (19:38:05) :
scienceofdoom (16:46:39) :
The best from Callion et al on the proof that the CO2 lag of 800 years after temperature isnt in the increasing phase of the curve.
The best proof is when everything turns and start decreasing again. If CO2 induces more warmth , the temperature should continue to rise. Right?
But it doesnt. Temperature starts decreasing FIRST, and THEN CO2 comes down.
There is indeed no tipping point, and it is indeed increased temperature that induces more CO2 . And less temperature gives less CO2.
Henry’s law, me thinks.
“”” Lorraine Lisiecki (19:31:31) :
As the author of this study, I would like to clarify a couple points.
(1) This study specifically deals with the last million years. It does not include any analysis of the warming trend of the last century, which is much faster than changes that would be produced by slow changes in Earth’s orbit over tens of thousands of years. The current changes in orbit would be expected to cause gradual cooling over the next ~90,000 years. “””
Well Lorraine (if that’s ok with you), as one here who basically said; “ho-hum”; not meant in any derogatory sense at all; but to say “how does that help us with today’s climate ssues; or maybe that’s tomorrow’s issues”; that little gem above; “”” The current changes in orbit would be expected to cause gradual cooling over the next ~90,000 years. “”” makes it worthwhile that Anthony referenced your paper at WUWT.
And I’m happy to see you didn’t then go on to add that “what humans are doing to destroy the planet may overcome, and reverse that cooling trend.”
We can add that caveat ourselves; if we are among those who believe in AGW; or we can say; that’s nice to know and also a slow enough effect; to not get involved in current political discussions about what humanity’s actions should be.
So thank you so much for coming here to this hornet’s nest to make those clarifications; and also good luck with the reception of your work by your peers with geologically time framed minds. Maybe we will see your paper cited often in the future literature.
George
Yes this is the Milankovich cycles but Mr. Milankovich isn’t around to defend his work and spell it out nice and slowly to the AWG crowd so she is making a big contribution. AWG proponents like to dismiss the Milankovich cycles but she seems capable of defending her work which is a good thing.
Verification and a slightly deeper understanding of the work that Milankovich started is always a good thing. The fact that she is doing real science should get applause from all of us.
Bill Parsons (10:05:20) : Looking at the big picture, it seems to me that every 100K years some mechanism injects a lot of heat into the earth’s climate system and it slowly loses it until the next injection.
Lorraine Lisiecki (19:31:31)
Should you happen to come back: I purchased and read your article. I found it interesting and insightful; it is a very different way of looking at the 100 K-year pattern that makes a lot of sense, since it eliminates the conundrum of the very weak forcing associated with eccentricity being responsible for the timing of recent ice ages.
The inherent oscillation you propose (phase locked with the 100 K-year eccentricity cycle) is consistent with the rather rapid and large temperature changes that have taken place even during recent glacial periods. The absence of rapid/large temperature changes prior to the initial glaciation of Greenland (indeed rather remarkable temperature stability over several million years at ~2C above the present average temperature) would appear (to me at least!) to support snow/ice albedo effects as the principle feed-back that drives glacial cycles. You noted the closure of the isthmus of Panama as possibly causing the initial glaciation of Greenland. It is not clear to me why this would cause glaciation of Greenland. A gradual drop of atmospheric CO2 in the period leading up to the onset of 41 K-year cycles would seem to be a reasonable explanation.
I wonder what (if any) constraints on climate sensitivity to CO2 concentrations could be drawn from your analysis of ocean sediments. The relative stable climate, at ~2C above present temperatures, prior to the start of glaciation cycles in Greenland, combined with estimates of atmospheric CO2 during the same period ought to shed some light on climate sensitivity in the absence of snow/ice albedo feed-back in the Northern hemisphere.
Starwatcher (17:44:29) :
A feedback gain of greater than 1.0 is not necessary to produce instability.
Here is the series of feedbacks for a gain of 0.9
1.0
1.9
3.61
6.859
13.0321
24.76099
47.045881
89.3871739
169.83563041
322.687697779
613.1066257801
1164.90258898219
2213.31491906616
Even a gain of 0.1 produces rapid instability.
1
1.1
1.21
1.331
1.4641
1.61051
1.771561
1.9487171
2.14358881
2.357947691
2.5937424601
2.85311670611
3.138428376721
3.4522712143931
3.79749833583242
4.17724816941566
4.59497298635722
5.05447028499294
5.55991731349224
6.11590904484146
6.72749994932561
7.40024994425817
8.14027493868399
8.95430243255239
9.84973267580763
10.8347059433884
11.9181765377272
13.1099941915
Ed Murphy (22:39:32) : The way I look at the graph weak eccentricity spikes were also at approximately 400k and 800k years ago but the last Y catastrophic eruption was around 640k years ago. That was during a pretty strong eccentricity spike. Don’t see a correlation to worry about there, in my opinion.
I didn’t say that’s the only thing that can change the state of the cycle; I’m just saying that according to the “seven summers speculation” (that a few cold summers in a row can tip the glass over), a VEI-8 eruption in a non-tropical region would be one of the possible triggers. This would be one of the only such mechanisms that causes an instantaneous (in under a decade) switch.
Per Strandberg (07:17:56) :
“”The recent glaciations were caused exclusively by the various Milankovitch cycles.
Case closed!!
Well, I have a problem with that.””
So do I! I’ve been thinking along these lines for a while now. Be-10 is only formed when cosmic rays enter Earth’s atmosphere, but solar wind ~prevents cosmic rays from entering the solar system. Conclusion! Be-10 can only be formed to any degree during solar minima.
What do we know about other observations during a solar minimum? The hydrological cycle slows giving, slightly increased precipitation, less evaporation and lowering of the effective height of the tropopause as minimum approaches – and then – slightly decreased precipitation, more evaporation and raising of the effective height of the tropopause as the minimum recedes into history. Doesn’t this indicate a lower energy throughput at solar minimum causing less forcing to the hydrological cycle?
How can this be, when ‘total solar irradiation’ (TSI) only alters by ~1%! Perhaps we need to look at ocean insolation for a clue. Which spectrum warms the ocean with greatest efficiency. In a lab, the ‘infrared’ (IR) spectrum only penetrates pure water to a depth of a few metres, the ‘visible’ (vis) spectrum penetrates pure water to a depth of several tens of metres and the ‘ultraviolet’ (UV) spectrum penetrates pure water to a depth of several hundred metres (or part of the UV spectrum would, as it doesn’t all get to strike the Earth’s surface).
Because a short penetration depth to extinction of the energy can be assumed to be more efficient for thermal energy transfer (a longer path to extinction encompasses a greater chance of energy absorption by a non thermal event e.g. use of the vis spectrum in photosynthesis, or use of the UV spectrum in molecule smashing) the IR spectrum must be considered as the most “efficient” and the UV spectrum as the least “efficient”. However, this doesn’t take into account the stability of the IR and vis spectra during transitions between minima and maxima of solar cycles, whereas the UV spectrum alters by ~30% during these transitions and IMHO (I’m only an engineer and no scientist) seems to be the hydrological forcing that alters the hydrological cycle during these solar transitions.
There’s more to this. Earth’s atmosphere becomes acclimatised to UV insolation. The greater the rate of the full UV spectrum that is directed at Earth’s atmosphere, the greater the rate of ozone generation which absorbs IR from ‘outgoing long-wave radiation’ (OLR) in the upper stratosphere (lower ionosphere). However, it also absorbs IR insolation and assists global cooling (the greenhouse effect [GHE] works both ways). I’m beginning to think of the ozone layer as the most important layer of Earth’s atmosphere. It’s more likely that the “run up” and “run down” of UV during solar transitions has the most effect on climate per se.
Where does this leave us with periods of glaciation? Well I don’t think that Sol’s Barycenter actually makes much difference (a minor “Milankovich” type perturbation), but that “tidal” influence within Sol’s entity does.
This is a bit OT for here. If you want to discuss it’s best taken to your site!
Best regards, suricat.
Amino Acids in Meteorites (21:53:00) :
Gail Combs (19:33:03) :
…..and more importantly bringing this theory back in front of the mass media’s attention.
I didn’t see this study anywhere on tv. I do see something about Tiger woods, something about not using nuclear bombs, something about the Tea Party, …….mmmmm, but nope, no science.
Reply:
I quit watching the boob tube in 1974 so I would not know. However she has over 60,000 hits on google and it is not just on science type blogs.
Paul (07:31:43) :
@ur momisugly scienceofdoom, RockyRoad, Bill Tuttle, et al.
“Correct me if I’m wrong, but from what I can tell it appears that the onset of glaciation occurs much more rapidly and dramatically than the onset of warming…..”
Here is the study on that http://www.whoi.edu/page.do?pid=12455&tid=282&cid=10046
“The best known example of these events is the Younger Dryas cooling of about 12,000 years ago, named for arctic wildflower remains identified in northern European sediments. This event began and ended within a decade and for its 1000 year duration the North Atlantic region was about 5°C colder. “
http://www.newscientist.com/article/mg20427344.800-mini-ice-age-took-hold-of-europe-in-months.html
“”” suricat (17:02:28) :
Per Strandberg (07:17:56) :
“”The recent glaciations were caused exclusively by the various Milankovitch cycles.
Case closed!!
Well, I have a problem with that.””
So do I! I’ve been thinking along these lines for a while now. Be-10 is only formed when cosmic rays enter Earth’s atmosphere, but solar wind ~prevents cosmic rays from entering the solar system. Conclusion! Be-10 can only be formed to any degree during solar minima.
…………..
How can this be, when ‘total solar irradiation’ (TSI) only alters by ~1%!
Actually suricat, TSI during a solar cycle only varies by 0.1%, not 1% as you state.
And that 0.1% can only explain 0.025% or 0.072 deg C change in some imagined black body equilibrium earth temperature (counting earth’s typical Albedo reduction and atmospheric absorption).
TSI does not explain things like the recent brief natural warming period.
If earth’s feedback regulator can take care of 30% less TSI during the early “weak sun” period; it can certainly squish any 0.1% sunspot cyclic TSI changes.
“”” Steve Goddard (16:06:34) :
Starwatcher (17:44:29) :
A feedback gain of greater than 1.0 is not necessary to produce instability.
Here is the series of feedbacks for a gain of 0.9
1.0
1.9
3.61 “””
Well Steve, I think most feedback discussion would consider “gain” to be Output/input, rather than output-input.
So in your example here, the gain is 1.9, not 0.9, and it most certainly could be unstable; depending on the time relationship, between input and output.
George
The history of “high gain” wide bandwidth” electronic amplifiers, includes a class of amplifiers, oknown as “Distributed amplifiers”.
A “distributed amplifier” contains a number of active gain elements (vaccuum tubes back then; maybe MOSFETS today). The inputs of the gain elements; grid or gate electrode, are “distributed” along a transmission line; invariably a lumped constant transmission line, in which the input stray capacitance (grid to cathode, or gate to source capacitance) formed the shunt element of the transmission line, and series inductors, often T-coupled inductors, comprised the series impedance elements. The L/C ratio at each transmission line section, set the characteristic impedance of the line, while the LC product set the propagation delay per section, for the input signal injected into the transmission line.
The output of each active element (plate or drain element) was likewise connected as part of an output transmission line, where the output stray capacitance (plate to cathode, or drain to source) formed the shunt element of an output transmission line, once again with series or T-element coupled inductors between each active element.
Teh LC product for the output transmission line, was made identical to that for the input transmission line, and the L/C ratio set the output line impedance.
Teh result was that a travelling wave input signal was sequentially applied to each active element, and its resultant output current was dumped onto an output line synchronously timed, so the outputs all added in just as the output travelling wave arrived at the correct timing.
As a result, one could have a low impedance output line, such that the Voltage gain for any one gain element; tube or MOSFET, might be less than one; but now the contributions of each active element simply add arithmetically, until the total Voltage gain was greater than one.
At that point one could couple the signal from the output transmission line of one “stage” to the input transmission line of a second stage, to get a gain multiplication.
One could put a lot of elements on a single stage, to get a large stage gain; or one could have many stages with small gains >1.0 which multiplied to a larger gain, to get some overall gain value.
One could prove that the total number of gain devices (tubes or FETs) was minimum, if each cascaded gain stage, had a Voltage gain of sqrt(e) = 1.648.
For a regular cascaded amplifier, the optimum stage fggain for maximum gain bandwidth product is (e = 2.718)
Maybe I have those two reversed; but some young electronics whizz can correct me on that.
In any case; it was a method of getting very large gain bandwidth products with devices that weren’t too swift by today’s standards.
The all time Classic implementation of a distributed amplifier, was the Vertical amplifier of the Tektronix type 511 oscilloscope. This scope had an input impedance for the input transmission line of 170 Ohms; which was very high for a coaxial transmission line; and was a special edition of the General Radio type 874 rigid coaxial line hardware.
The bulk of the amplifier was a collection of push pull triode stages using dual triode tubes; and taking advanbtage of crosscoupling of the push pull lines to neutralize the grid to plae capacitance of the triode vaccuum tubes. Totally bloody clever. There was a total of 156 vaccuum tubes in that amplifier which had a 50 MHz -3dB bandwidth, and a 50 mV per cm sensitivity from input line to the direct drive to the CRT deflection plates.
If it hadn’t been for somebody in the physics department blowing the smithereens out of the 170 Ohm termination resistor in that input stage, on the scope we had, I would now be a rich sheep farmer in NZ, instead of a struggling Physicist trying to make a living doing optics for Optical mice.
Funny how things happen.
But in any case; gain is usually considered a multiplier, and not an adder.
George E. Smith (17:55:43) :
Think about what you are saying. You are suggesting a series of
1.0
0.9
0.81
0.73
That would be negative feedback, where each successive iteration is smaller than the previous one. We are discussing positive feedback.
A multiplier of 1.0 would be no feedback.
1.0
1.0
1.0
1.0
1.0
1.0
1.0
1.0
1.0
1.0
1.0
1.0
1.0
1.0
1.0
1.0
1.0
1.0
1.0
1.0
1.0
1.0
1.0
1.0
1.0
1.0
1.0
1.0
1.0
1.0
1.0
1.0
1.0
1.0
1.0
1.0
1.0
1.0
1.0
1.0
1.0
1.0
George E. Smith (17:55:43) :
I thought it over some more and you are correct
The feedback formula is something like F + F^2 + F^3 + F ^4 + …… F^N which does converge on a finite number for any value of F less than 1