The Warning in the Stars
By David Archibald
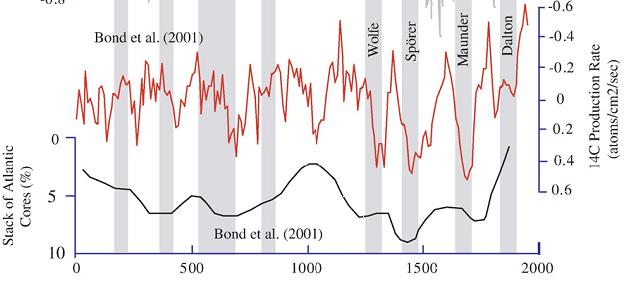
If climate is not a random walk, then we can predict climate if we understand what drives it. The energy that stops the Earth from looking like Pluto comes from the Sun, and the level and type of that energy does change. So the Sun is a good place to start if we want to be able to predict climate. To put that into context, let’s look at what the Sun has done recently. This is a figure from “Century to millenial-scale temperature variations for the last two thousand years indicated from glacial geologic records of Southern Alaska” G.C.Wiles, D.J.Barclay, P.E.Calkin and T.V.Lowell 2007:

The red line is the C14 production rate, inverted. C14 production is inversely related to solar activity, so we see more C14 production during solar minima. The black line is the percentage of ice-rafted debris in seabed cores of the North Atlantic, also plotted inversely. The higher the black line, the warmer the North Atlantic was. The grey vertical stripes are solar minima.
As the authors say, “Previous analyses of the glacial record showed a 200- year rhythm to glacial activity in Alaska and its possible link to the de Vries 208-year solar (Wiles et al., 2004). Similarly, high-resolution analyses of lake sediments in southwestern Alaska suggests that century-scale shifts in Holocene climate were modulated by solar activity (Hu et al., 2003). It seems that the only period in the last two thousand years that missed a de Vries cycle cooling was the Medieval Warm Period.”
The same periodicity over the last 1,000 years is also evident in this graphic of the advance/retreat of the Great Aletsch Glacier in Switzerland:

The solar control over climate is also shown in this graphic of Be10 in the Dye 3 ice core from central Greenland:

The modern retreat of the world’s glaciers, which started in 1860, correlates with a decrease in Be10, indicating a more active Sun that is pushing galactic cosmic rays out from the inner planets of the solar system.
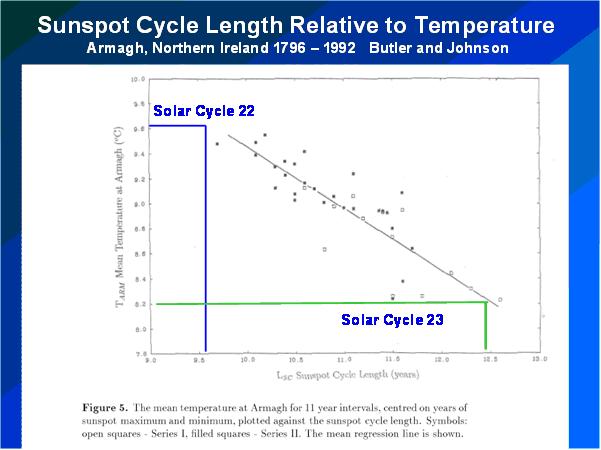
The above graphs show a correlation between solar activity and climate in the broad, but we can achieve much finer detail, as shown in this graphic from a 1996 paper by Butler and Johnson (below enlarged here)::

Butler and Johnson applied Friis-Christensen and Lassen theory to one temperature record – the three hundred years of data from Armagh in Northern Ireland. There isn’t much scatter around their line of best fit, so it can be used as a fairly accurate predictive tool. The Solar Cycle 22/23 transition happened in the year of that paper’s publication, so I have added the lengths of Solar Cycles 22 and 23 to the figure to update it. The result is a prediction that the average annual temperature at Armagh over Solar Cycle 24 will be 1.4C cooler than over Solar Cycle 23. This is twice the assumed temperature rise of the 20th Century of 0.7 C, but in the opposite direction.
To sum up, let’s paraphrase Dante: The darkest recesses of Hell are reserved for those who deny the solar control of climate.
This essay is also available in PDF form: TheWarningintheStars
Discover more from Watts Up With That?
Subscribe to get the latest posts sent to your email.
Stephen Wilde (18:55:40) :
“…I have tried to square the circle by proposing that oceanic variations in the rate of energy release are the most direct climate driver with solar changes providing the longer term background trend with both oceanic and solar influences varying independently and capable of moving in and out of phase over millennia.
That provides a mechanism to explain the failures of correlation from time to time and also accounts for the size of climate shifts in the face of small solar variability. Additionally it can explain why the size and speed of climate shifts seems to vary greatly between periods of glaciation and interglacials.
As regards the scale of solar effects I have proposed that counterintuitively a more active sun increases the rate of energy loss to space more than the additional power output provided by the extra activity adds energy to the Earth system. When the active sun causes an expansion of the upper atmosphere we see an increased surface area of atmosphere exposed to space with a faster transfer of energy outward. An active sun also creates a more turbulent upper atmosphere which also increases total surface area at the interfaces between each layer of the upper atmosphere for a similar effect.”…
I think you’re on the right track with this Stephen, and it is the overlapping quasi-cyclical events, some triggered by changes to the suns output, which explain the hazy correlation seen. Throw in a dose of deterministic chaos and a few big volcanoes, and perhaps the Earth’s store of energy slowly dissipates into space.
Below is a broad brush picture of past history/prediction which, due to our inability to get precise measurements of Earth’s energy budget, is probable as close as you can get.
1410-1500 cold – Low Solar Activity(LSA?)-(Sporer minimum)
1510-1600 warm – High Solar Activity(HSA?)
1610-1700 cold – (LSA) (Maunder minimum)
1710-1800 warm – (HSA)
1810-1900 cold – (LSA) (Dalton minimum)
1910-2000 warm – (HSA)
2010-2100 (cold???) – (LSA???)
This seems close to Vukcevic’s more detailed graph which he posted here:-
http://www.vukcevic.talktalk.net/GrandMinima.gif
Here’s a list of changes which happen during a solar cycle, other than TSI, compiled with the help of WUWT readers on a previous thread:-
Triggers for cool-mode climate – happening now.
Low latitude jet stream in the northern hemisphere.
Low Ap index.
Weak NH polar vortex.
Less UV hitting Earth’s atmosphere.
Low density/speed solar wind.
Reduced depth of Earth atmosphere.
Increase in cosmic rays.
Enhanced cloud cover.
PDO turning negative.
El Nino conditions weak.
Weak Gulf Stream.
Additional potential triggers – yet to happen.
Big volcanic eruptions.
La Nina.
Increased albedo from extra snow.
Perhaps Rbateman’s changes to sunspot area vs facular area should also go on the list?
aMINO aCIDS iN mETEORITES (07:19:41) :
Darius (22:51:15) :
We are at the end of an unusually long and deep solar minimum. Yet every year in the last three was one of the ten warmest on record.
……………………………………………………………………………………………………………
Your science is sloppy.
There has been cooling since 2005.
You think a 5-year trend tells us anything about the climate? Let’s have a look at, say, the last 15 5-year trends:
http://www.woodfortrees.org/plot/rss/from/to/plot/rss/from:2005/to:2010/trend/plot/rss/from:2004/to:2009/trend/plot/rss/from:2003/to:2008/trend/plot/rss/from:2002/to:2007/trend/plot/rss/from:2001/to:2006/trend/plot/rss/from:2000/to:2005/trend/plot/rss/from:1999/to:2004/trend/plot/rss/from:1998/to:2003/trend/plot/rss/from:1997/to:2002/trend/plot/rss/from:1996/to:2001/trend/plot/rss/from:1995/to:2000/trend/plot/rss/from:1994/to:1999/trend/plot/rss/from:1993/to:1998/trend/plot/rss/from:1992/to:1997/trend/plot/rss/from:1991/to:1996/trend
What do you notice? The trends are all over the place – from -0.4C to nearly +1C per decade (look at the ‘raw data’ link). Which of those do you think is the ‘correct’ long-term trend? Obviously, you cannot tell. The solar cycle alone gives you an 11-year fluctuation, so it’s clearly nonsense to use 5-year trends to argue anything about long-term global climate change.
How about 10-year trends? –
http://www.woodfortrees.org/plot/rss/from/to/plot/rss/from:2000/to:2010/trend/plot/rss/from:1999/to:2009/trend/plot/rss/from:1998/to:2008/trend/plot/rss/from:1997/to:2007/trend/plot/rss/from:1996/to:2006/trend/plot/rss/from:1995/to:2005/trend/plot/rss/from:1994/to:2004/trend/plot/rss/from:1993/to:2003/trend/plot/rss/from:1992/to:2002/trend/plot/rss/from:1991/to:2001/trend/plot/rss/from:1990/to:2000/trend/plot/rss/from:1989/to:1999/trend/plot/rss/from:1988/to:1998/trend/plot/rss/from:1987/to:1997/trend/plot/rss/from:1986/to:1996/trend
Less variability than 5-year trends, but still a lot – from about 0 to +0.4C per decade. Do you think that gives us a handle on the longer term trend? Still not very well, but it’s clearly greater than zero.
How about 15-year trends? –
http://www.woodfortrees.org/plot/rss/from/to/plot/rss/from:1995/to:2010/trend/plot/rss/from:1994/to:2009/trend/plot/rss/from:1993/to:2008/trend/plot/rss/from:1992/to:2007/trend/plot/rss/from:1991/to:2006/trend/plot/rss/from:1990/to:2005/trend/plot/rss/from:1989/to:2004/trend/plot/rss/from:1988/to:2003/trend/plot/rss/from:1987/to:2002/trend/plot/rss/from:1986/to:2001/trend/plot/rss/from:1985/to:2000/trend/plot/rss/from:1984/to:1999/trend/plot/rss/from:1983/to:1998/trend/plot/rss/from:1982/to:1997/trend/plot/rss/from:1981/to:1996/trend
Now we’re beginning to see more consistency. Clearly there is no cooling. The lowest of these trendlines gives warming of about 0.1C per decade, but it should be obvious that you can’t just choose the smallest (or largest) trend out of this bunch and say that that is representative of long-term change.
Using 22-year trends smooths out most of the variability from the solar cycle –
http://www.woodfortrees.org/plot/rss/from/to/plot/rss/from:1988/to:2010/trend/plot/rss/from:1987/to:2009/trend/plot/rss/from:1986/to:2008/trend/plot/rss/from:1985/to:2007/trend/plot/rss/from:1984/to:2006/trend/plot/rss/from:1983/to:2005/trend/plot/rss/from:1982/to:2004/trend/plot/rss/from:1981/to:2003/trend/plot/rss/from:1980/to:2002/trend/plot/rss/from:1979/to:2001/trend
Now we can finally see that the warming trend is around 0.18C per decade, just as the climate scientists have been saying for many years.
By the way, downward long-wave radiation is based on local parameter calculations (the calculation formulas are readily available on the web), not direct measure on a global scale. Both clear sky and cloudy sky conditions are used in its estimate. It is greatly affected by water vapor (as in humidity) and air temperature. The immediate affects of CO2 and other minor greenhouse gases have much less of an affect on variability and are probably buried in the high degree of variability caused by clouds, humidity, and air temperature. This dynamical piece of our weather has important ramifications for agriculture, so the estimates are sought after daily if not hourly in high risk conditions.
David, I too would like to see more (all) data upon which you are basing your hypothesis. I think we need to be open to all considerations, since we don’t know what the hell is going on. I suspect it will boil down to the effect of a sum of variables, not anyone’s pet theory
Darius (22:52:42) : Does it bother anybody that the recent solar minimum coincided with some of the warmest temps on record?
You left out the qualifier, “warmest” adjusted“temps on record”.
Leif Svalgaard (17:42:44)
sounds to me like Leif has a loyal flock of his own..
The first graph does appear to invalidate the claims of the author at first glance. However, complex systems with complex damping and forcing can have different modes. It is possible that in our present mode this correlation works. In another mode it does not. The author should have addressed this issue. However, one should not throw the baby out with the bath water. It is important to listen and strive to understand and perhaps learn, even from an incorrect hypothesis.
Unfortunately science often degenerates into a contest of who is right rather than a search for understanding. I get a bit sick of the childish my brain is bigger than your brain drama. Frankly none of us including the “climate scientists” fully understand what is going on. The only people in this debate who know EXACTLY what they are doing are the politicians and the carbon traders.
Monty
Tenuc (08:23:51) :
1410-1500 cold – Low Solar Activity(LSA?)-(Sporer minimum)
1510-1600 warm – High Solar Activity(HSA?)
1610-1700 cold – (LSA) (Maunder minimum)
1710-1800 warm – (HSA)
1810-1900 cold – (LSA) (Dalton minimum)
1910-2000 warm – (HSA)
2010-2100 (cold???) – (LSA???)
Your timings are incorrect, e.g. Maunder minimum 1645-1700, Spoerer [until 1530], etc. By shifting the times some decades abck and forth you can make anything fit.
Monty (09:26:44) :
The first graph does appear to invalidate the claims of the author at first glance. […] It is important to listen and strive to understand and perhaps learn, even from an incorrect hypothesis.
but not from incorrect data…
Leif Svalgaard (08:00:04) :
And all other posters on here that agree that the Sun can’t be a contributor to the Climate changes, perhaps you can answer for us un-initiated, well this one at least :-
1. Why is it cooler at the Poles than at the Equator?
2. Why is it Winter in the NH and Summer in the SH?
3. When you have answered why there can be 60 Degrees C difference between those areas in 1 & 2 perhaps you can then explain why a very minor change in the Sun can have no affect on a few degrees C change in “Climate”.
I know I am not well educated, but I have trouble getting my head around it.
There appears to be only 3 possible Heat sources, Sun, Cosmic or Earth Core.
So if the Sun’s input is constant (as it can’t affect Climate Change) what drives El Nino and La Nina?
A C Osborn (10:34:12) :
1. Why is it cooler at the Poles than at the Equator?
Because the sun shines at an angle [it is overhead at the equator and very low in the sky [or even below the horizon for months on end] at the poles, so the Sun’s heat has to be distributed over a much larger area, so each square foot gets less.
2. Why is it Winter in the NH and Summer in the SH?
Because the Earth’s axis is tilted by 23 degrees. When tilted towards the Sun a hemisphere gets more heat.
3. When you have answered why there can be 60 Degrees C difference between those areas in 1 & 2 perhaps you can then explain why a very minor change in the Sun can have no affect on a few degrees C change in “Climate”.
Because 1 & 2 are major changes in solar input [e.g. during the polar night when no sunlight reaches the pole.
Gawd! I wish you guys and gals would get this right, it is Dark Matter that controls the amount of energy reaching the earth! More dark matter betwixt us and the sun, more rays bent out of the earth’s path. Less dark matter, more rays directly hitting the earth.
Jeez, that is so simple to understand!
Ref – DeNihilist (11:23:19) :
“Gawd! I wish you guys and gals would get this right, it is Dark Matter that controls the amount of energy reaching the earth!..”
______________________
And… it’s in Dark Matter “Clouds”. And we encounter these twice in a 240 million year “Year” as we move around the Milky Way, and these clouds have breaks and spaces and we encounter them on a regular basis too (now the interval is about 120k years -note ‘year’ here is an Earth year, not a Milky Way ‘Year’). Yep! It’s Dark Matter! Gotta be!
PS: I’m beginning to think the Milky Way is like a beach, with tides and everything:-)
So Leif, what you’re saying is that the parts of the earth that get less solar energy are cooler, and the parts that get more are warmer? OK, that makes sense. But then you want me to believe that variations in solar output, which reduce/increase the amount of solar energy recieved over every square foot of the planet, have no effect on our climate. Sorry, that just does does not compute.
DeNihilist (11:23:19) :
Less dark matter, more rays directly hitting the earth.
Jeez, that is so simple to understand!
just as easy as to understand that a candle does not give light, but rather sucks up the dark. Just look at the wick.
Leif Svalgaard (17:42:44) “The red curve is supposed to be solar activity [inverse 14C] and the gray bands solar minima.”
Incorrect on the latter point.
From Wiles et al. (2008):
“Shaded intervals are times of general glacier advance.”
Re: Pamela Gray (18:13:31)
Have you been understanding what Piers Corbyn is doing?
Leif Svalgaard (10:06:47) :
Tenuc (08:23:51) :
1410-1500 cold – Low Solar Activity(LSA?)-(Sporer minimum)
1510-1600 warm – High Solar Activity(HSA?)
1610-1700 cold – (LSA) (Maunder minimum)
1710-1800 warm – (HSA)
1810-1900 cold – (LSA) (Dalton minimum)
1910-2000 warm – (HSA)
2010-2100 (cold???) – (LSA???)
Your timings are incorrect, e.g. Maunder minimum 1645-1700, Spoerer [until 1530], etc. By shifting the times some decades abck and forth you can make anything fit.”
These are quasi-cycles, Leif, and are the result of the deterministic chaos which drives our climate system.
As I stated in my original a broad brush picture and timings within a few decades is the best you are going to get. Just like solar cycles, they do not have precise timings or magnitude, but just like solar quasi-cycles they are real nevertheless.
BTW, the Sporer period was 1420 – 1530, which was quite a long cool spell. Be interesting to see how the 21st century pans out – cooler than the 20th I think.
Stephen Wilde (18:55:40) : The disjunction between the views of David Archibald and Leif Svalgaard has been exercising me for some time.
Or Leif and Geoff. At one point I took two different graphs related to the different material Leif and Geoff were each supporting and arguing about furiously, and found… they were actually in agreement but hadn’t spotted it. oops.
I’m disappointed in David Archibald’s lack of rigour here, it is indeed a missed opportunity. He has done a lot better – eg his graph of correlation between sea level change and solar cycles. And for all Leif hisses, plus we don’t know what the driver is (as Leif rightly states, TSI variations are too small) there is significant correlation between solar cycles and various terrestrial phenomena. Svalgaard shows, in MagicJava’s video five, a very high correlation between solar activity and cloud cover up to 2007. And Prof Will Alexander, in the really firstrate paper quoted above, and with a lifetime of expertise, shows a 95% confidence (ie engineering quality, high) correlation between solar cycles and drought-broken-by-flood in S Africa The study was done because people were being affected – it was not an ivory tower project. That paper deserves a restatement here, I’d do it but am too busy right now.
Re: A C Osborn (Feb 28 10:34),
The following is a video of how metronomes get synchronized without any extra energy input, just because of momentum conservation .
It is instructive as an analogue on how cycles like la Nina and el Nino might happen when the “metronome” of the seasons hits the oceans, (and not only).
The following is instructive on how chaotic “order” can appear again with a constant energy input and small perturbations from outside. Particularly the fingers are amazing.
here is one with more metronomes
Lief,
I agree with you to lie about your data is inexcusable.
Are you saying that the C14 numbers are incorrect? Personally I do not like the inversion of the data, but that is not the issue. Are the C14 data wrong and if so why? Or are you saying he moved the dates of the solar events around? That would be a misrepresentation to say the least.
Monty
Colin M (11:55:32) :
reduce/increase the amount of solar energy recieved over every square foot of the planet, have no effect on our climate. Sorry, that just does does not compute.
You are correct, it doesn’t compute. The variation of solar energy DOES have an effect on our climate, namely 0.05K, or about 1/10 degree F.
Not sure if you have seen this, but here’s a link to a video on the status of the CLOUD experiment at CERN:
http://cdsweb.cern.ch/record/1181073/
No one….outside of the CO2 camp….would argue that any one factor is the primary driver of this complex system we call our climate.
The mere potential that the results of this experiment could explain one of the climate drivers and it’s effect over geologic timescales is exciting.
Just The Facts (20:22:55) :
“And there also seems to be reasonable evidence for a significant volcanic component based historical observation:”
Here’s something that’s also significant to add to your collection, the effects of the locations of the eruptions, as well as the size, sulfer rich gas content and frequency…
http://pubs.giss.nasa.gov/abstracts/2005/Oman_etal.html
http://icecap.us/images/uploads/AOSOI.pdf
I believe the main value of this article is as an introduction to an interesting theory of solar influence on the Earth’s climate. There may be, as some have suggested here, something to be lacking in the technical completeness of the article.
The interesting charts presented do appear to show our past climate going through a very definite series of warming and cooling episodes.
The variation of solar energy DOES have an effect on our climate, namely 0.05K, or about 1/10 degree F.
This would be correct if our Earth were a lifeless black body.
Fortunately, it is a biosphere that reacts to changes in solar activity in many ways, amplifying the primary effect.