The Warning in the Stars
By David Archibald
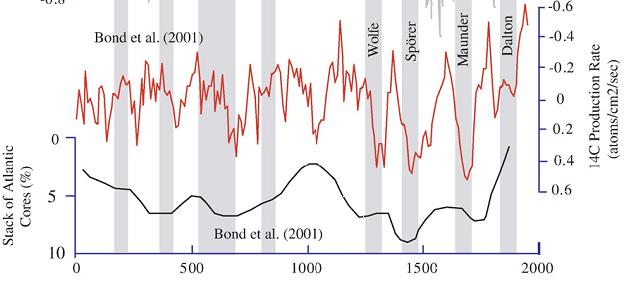
If climate is not a random walk, then we can predict climate if we understand what drives it. The energy that stops the Earth from looking like Pluto comes from the Sun, and the level and type of that energy does change. So the Sun is a good place to start if we want to be able to predict climate. To put that into context, let’s look at what the Sun has done recently. This is a figure from “Century to millenial-scale temperature variations for the last two thousand years indicated from glacial geologic records of Southern Alaska” G.C.Wiles, D.J.Barclay, P.E.Calkin and T.V.Lowell 2007:

The red line is the C14 production rate, inverted. C14 production is inversely related to solar activity, so we see more C14 production during solar minima. The black line is the percentage of ice-rafted debris in seabed cores of the North Atlantic, also plotted inversely. The higher the black line, the warmer the North Atlantic was. The grey vertical stripes are solar minima.
As the authors say, “Previous analyses of the glacial record showed a 200- year rhythm to glacial activity in Alaska and its possible link to the de Vries 208-year solar (Wiles et al., 2004). Similarly, high-resolution analyses of lake sediments in southwestern Alaska suggests that century-scale shifts in Holocene climate were modulated by solar activity (Hu et al., 2003). It seems that the only period in the last two thousand years that missed a de Vries cycle cooling was the Medieval Warm Period.”
The same periodicity over the last 1,000 years is also evident in this graphic of the advance/retreat of the Great Aletsch Glacier in Switzerland:

The solar control over climate is also shown in this graphic of Be10 in the Dye 3 ice core from central Greenland:

The modern retreat of the world’s glaciers, which started in 1860, correlates with a decrease in Be10, indicating a more active Sun that is pushing galactic cosmic rays out from the inner planets of the solar system.
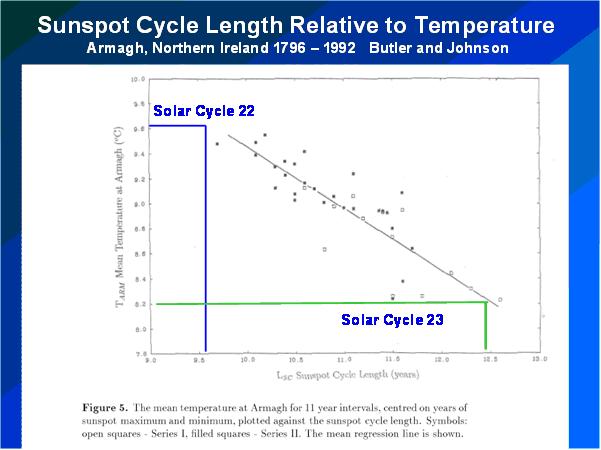
The above graphs show a correlation between solar activity and climate in the broad, but we can achieve much finer detail, as shown in this graphic from a 1996 paper by Butler and Johnson (below enlarged here)::

Butler and Johnson applied Friis-Christensen and Lassen theory to one temperature record – the three hundred years of data from Armagh in Northern Ireland. There isn’t much scatter around their line of best fit, so it can be used as a fairly accurate predictive tool. The Solar Cycle 22/23 transition happened in the year of that paper’s publication, so I have added the lengths of Solar Cycles 22 and 23 to the figure to update it. The result is a prediction that the average annual temperature at Armagh over Solar Cycle 24 will be 1.4C cooler than over Solar Cycle 23. This is twice the assumed temperature rise of the 20th Century of 0.7 C, but in the opposite direction.
To sum up, let’s paraphrase Dante: The darkest recesses of Hell are reserved for those who deny the solar control of climate.
This essay is also available in PDF form: TheWarningintheStars
Discover more from Watts Up With That?
Subscribe to get the latest posts sent to your email.
It’s always the sun. It’s always the sun. Always, always, always the sun. [Stranglers 1986]
(reserving judgement… the Butler&Johnson grafic looks intriguing…)
franks (02:58:38) :
As one of David’s loyal flock I come for scientific discussion here rather than the mud slinging and almost pure dogma that seem to emanate from elsewhere.
I agree. There is nothing wrong with compare by graph conjecture and less rigorous discussions here … I don’t think.
Personally, I’ve been mapping historical events and matching them with phenomena suggested by the C14 and Be data et al. I actually created a one page climate model with predictions this way for a bit of fun. Interesting correlations. I like it the more I play with it.
Some of this discussion disparaging Solar Forcing here and in other comments got me thinking about another phenomena … different categories of climate enthusiasts/scientists. In simple terms 1)AGW, 2)Paleo-static, 3)Oceans, 4)Solar. There are a couple sub categories as well given the drive to an outcome or ability to predict or create experimental corroboration.
… thanks to moderator for deleting previous mess i made. Not sure what happened.
“a prediction that the average annual temperature at Armagh over Solar Cycle 24 will be 1.4C cooler than over Solar Cycle 23. This is twice the assumed temperature rise of the 20th Century of 0.7 C, but in the opposite direction.”
Predictions are good. Let’s see if it turns out to be as accurate as the famous prediction of the UAH temperature in May 2009. The second sentence I’ve quoted makes no sense; no temperature rise is “assumed”, and a comparison between global observations and a prediction for Armagh is completely meaningless. You might as well compare the global upward temperature trend with the temperature trend in my house when the heating goes off.
Stephen Wilde (18:55:40) :
The disjunction between the views of David Archibald and Leif Svalgaard has been exercising me for some time.
Stephen,
Your post appeared shortly after the one in which I quoted Harrison Schmitt. I think you are positing an hypothesis to explain what Schmitt observed — at least for climate variation on decadal to centennial scales (i.e. excluding millennial, and I’m not sure what Schmitt meant by “epochal”) — i.e. that all natural climate variation is a terrestrial response to solar heating imbalances. Now, as I think about it, that does leave out the not unimportant role of vulcanism in perturbing climate stasis, but for the most part, I think it has to be true that natural climate variation is primarily driven by how the earth interacts with solar variation (whatever that means, which I think we still poorly understand). I think you are on the right track.
“As the authors say, “Previous analysis of the glacial record showed a 200- year rhythm to glacial activity in Alaska and its possible link to the de Vries 208-year solar (Wiles et al., 2004).”
Its a fallacy to think that the Sun follows a regular pattern. There are no straight lines in nature, but there is an underlying trend that wont go away. These patterns are not good for the solar experts amongst us?
@Marc77 and David L So far the TSI seems to have less to do with the temperatures in the US than the AMO and PDO. Refer to the paper by Dr. Joseph D’Aleo, http://www.google.com/url?sa=t&source=web&ct=res&cd=1&ved=0CAgQFjAA&url=http%3A%2F%2Ficecap.us%2Fimages%2Fuploads%2FUS_Temperatures_and_Climate_Factors_since_1895.pdf&rct=j&q=TSI+AMO+PDO+Temperature&ei=iHKKS_HvONSztgej-ZSPDw&usg=AFQjCNGRUHLT23avUqWLutWh0Ke8wwlQvw
For some inexplicable reason the article and comments force me to ask:
What parts (wavelengths) of “solar radiation” heat the Water World (Earth) more than any other?
We all know that a microwave oven does a great job of heating a cup of water quickly. When we open the door only the water and -to a very minimum degree- the cup are hot (I don’t wait for the cup to get hot). Sunlight, to most of us, is “white light”. Sunlight to a scientist, is a jumble of lots of waves.
During a Solar Century (say 1901-2001) what happens to the Water World that causes progressive warming? Is it Solar Microwaves? Some other, better, water heating ‘wave’ or frequency range? Somethings doing it?
To say, “It’s not the Sun!” doesn’t answer the mail.
franks (02:58:38) :In these epochs of change, strangely coincidental with Solar Minimums, old churches and convents close along with confused friars who find themselves having lost their self-calming and self-indulging parameters.
What is the radiative forcing associated with these changes in solar activity?
From what I’ve read, even a Maunder Minimum represents only about 0.3 – 0.4W/m² compared to current anthropogenic forcing of around 1.6W/m².
Whilst it is certainly true that the sun is by far the largest source of heat for the climate system (geothermal is tiny by comparison), other forcings such as aerosols and greenhouse gases can have a much larger influence on climate in the short term.
We know that the substantial increase in anthropogenic greenhouse gases is changing the Earth’s radiative balance because of the observed decrease in longwave radiation to space at the wavelengths absorbed by those gases (mostly CO2 and CH4) (Harries 2001) and the observed increase in downward longwave radiation (Philipona 2004).
Current solar activity should be producing a slight decline in global average temperatures if that was the only change in forcings, so on the face of it solar activity can’t account for the current warming of ~0.2C per decade, regardless of how much influence it may have had in other periods.
AusieDan (23:19:13) :
Items worth debating include:
1. variation in cloud cover & cycles in the same.
2. variations in magnetic activity in the sun and between sun & earth plus
trends & cycles in the same.
3. variations in cosmic rays hitting the lower atmosphere.
4. multi correlations between the above.
5. Theoretical relationships between these factors.
All of these things are of great interest and are worth discussing as we are doing. But variations of solar irradiance [even if small] are also worth discussing because energy-wise they are MUCH, MUCH larger than any of the above.
6. Progress in the CERN “Cloud” experiment.
There hasn’t been any. The pilot experiment was inconclusive.
7. Trends and cycles in the global temperature.
8. Errors in measurement (Manipulation?) in both the ground based and satelite based global temperature.
Again these things are worth discussing. The possible connection with solar events are also worth discussing, but all discussions must be conducted to a reasonable scientific standard, that Archibald did not reach.
I hope that when climate “science” clears its act, the vocabulary of “forcing” should go the way of the phlogiston.
Back to simple thermodynamics is the way, and clean energy balances.
When David Archibald posts, I experience that careful science goes out the window and prefer to read about the wild bird flying in to safety and pooping on the keyboard after stealing frazzled kitty’s food. The picture of bunnies hopping across the keyboard also fascinates me. What does your “office” look like, George Turner? Can I have one like that, too?
I think we shoud be careful of the “sky is falling”, uh, er, the “ice is hungry” state of mind. Yes, we are in a cooling period (down PDO, maybe down AMO) with with some new, fascinating unknowns opening themselves to us, and it seems that we might be overstaying our interglacial. However, I would prefer to spend my time reading “careful” science.
Yes, I know, just bypass the posts I prefer not to read, but, dang, Anthony, you have become a habit with me. No one does “it” better.
REPLY: I hear you, I had misgivings about the first graph myself. However I think that it is valuable to flesh these things out. The value to WUWT is that it gives instant peer review to ideas. In this case, the review says this essay is probably not valid. Weeding out good ideas from bad ideas is just as useful I think. – A
Pamela Gray (20:07:25) : …and, last but not least, “Peer-review” by the superiors of the order of the agnostic church..:-)
Vuk: Your http://www.vukcevic.talktalk.net/GrandMinima.gif
seems like an oscillating current powering the sun 🙂
Darius (22:51:15) :
We are at the end of an unusually long and deep solar minimum. Yet every year in the last three was one of the ten warmest on record.
……………………………………………………………………………………………………………
Your science is sloppy.
There has been cooling since 2005.
It was much warmer on earth 1000 years ago than it is now.
R. de Haan (01:21:09) :
Physics Major (16:57:30) : about the ads
There is the old saying about “knowing thy enemy.”
But really, sometimes these things are interesting and informative. Sometimes they are funny. By doing a Ctrl-click on 3 or 4 and letting them all come up I can then check each out – and sometimes learn something, and then close them out. If Anthony gets rich, it does me no harm. In fact, I suspect in some stock fund we have a few Google shares and thus it is, in some miniscule way, beneficial to me.
Icarus (06:16:51) :
How are you holding up under the deceitfulness found in the scientists involved in ClimateGate?
savethesharks (22:04:46)
Basil (05:47:03)
Thanks for your encouragement.
Not only does Schmitt suggest something along similar lines but also the idea is cropping up in various places since I set it out thus:
“It is becoming increasingly obvious that the rate of energy transfer varies all the time between ocean and air, air and space and between different layers in the oceans and air. The troposphere can best be regarded as a sandwich filling between the oceans below and the stratosphere above. The temperature of the troposphere is constantly being affected by variations in the rate of energy flow from the oceans driven by internal ocean variability, possibly caused by temperature fluctuations along the horizontal route of the thermohaline circulation and by variations in energy flow from the sun that affect the size of the atmosphere and the rate of energy loss to space.
That is what we need to get a grip on to diagnose changes in the energy content of the troposphere.
The observed climate is just the equilibrium response to such variations with the positions of the air circulation systems and the speed of the hydrological cycle always adjusting to bring energy differentials above and below the troposphere back towards equilibrium (Wilde’s Law ?)
Additionally my propositions provide the physical mechanisms accounting for the mathematics of Dr. F. Miskolczi (assuming his maths is correct).
Pascvaks (06:14:23) :
I’d like to know that, too.
How significant a factor do you consider solar variability as a driver of recent and forthcoming changes in Earth’s climate system as compared to the impact of ocean cycles,
Consider that the ONLY input you can have to Ocean heating is solar. Sorry, the air simply can’t do it.
From what I’ve read, even a Maunder Minimum represents only about 0.3 – 0.4W/m² compared to current anthropogenic forcing of around 1.6W/m².
Consider who you’ve read that from. The 1.6 W figure is unproven at best.
Current solar activity should be producing a slight decline in global average temperatures if that was the only change in forcings, so on the face of it solar activity can’t account for the current warming of ~0.2C per decade,
Keep a couple things in mind. Number 1, the surface station records are junk. Number 2, the satelite numbers are unverified, and we’ve only been measuring for around 30 years. We really don’t have any history here, so all the breathless “warmest in the record” is really pretty meaningless. Cheifio in this thread or another, gives a pretty good exposition on the Oceans radiating off more heat, which explains a lot about the current weather. If you consider the Oceans as a giant Climate Governor, then it makes sense the Oceans would be giving off more heat now, in a time of less Solar output, as they are trying to maintain a stable atmosphere. As cold as it’s been on the landmasses lately, we should be GLAD the Ocean temperatures may be showing some surface warming. We should hope, however, that the sun wakes up and recharges the system a little.
pyromancer76 (06:53:08) :
REPLY: […] In this case, the review says this essay is probably not valid. Weeding out good ideas from bad ideas is just as useful I think. – A
The bad ideas are the weeds, not the good ones…
hunter (05:39:24) :
…a comparison between global observations and a prediction for Armagh is completely meaningless. You might as well compare the global upward temperature trend with the temperature trend in my house when the heating goes off.
Actually in the original paper Butler and Johnson show temperatures for Armagh, CET (England) and Eastern US, although admit the correlation with the US is reduced in the earlier part of the series. The Armagh series is interesting because of its length and because Ireland’s climate is so affected by the Atlantic; it has been shown to be affected by/correlated with the North Atlantic Oscillation.
Doug Keenan has rigorously chased tree ring data from Ireland for this reason also, as the series was a long one and therefore potentially valuable to climate research, but it has not been made available.
anna v (06:46:12) :
I hope that when climate “science” clears its act, the vocabulary of “forcing” should go the way of the phlogiston.
I’m so glad you said that – I’ve always hated the term too. It seems so Post Normal Science.
Icarus, care to show a graph of OLR through end of November 2009 in order to verify your statement?
http://www.esrl.noaa.gov/psd/data/gridded/data.interp_OLR.html
You could also go to climate4you.com and see a graph already done.
anna v (22:25:34) :
When one is dealing with dynamical chaos, and climate has been one of the first examples of dynamical chaos, the variations of amplitude against the variables of the problem, though not random, are unpredictable by ordinary methods…………………………interesting…..
I will wait and see what has happened in ten years time.
Now THAT makes the most sense to me.
I’m happy to see the increasingly obvious complexity exposed by conjecture even if we haven’t the yet tools to measure or even adequately think about it. Keep trying.
I’d want to live for another ten/fifty/hundred years just to see what new questions we can ask. If we have misleading results from the latest “science”, we waste time and money pursuing blind alleys. Imagine how many people it takes, fanning out in every direction, for a few to stumble upon something truly worthy of consequential study.
I envision the current state of “climate science”: A bunch of myopic white coated people jammed into a small closet at the end of a long hall in an abandoned building desperately trying to bolt shut a door no one wants to open anyway. ( Skype-ing each other on their iPhones as they slurp down their Starbucks.) I say, someone go chain it shut!
“Low Prices on Morphic resonance
Qualified orders over $25 ship free”
A Google Giggle.
.
magicjava, Dr. Svalgaard, Pam,
One slight point of contention in regards to warmer sun /= warmer earth.
If you go out to http://www.climate.gov (what I consider to be a reliable IPCC “consensus” resource) and check their solar output/irradiance information there appears to be a slight long term upward trend. According to them (NOAA runs the site) that change in solar output accounts for “less than 10%” of observed warming – it does not say no relationship whatsoever.
I think a big part of the problem we’re seeing here in this thread, and the debate on many other technical issues around “global warming” is that there is a big difference between not a major factor or can’t explain all of it, and has no bearing whatsoever.
Just as with the assertion that UHI has no effect whatsoever on the surface temperature record, the idea that more solar output will not affect temperatures is, IMO, at its core illogical (not saying it’s not possible but I would categorize either as an extraordinary claim).
Maybe I’m misreading here, but I believe the core of the disagreement here is around the choice and quality of proxies, and the assertion that the sun is highly variable with a high correlation to historical temperatures vs. a sun that is mostly constant with little correlation. Please correct me if I’m wrong on this.
The one thing I might want to add to the conversation, is that when you look at the core issue (global warming trend expressed through the surface temperature records), and the complexity of the climate system you have to be careful not to fall into the trap of picking a favorite explanation. There are many contributory causes, and one thing is unlikely to explain everything. In no particular order: manipulation of the temperature records (homogenization, adjustments, etc), land use, UHI, cloud behavior, solar variations, cosmic rays, particulates, makeup of the air (water vapor, GHG’s, etc), just to name a few and I’m probably mising a bunch. The whole CAGW scare was, IMO, caused by an overemphasis on a single variable to the point where Lacis (co-author to Hansen) posits that it is the control knob for the climate. We cannot allow ourselves to fall into the same trap.
Just my 2 cents, feel free to shoot holes in it!