Steven Goddard writes below that he agrees with the prediction I made in late 2009 that we’d see another 500,000 km2 of Arctic sea ice recovery in 2010. The Arctic Oscillation seems to be negative again, and according to NSIDC, this figures greatly in making thicker ice thus lowering summer losses. – Anthony

Source: Climate Prediction Center
NSIDC regularly puts out a news article describing the deteriorating state of the Arctic, called the Sea Ice News. In their May 5, 2008 article, they stated:
…the Arctic Oscillation was in its positive phase through the winter season, associated with a wind pattern helping to flush thick ice out of the Arctic, leaving thinner ice. This is one of the factors helping to set the stage for pronounced ice losses this summer.
Additionally, Dr. Walt Meier from NSIDC told WUWT:
The NAO/AO (Arctic Oscillation) is a particularly prominent one and a substantial amount of the decline in the sea ice during the late 1980s and early 1990s could be attributed to a strong positive mode during winters because the positive mode favors the loss of thicker ice (through drift) that is less likely to melt during summer.
In their January 5, 2010 article NSIDC states that we are in an “Extreme negative phase of the Arctic Oscillation” which can be seen in this NOAA graph below. Oddly (but not surprisingly) the article failed to mention how this affects drift.

If a positive Arctic Oscillation flushes out the Arctic into the Atlantic, the implication is that a negative phase would tend to retain ice. This indeed appears to be the case. Arctic buoys show very light polar drift this winter.

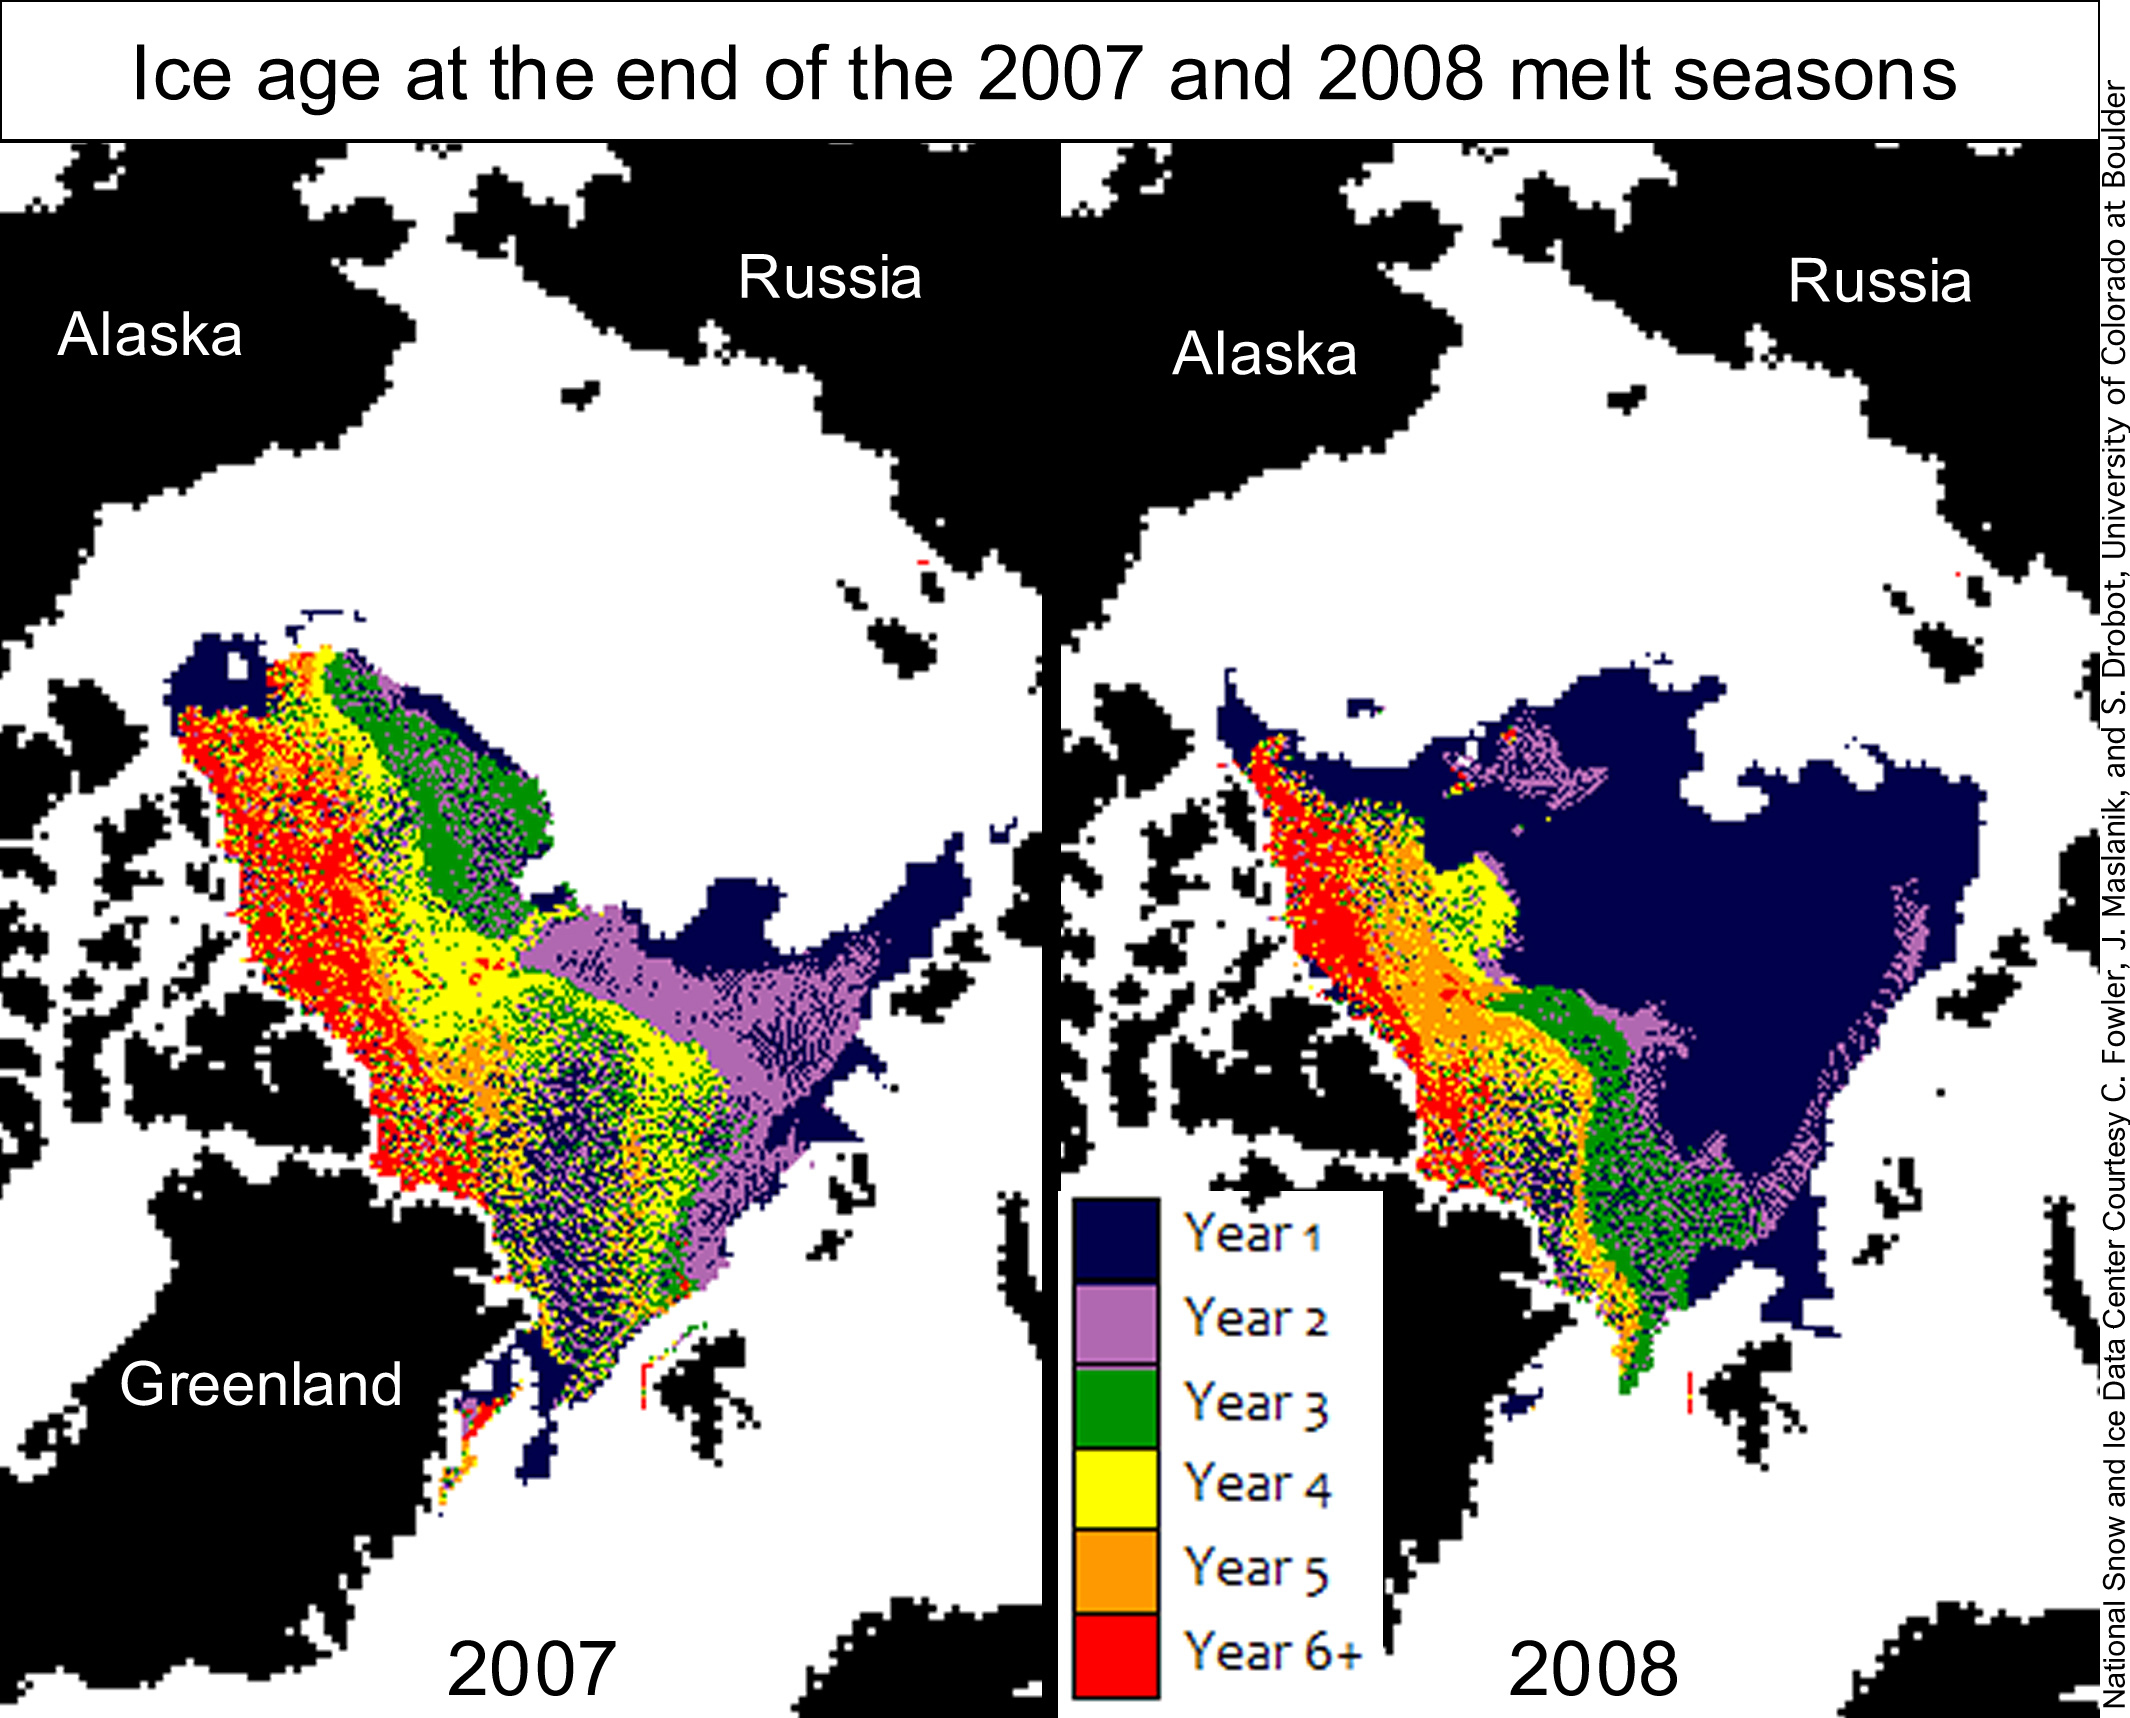
NSIDC made a big deal about loss of multi-year ice in the Arctic during 2007-2008, but this was due more to drift in the winter than melting in the summer, as can be seen in the NSIDC map pair below. Note that most of the 2007 multiyear ice was replaced by first year ice after the 2007 melt season ended and (necessarily) before the 2008 melt season started. The only way this could have happened was due to drift during the 2007-2008 winter, i.e. it could not be the result of summer melt -because ice only forms in the winter.

If the ice is not drifting (i.e. not under tensile stress) the concentration should be high. This indeed appears to be the case. According to UIUC maps, sea ice concentration is high (above 90%) across the Arctic Basin.
http://arctic.atmos.uiuc.edu/cryosphere/NEWIMAGES/arctic.seaice.color.000.png
The Arctic ice minimum extent increased by about 25% between 2007 and 2009, and many indications (negative AO, light drift, high concentration) point to the idea that it will continue to increase in 2010.

http://www.ijis.iarc.uaf.edu/seaice/extent/AMSRE_Sea_Ice_Extent.png
We can also expect that the average age of the ice has increased this winter, continuing a trend started in 2009.

Here’s your chance to weigh in:
Prediction: Arctic Ice Will Continue to Recover this Summer
NSIDC regularly puts out a news article describing the deteriorating state of the Arctic, called the Sea Ice News. In their May 5, 2008 article, they stated:
the Arctic Oscillation was in its positive phase through the winter season, associated with a wind pattern helping to flush thick ice out of the Arctic, leaving thinner ice. This is one of the factors helping to set the stage for pronounced ice losses this summer.
Additionally, Dr. Walt Meier from NSIDC told WUWT:
The NAO/AO (Arctic Oscillation) is a particularly prominent one and a substantial amount of the decline in the sea ice during the late 1980s and early 1990s could be attributed to a strong positive mode during winters because the positive mode favors the loss of thicker ice (through drift) that is less likely to melt during summer.
In their January 5, 2010 article NSIDC states that we are in an “Extreme negative phase of the Arctic Oscillation” which can be seen in this NOAA graph below. Oddly (but not surprisingly) the article failed to mention how this affects drift.

If a positive Arctic Oscillation flushes out the Arctic into the Atlantic, the implication is that a negative phase would tend to retain ice. This indeed appears to be the case. Arctic buoys show very light polar drift this winter.

NSIDC made a big deal about loss of multi-year ice in the Arctic during 2007-2008, but this was due more to drift in the winter than melting in the summer, as can be seen in the NSIDC map pair below. Note that most of the 2007 multiyear ice was replaced by first year ice after the 2007 melt season ended and (necessarily) before the 2008 melt season started. The only way this could have happened was due to drift during the 2007-2008 winter, i.e. it could not be the result of summer melt -because ice only forms in the winter.
If the ice is not drifting (i.e. not under tensile stress) the concentration should be high. This indeed appears to be the case. According to UIUC maps, sea ice concentration is high (above 90%) across the Arctic Basin.

http://arctic.atmos.uiuc.edu/cryosphere/NEWIMAGES/arctic.seaice.color.000.png
The Arctic ice minimum extent increased by about 25% between 2007 and 2009, and many indications (negative AO, light drift, high concentration) point to the idea that it will continue to increase in 2010.

http://www.ijis.iarc.uaf.edu/seaice/extent/AMSRE_Sea_Ice_Extent.png
We can also expect that the average age of the ice has increased this winter, continuing a trend started in 2009.
Poll:
What will the 2010 Summer Arctic Sea Ice Extent Be?
It will be greater than 2009
It will be greater than 2008 but not 2009
It will be less than 2007
It will be near normal
The North pole will be “ice Free” in 2010
A point not noted by any comments so far is thet the scale against which the NAO is measured was extended in December to read as low as -6, previously it measured to -5 and that had never been reached.
As for those suggesting the Solar max causing record melt. Although the sun looks as though it is waking from i’s slumber with a succession of sunspots this year, the Sloar Maximum will still be much lower that the last 3 cycles, so the effect will be less pronounced, also, why do people think we have a 5 year lag in cooling but no lag on warming? The Solar max will not help stabilise temps much before 2015
I’ve never seen any evidence of sunspot count affecting ice extent. Antarctic ice has been increasing and Arctic Ice has been decreasing over the last 30 years. The 1980s had unusually high ice extent and age, when solar activity was at a 300 year high.
2007 was an unusual year because of all the older ice which blew into warm waters of the North Atlantic.
Where’s Pen Hadrow when you need him? Send in Pen and his crack team of ice measurers… They’ll sort it out!
“”” Phil. (15:47:49) :
George E. Smith (14:42:15) :
See here George:
http://nsidc.org/seaice/processes/thermodynamic_growth.html
Note that ice thickens from below so the heat is lost through the ice to cool the layer of water just below the ice, as the ice thickens the rate of conduction drops therefore slowing the rate of ice accumulation. Also for the fresh ice to form a layer of water must first be cooled since the denser, cooler surface water sinks before it freezes. “””
Well I don’t have a problem with any of that Phil; my point was that increases in area of sea ice, rather than increases in thickness, must be largely due to open water freezing at the surface. Certainly if it tried to freeze under water, the lower density ice would immediately rise to the surface; so yes I believe that the surface water must get down to freezing, and the water below that is presumably denser for some reason; such as the sinking your describe. I assume that increase in pressure with depth lowers the freezing point further , so the deeper water can’t freeze before the surface water.
Once you have surface ice, I don’t have a problem with the growth process slowing due to the ice insulation. I presume that the expulsion of salt from the ice raises the salinity of the boundary layer, and also lowers the freezing point.
I’ve heard a few people comment about the “unusual” nature of 2007’s low sea ice anomoly as it relates to ice getting “blown” into the warm waters of the arctic. As though it was all wind (and not any temperature anamolies) that caused the low ice levels. Of course it was both. See:
http://nsidc.org/news/press/2007_seaiceminimum/20071001_pressrelease.html
For a nice analysis of what happened.
But whether it be solar radiation, wind, or warmer oceans in the arctic region, they all ultimately represent energy, and AGW (whether it exists or not) is fundamentally about the energy budget of the earth. Wind is just one form of that energy budget.
If we don’t hit a new record low arctic summer sea ice minimum in the next 5 years, (and I maintain we will in 2011, and then again in 2012 & 2013) then I would have my serious doubts about the ability of human activity to seriously impact earth’s energy balance in any meaningful way, and even concede that all natural variability far outweighs any human forcings to the energy balance. i don’t however, think that is the case. We haven’t had a significant positive arctic sea ice anomoly since 2003, and have in fact averaged around a million sq. km in the negative or under the normal levels based on the average over the previous 20 years:
http://arctic.atmos.uiuc.edu/cryosphere/IMAGES/sea.ice.anomaly.timeseries.jpg
If would take a huge amount of energy to be “pumped” out of the arctic, to reverse the negative trend. I don’t see that happening, in fact, with the negative AO’s of this winter, quite the opposite…energy is being pumped into the arctic and in general have been warmer than average in the region, especially over Greenland. Yesterday is was warmer in Greenland than in Nashville and Memphis.
Daryl M (13:52:47)
I have some comments / questions.
According to JAXA, the peak for 2008 was greater than 2009 so the second choice in the poll doesn’t make any sense.
++++
Peak? Did you notice the poll question said “summer”? We’re discussing predictions for minimums reached in September, not maximums reached in March.
Can they be related? Sure. I made that point upstream when I declined to go along (yet) with a prediction of > 2009. But the March peak is not the only factor in the eventual September minimum. . . multi-year ice, winds, tide, cloud cover in the summer, and (of course) summer temperatures and the early/late/average onset of Fall all play a role.
“Ground temperatures in Canada and Greenland were above normal, but not that much. Also, the MSU near-surface readings had a much lower anomaly than TLT.
My point is that I think the satellite TLT readings are exaggerated for January because of the elevation they are measured at. In 1998, UAH and RSS showed a much larger spike than GISS or Had-Crut.”
I know it’s only one station, but the Summit camp station on the Greenland Ice Cap has had an outlandishly warm winter. Although I have been unsuccessful in finding climate normal info for Summit, the mean temperature for the month of Januarywas around -29 C. My best guess as to the avg Jan tmean temp is -40 C. January was warmer than December, which was warmer than November!.
R Gates,
In 2007, the ice started in a “weakened state” (as NSIDC put it.) That was because much of the older ice was carried away by drift during the winter, leaving large areas of thin, first year ice that had formed late in the winter.
The point is that this year both the new ice and old ice has not been moving very much, and should be thicker than 2007. BTW WUWT predicted growth in multi-year ice for 2010 nearly a year ago.
http://wattsupwiththat.com/2009/04/15/why-third-year-arctic-ice-will-increase-next-year/
1962-1987 Last cool period [winters only]
Total number of winters 26
Number of winters below base line norm 1961-1990 18 or 69 % [say 70%]
Number of winters where AMO is negative 23 or 88%
Number of winters AO is negative 19 or 73%
Number of winters with AO negative all winter 10 or 38% [during 1988-2008 only 3 winters had negative AO all winter]
Number of winters where PDO is negative 15 or 58 % [Mostly early part 1962-1976] [affects jet streams and strength of westerlies?]
Number of winters NAO is negative 13 or 50 % [mostly 1960’s -8]
AO 1950-2009 [60 years]
Number of winters [DEC, JAN, FEB] negative all winter 18 or 30%
Of the 18 all negative winter AO 11 or 61% went negative to March as well[cool spring?]
Of the 18 all negative winter AO 13 or 72 % had negative months into the spring and summer [cool year?]
Severity of winter climate during the past cold spells was stongly influenced by the presence of negative AMO and AO and PDO
If a similar cool pattern develops for the next 20-30 years . then there will plenty of ice to go around in the Arctic.
cmbclean,
Summit Camp is above 10,000 ft. elevation which is close to the TLT 14,000 ft. height. Most of the Canadian Arctic is close to sea level.
cbmclean:
I was reading your post and noticed Yellowknife Canada is very much above its normal temp. On this webpage you can see current temps and look at the almanac for normal temps.
Current temp:
http://www.myforecast.com/bin/detailed_forecast.m?city=54390&metric=true
Historical information
http://www.myforecast.com/bin/climate.m?city=54390&metric=true
I can see that Yellowknife is well above normal temps at this time. I just do not undrestand this phenomena. I live close to Omaha Nebraska which is below normal temperatures at this time, the cold air we are receiving is coming from Central Canada. But the temps in Canada are well above their normals. I don’t know why this happens.
Re: Tenuc (10:34:25)
I have a gut feeling you are right. There’s only so much cold air to go around and it seems to be getting blown out regularly in this present weather pattern. Of course, that could stop at any time and we could get calm conditions in the arctic, but I’m just guessing we won’t have that happen soon.
pt 1. Steve, you da man. Solar anything has nothing to do with Arctic Ice. The tilt of good ‘ol planet Earth drives Arctic ice formation.
pt 2. The AO does INDEED have lots and lots to do with Fram Strait ice exit. Maybe all the greenies can go up there and twirl their fingers really fast (before they freeze off) the other way and turn the wind around to send ice out of the Arctic basin. Then they can say, “See? I told you so!” What exactly that is I haven’t figured out yet, other than to surmise GIGO.
pt 3. Anybody worth a tinker’s dam should be coming up with a study on the AO, including 3 month running average, short term and long-term oscillations, and side indicators of change, along with a nifty name for positive and negative events and conditions. I think we should use names from the Eskimo language in the area in honor of the hearty souls who withstood this environment well enough to have babies in it. Anybody here know Eskimo?
SO….somebody download the AO data and get cracken on the 3 month running average thingy, stealing methodology unashamedly from ENSO (but with atmosphere data, not SST data), to come up with understandable understandings about the AO. And you have to be creative enough to come up with cute names that can withstand the cuteness of El Nino and La Nina.
Ready, set, go……….!
Steven Goddard,
Thanks for the informative article. At times I get a little tired of articles about Climategate hoaxes, as they are depressing, while articles such as yours, about our world as it is, fill me with wonder.
You’re a brave man to make a forecast. I do it too, but usually don’t tell anyone. If I do, I make sure not to bet more than a nickel. For every one thing I’ve learned about meteorology I have five new questions. I’m fairly certain our world’s weather will forever surprise people who think they have it all figured out.
R. Gates: You’re also brave to venture a prediction. However make sure to avoid the word “unprecedented.” Studies of the arctic shoreline by geologists show there have been times when it was shaped by surf, rather than ice, in the past.
Also archeologists have studied the campsites of the very first people to walk the shores of the Arctic Ocean after the last ice age, and, in a treeless landscape, these ancient people burned driftwood for heat and cooking. This suggests arctic rivers were washing wood northwards from southern lands, and dumping the wood into an Arctic Ocean which was ice-free enough of the time to allow driftwood to collect along its shores.
If the reduced abedo-effect of an ice-free arctic didn’t destroy the earth back then, why should it now?
I’d like to see some calculations of what the albedo-effect actually is. For example, there was a nearly 2 million square km difference between ice extent between 2003 and 2007. What was the difference, in terms of energy bounced back to space?
Don’t forget that ice extent is at its lowest in September, when the sun is right down on the arctic horizon. It seems even the sea surface would reflect a lot of sunlight, at that angle.
Compare that with the angle of the sun over Washington DC right now. How many square km of the USA are covered with snow? How much heat is reflected back into space?
Until I see actual numbers, the albedo-effect seems nothing but a vague theory to me, and may indeed be nothing but an old maid’s worry.
None of these really roll off the tongue do they.
Added – illaksak (eellaksak)
Adrift – savidyauyok
Blows (wind) – subluarpok
Blows a little – subluksungnartok
Coming (is) – krainyok
Departs (leaves) – audlarpok
Klingon:
In – ‘el
Out – lel
Ref – It’s always Marcia, Marcia (09:52:21) :
“The North pole will be “ice Free” in 2010 2% (3 votes)
“Three trolls stopped by.”
____________
The “Trolls” are up a little as I type. I think you’re mistaken in your characterization however, at least I claim exception, and I doubt that any real trolls hang around in these temps for very long. I felt uneasy about the choices. I guess they didn’t give me enough choice and when I reached the last I thought for a moment about the old advice about taking the road less traveled. “D”, for a very brief instant, seemed the most likely to be true if you remember that we seem to know so little –no offense to anyone– about how climate works. Isn’t it amazing that we can (or could) walk on the Moon but we can’t be very precise about how much more or less ice we’ll have in the Arctic for the 2010 season? I guess I tend to be contrary at times. It seems, for all we “know”, that the Arctic could just as easily be iceless during most of an ice age:-)
How else do we explain all those glaciers? The cold must be down here and not up there.
I’m contrary tonight not trollish.
I want to understand the AO a bit more before I feel I have what it takes to predict it’s winds and pressure systems that long out. What do we know about the predictive signs of this thing going positive or negative? It is quite obvious that NOAA/NASA hasn’t got it down.
geo (17:17:21) :
Daryl M (13:52:47)
I have some comments / questions.
According to JAXA, the peak for 2008 was greater than 2009 so the second choice in the poll doesn’t make any sense.
++++
Peak? Did you notice the poll question said “summer”? We’re discussing predictions for minimums reached in September, not maximums reached in March.
Can they be related? Sure. I made that point upstream when I declined to go along (yet) with a prediction of > 2009. But the March peak is not the only factor in the eventual September minimum. . . multi-year ice, winds, tide, cloud cover in the summer, and (of course) summer temperatures and the early/late/average onset of Fall all play a role.
Doh! I never noticed the poll was for the summer minimum. I jumped to the conclusion we were talking about the winter maximum since we are coming up on it soon.
Notwithstanding that, I still question whether we are heading for an increase in the summer ice, since the winter maximum is not looking like it will it will set any records. In fact, it looks like it will be on the low side. So if the 2010 winter maximum is lower than normal, the summer minimum will be disadvantaged out of the gate.
Here the latest SST Anomaly from UNISYS-I like to use them because they
don’t use screaming NOAA yellow and oranges for normal to slightly
above normal:
http://weather.unisys.com/surface/sst_anom.html
My own take-an layman’s point of view-but El Nino’s going to augur in by the
end of Feb or first of March.This isn’t the Mulit-year El Nino of Warmists dreams….
I’d cheer for the ice trying to break above 16 on the graph, but I haven’t done the math to see if that would freeze Paris. I’m not worried about the Thames or the Low Countries, as they have cold-weather traditions already.
Steve Goddard (18:04:47) :
cmbclean,
Summit Camp is above 10,000 ft. elevation which is close to the TLT 14,000 ft. height. Most of the Canadian Arctic is close to sea level.
Yes, RSS don’t use data from that location because it is over 3000m ASL.
TLT altitude is lower than 14,000 ft, that is the weighting function for channel 5, TLT is a composite channel (weighted difference of near-limb and near-nadir views done to remove the interference from the stratospheric cooling).
Phil,
Looks to me like TLT is 14,000 feet?
TLT = Temperature Lower Troposphere MSU 2 and AMSU 5
http://www.remss.com/msu/msu_data_description.html
Daily global average temperature at: 14,000 ft / 4.4 km / 600 mb (ch05)
http://discover.itsc.uah.edu/amsutemps/data/amsu_daily_85N85S_ch05.r002.txt
Caleb,
I’m a scientist/engineer and I personally find the science more interesting than the politics, but ultimately politics always drives science. The National Labs were created out of political expediency (to make the bomb) and they still switch direction with each new administration.
What is interesting about the IPCC disaster is It’s historic nature, on a scale not seen in centuries. I suspect it won’t be long before people like Phil Jones start talking about the political pressure they were under. What does he have to lose at this point?
Two claims here which are not quite accurate without addendum
1) Antarctic sea ice is increasing. The trend is very slightly up, but still not by very much at all. the last two years have been on the average for instance.
2) The exceptional melt of 2007 was not just caused by wind patterns, it was coupled with exceptionally clear sunny days too. The latter keeps getting forgotten in some quarters.
Andy