Steven Goddard writes below that he agrees with the prediction I made in late 2009 that we’d see another 500,000 km2 of Arctic sea ice recovery in 2010. The Arctic Oscillation seems to be negative again, and according to NSIDC, this figures greatly in making thicker ice thus lowering summer losses. – Anthony

Source: Climate Prediction Center
NSIDC regularly puts out a news article describing the deteriorating state of the Arctic, called the Sea Ice News. In their May 5, 2008 article, they stated:
…the Arctic Oscillation was in its positive phase through the winter season, associated with a wind pattern helping to flush thick ice out of the Arctic, leaving thinner ice. This is one of the factors helping to set the stage for pronounced ice losses this summer.
Additionally, Dr. Walt Meier from NSIDC told WUWT:
The NAO/AO (Arctic Oscillation) is a particularly prominent one and a substantial amount of the decline in the sea ice during the late 1980s and early 1990s could be attributed to a strong positive mode during winters because the positive mode favors the loss of thicker ice (through drift) that is less likely to melt during summer.
In their January 5, 2010 article NSIDC states that we are in an “Extreme negative phase of the Arctic Oscillation” which can be seen in this NOAA graph below. Oddly (but not surprisingly) the article failed to mention how this affects drift.

If a positive Arctic Oscillation flushes out the Arctic into the Atlantic, the implication is that a negative phase would tend to retain ice. This indeed appears to be the case. Arctic buoys show very light polar drift this winter.

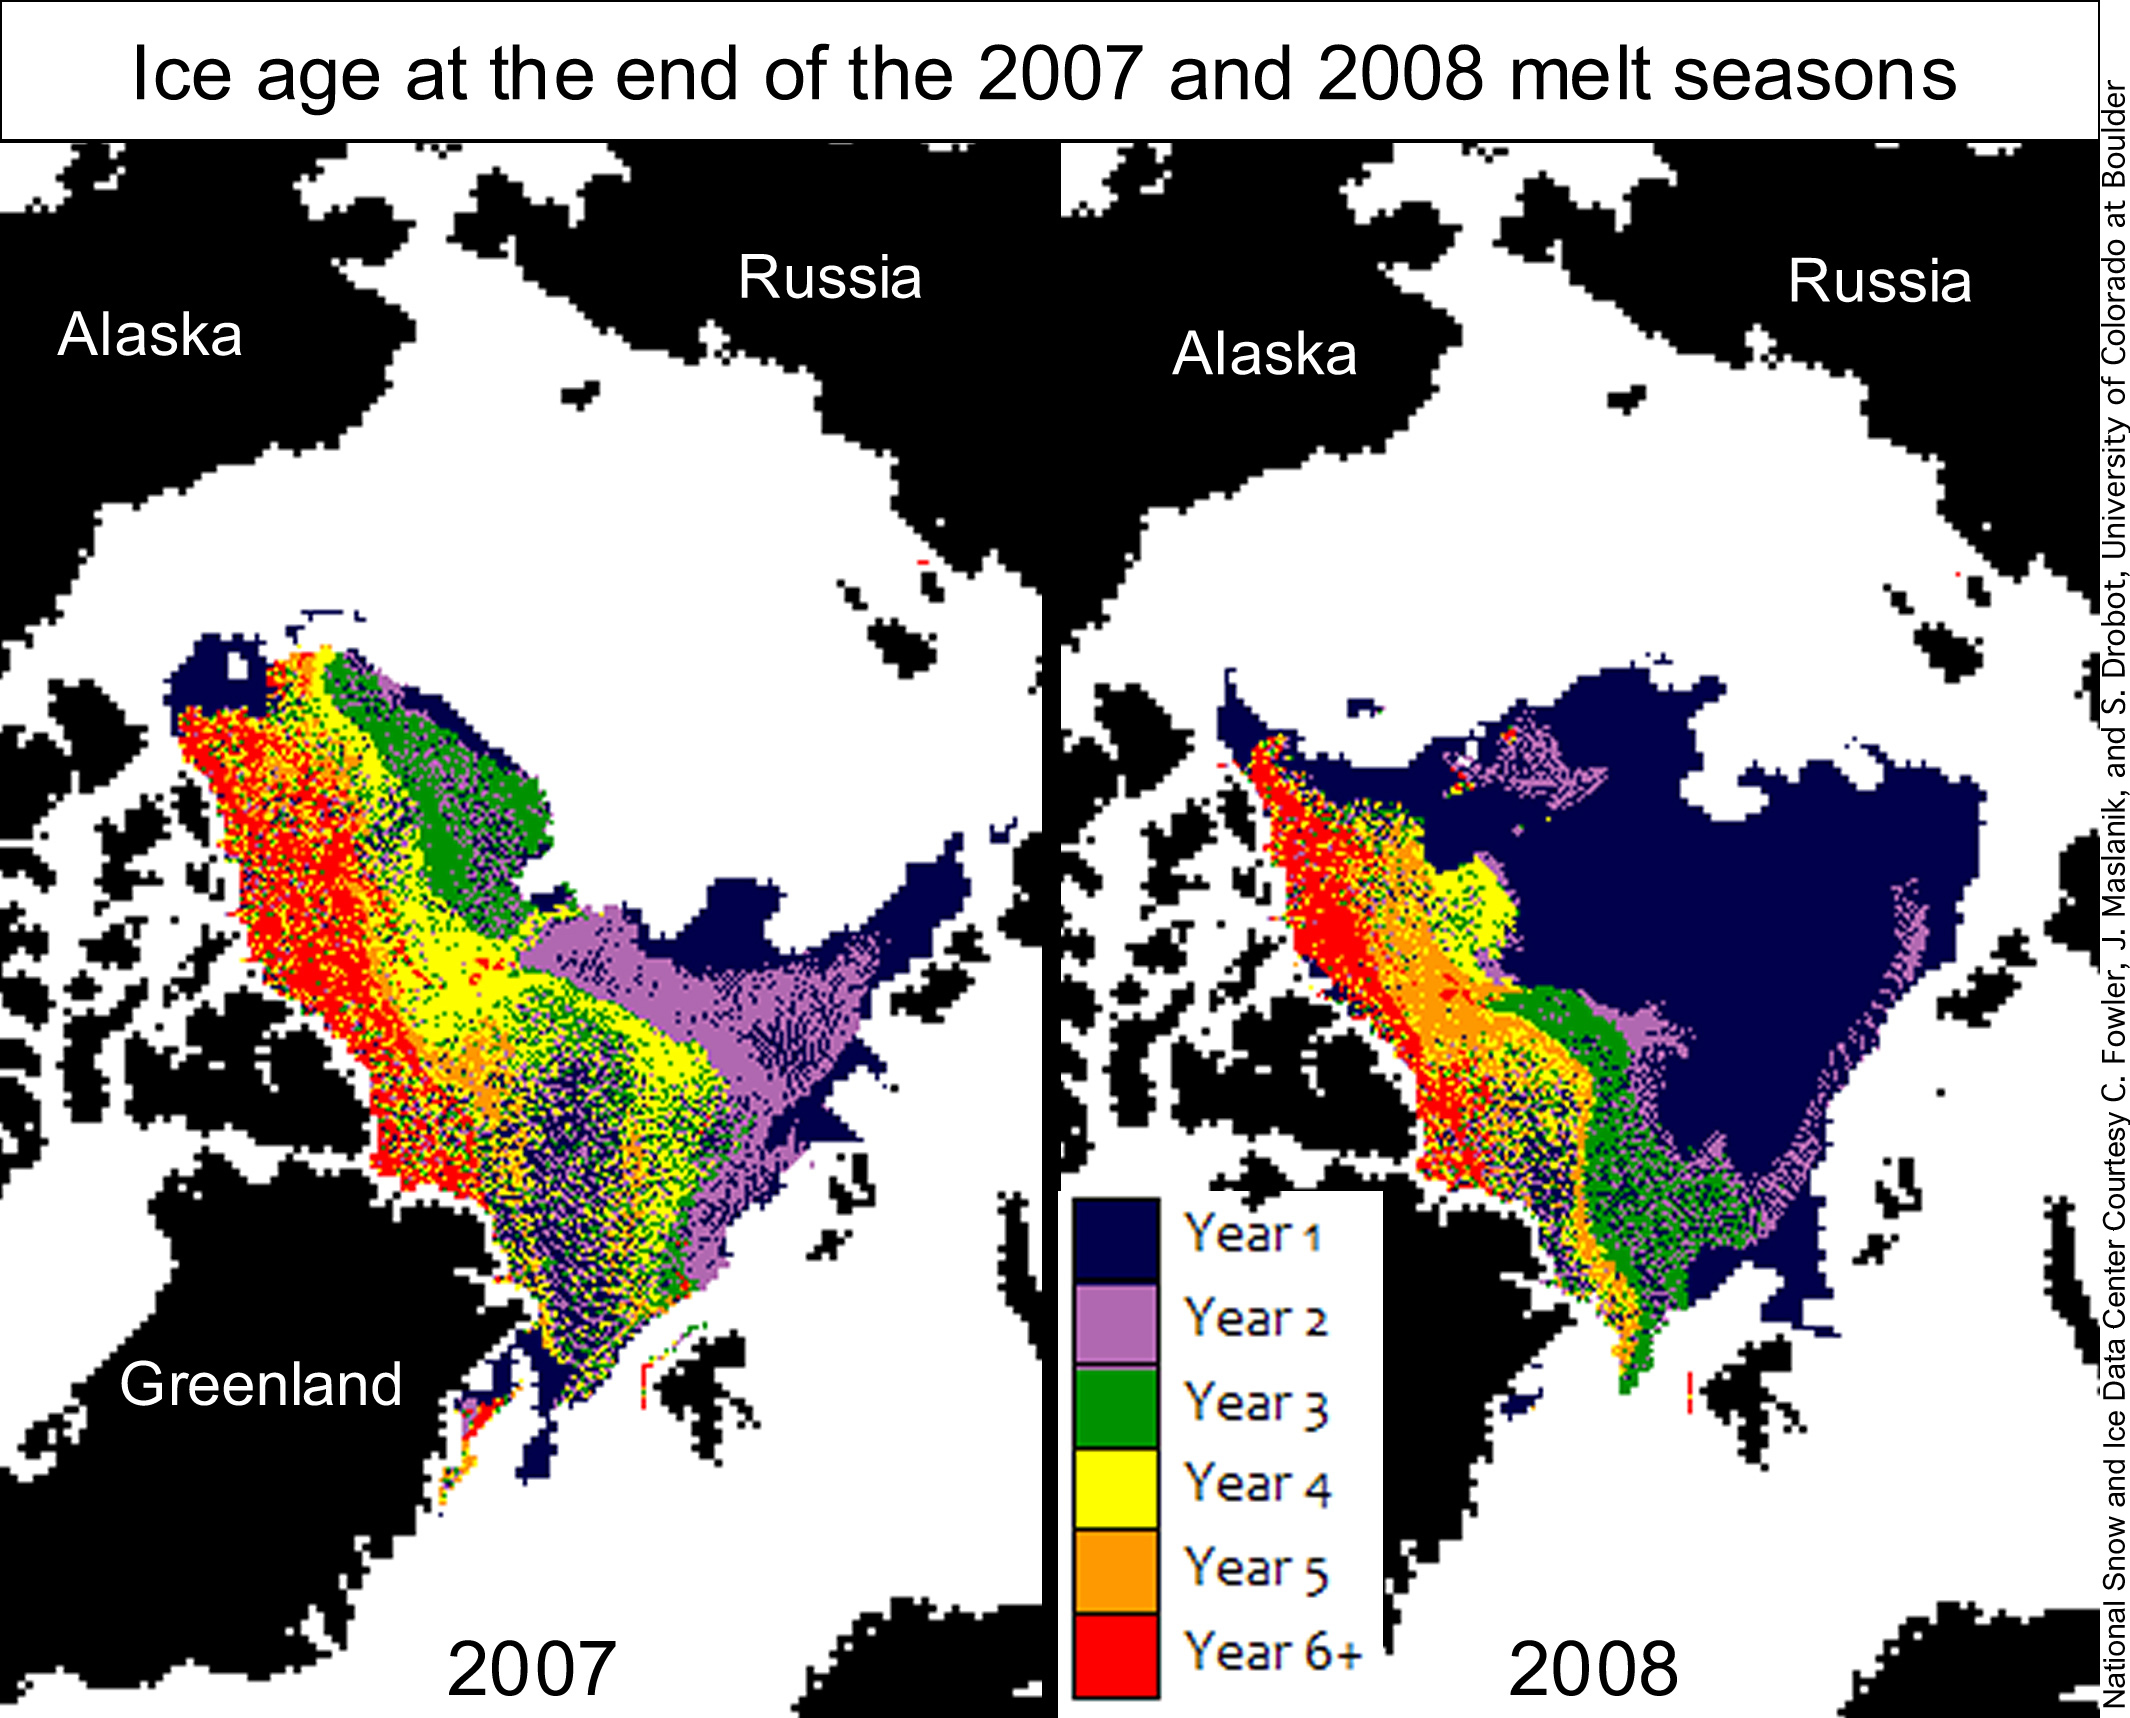
NSIDC made a big deal about loss of multi-year ice in the Arctic during 2007-2008, but this was due more to drift in the winter than melting in the summer, as can be seen in the NSIDC map pair below. Note that most of the 2007 multiyear ice was replaced by first year ice after the 2007 melt season ended and (necessarily) before the 2008 melt season started. The only way this could have happened was due to drift during the 2007-2008 winter, i.e. it could not be the result of summer melt -because ice only forms in the winter.
If the ice is not drifting (i.e. not under tensile stress) the concentration should be high. This indeed appears to be the case. According to UIUC maps, sea ice concentration is high (above 90%) across the Arctic Basin.
http://arctic.atmos.uiuc.edu/cryosphere/NEWIMAGES/arctic.seaice.color.000.png
The Arctic ice minimum extent increased by about 25% between 2007 and 2009, and many indications (negative AO, light drift, high concentration) point to the idea that it will continue to increase in 2010.

http://www.ijis.iarc.uaf.edu/seaice/extent/AMSRE_Sea_Ice_Extent.png
We can also expect that the average age of the ice has increased this winter, continuing a trend started in 2009.

Here’s your chance to weigh in:
Prediction: Arctic Ice Will Continue to Recover this Summer
NSIDC regularly puts out a news article describing the deteriorating state of the Arctic, called the Sea Ice News. In their May 5, 2008 article, they stated:
the Arctic Oscillation was in its positive phase through the winter season, associated with a wind pattern helping to flush thick ice out of the Arctic, leaving thinner ice. This is one of the factors helping to set the stage for pronounced ice losses this summer.
Additionally, Dr. Walt Meier from NSIDC told WUWT:
The NAO/AO (Arctic Oscillation) is a particularly prominent one and a substantial amount of the decline in the sea ice during the late 1980s and early 1990s could be attributed to a strong positive mode during winters because the positive mode favors the loss of thicker ice (through drift) that is less likely to melt during summer.
In their January 5, 2010 article NSIDC states that we are in an “Extreme negative phase of the Arctic Oscillation” which can be seen in this NOAA graph below. Oddly (but not surprisingly) the article failed to mention how this affects drift.

If a positive Arctic Oscillation flushes out the Arctic into the Atlantic, the implication is that a negative phase would tend to retain ice. This indeed appears to be the case. Arctic buoys show very light polar drift this winter.

NSIDC made a big deal about loss of multi-year ice in the Arctic during 2007-2008, but this was due more to drift in the winter than melting in the summer, as can be seen in the NSIDC map pair below. Note that most of the 2007 multiyear ice was replaced by first year ice after the 2007 melt season ended and (necessarily) before the 2008 melt season started. The only way this could have happened was due to drift during the 2007-2008 winter, i.e. it could not be the result of summer melt -because ice only forms in the winter.
If the ice is not drifting (i.e. not under tensile stress) the concentration should be high. This indeed appears to be the case. According to UIUC maps, sea ice concentration is high (above 90%) across the Arctic Basin.

http://arctic.atmos.uiuc.edu/cryosphere/NEWIMAGES/arctic.seaice.color.000.png
The Arctic ice minimum extent increased by about 25% between 2007 and 2009, and many indications (negative AO, light drift, high concentration) point to the idea that it will continue to increase in 2010.

http://www.ijis.iarc.uaf.edu/seaice/extent/AMSRE_Sea_Ice_Extent.png
We can also expect that the average age of the ice has increased this winter, continuing a trend started in 2009.
Poll:
What will the 2010 Summer Arctic Sea Ice Extent Be?
It will be greater than 2009
It will be greater than 2008 but not 2009
It will be less than 2007
It will be near normal
The North pole will be “ice Free” in 2010
‘Just to remind, that temperatures in 2005 reached 1940s level and now are heading down again…
??? Janaury 2010 the warmest on record in the troposphere. How is that “headed down again”???
What amazes me is that all the climate scientists contributing to IPCC reports must understand the effects of ice drift and the effects of winds and currents on Arctic sea ice extent (and if they don’t what does that say about their knowledge of their subject).
Yet all public pronouncements seem designed to give the impression that the only factor that affects ice extent is average global temperature. This is so intuitive to the man in the street that it is unlikely to be questioned.
It’s a master-stroke of spin, but totally dishonest and completely unworthy of any true scientist.
If any fair-minded journos are reading this thread, then they could do their readers a great service by explaining that most arctic ice has to be moved out of the arctic before it will melt.
Hey isn’t near normal and more than 2009 about the same thing???
Steven, you said about the january NSIDC article that
” Oddly (but not surprisingly) the article failed to mention how this [the strong negative OA] affects drift”
however the mentioned article clearly states
“While a negative AO leads to warmer temperatures over the Arctic, it also tends to reduce the flow of sea ice out of the Arctic by affecting the winds that can export the ice to warmer waters, where it melts. In this way, a negative AO could help retain some the second- and third-year ice through the winter, and potentially rebuild some of the older, multiyear ice that has been lost over the past few years.”
so what is motivating your comment, exactly?
Great post and comments, Steve.
Klyashtorin and Lyubushin found Arctic sea ice coverage to be cyclical, and negatively correlated to global temperatures, but with an approximate 8 year lag.
http://alexeylyubushin.narod.ru/Climate_Changes_and_Fish_Productivity.pdf?
@ur momisugly TA (09:54:34) :
This may be a dumb question, but if there is less Arctic drift, could that account for the record warmth in Jan. that is due to warmer oceans? Less drift would mean less ice melting and cooling the oceans. Or am I full of it?
Sounds like a smart question to me.
-psi
But early springs are messing up the food chain in the UK.
http://news.bbc.co.uk/1/hi/sci/tech/8506363.stm
You need another option on your poll; “It depends on the wind and currents”.
Mike Ramsey
This notion that AO correlates directly with arctic ice oscillations does not match what the record shows.
I have some comments / questions.
According to JAXA, the peak for 2008 was greater than 2009 so the second choice in the poll doesn’t make any sense.
What is “normal”?
I think it’s wishful thinking that there will be 500,000 km2 more ice than last year. At the rate the 2010 ice extent is growing, it will be lucky to be greater than the 2005-2007 group. If you look at the sea surface temperature anomoly on DMI, the water is unusually warm in the North Atlantic west of Greenland and in the Barents Sea, which are the two areas where the sea ice extent anomoly is is greatest.
I received this e-mail this afternoon
“PEW ENVIRONMENTAL REPORT SAYS MELTING ARCTIC COULD COST $2.4 TRILLION BY 2050
Contact: Ruth Teichroeb in Iqaluit, 867.979.2878 and Brandon MacGillis in Washington, DC, 202.887.8830
Iqaluit, Nunavut, Canada – 02/05/2010 – The Pew Environment Group today released a report that for the first time quantifies the global cost of the Arctic’s declining ability to cool the climate, indicating that the rapid melting of the region could carry a minimum price tag of $2.4 trillion U.S. by 2050.
The report, issued as G7 finance ministers began a two-day meeting in this southeast Baffin Island town, estimates that this year alone the climate cooling value lost by retreating Arctic sea ice and snow and thawing permafrost could be an estimated $61 billion U.S. to $371 billion U.S. On the low end of its projections, the report estimates that these costs could accumulate to almost $5 trillion U.S. by the end of the century if climate change is not abated.
“Putting a dollar figure on the Arctic’s climate services allows us to better understand both the region’s immense importance and the enormous price we will pay if the ice is lost,” said Dr. Eban Goodstein, co-author of the report and an economist who directs the Bard Center for Environmental Policy at Bard College in New York. “At the mid-range of our estimates, the cumulative cost of the melting Arctic in the next 40 years is equivalent to the annual gross domestic products of Germany, Russia and the United Kingdom combined.”
To arrive at the economic cost of Arctic melting, the report’s authors converted projected trends in snow and ice loss and methane releases into carbon dioxide emissions equivalents. Those were multiplied by the social cost of carbon, an estimate by economists of impacts from climate change on agriculture, energy production, water availability, sea level rise and flooding and other factors. This calculation produced the range of initial dollar estimates cited in the report.
The report “An Initial Estimate of the Cost of Lost Climate Services Due to Changes in the Arctic Cryosphere” notes that this region is warming at twice the rate of the rest of the planet. The loss of heat-reflecting sea ice and snow results in the absorption of more solar energy leading to warming. The thawing of permafrost, or permanently frozen ground, releases methane, a potent greenhouse gas. Increased warming from these effects, in turn, leads to more melting and thawing in a feedback loop.
The report calculates that this year alone, Arctic melting may warm the Earth an amount equivalent to pumping three billion metric tons of CO2 into the atmosphere. “That’s equal to forty percent of all U.S. industrial emissions this year or bringing on line more than 500 large coal-burning power plants,” said Dr. Eugenie Euskirchen, co-author of the report and a scientist from the University of Alaska at Fairbanks’ Institute of Arctic Biology.
“The preliminary results in this report show that as the Arctic melts we are losing a hidden treasure: the far north’s crucial capacity to cool the earth,” said Scott Highleyman, international Arctic director for the Pew Environment Group. “We urge the G7 finance ministers to commission a full economic analysis of the global climate services provided by a frozen Arctic and what losing the planet’s ‘air conditioner’ will cost all of us.”
The report was released by the Pew Environment Group’s Oceans North campaign which promotes sound stewardship of the Arctic Ocean. The authors are solely responsible for its content, which was reviewed by more than a dozen economists and Arctic scientists.
===============================================================
Resources:
Dr. Eugenie Euskirchen, University of Alaska at Fairbanks, Institute of Arctic Biology, 907.687.3864, seeuskirchen@alaska.edu
Dr. Eban Goodstein, director, Bard Center for Environmental Policy, Bard College, New York, 503.806.6370, ebangood@bard.edu
Scott Highleyman, Pew Environment Group’s International Arctic director, 360.715.0063, shighleyman@pewtrusts.org”
No comment. Murray
Bets on when the Port of Churchill, Manitoba (on western Hudson Bay) will open for business in 2010, coinciding with sea ice breakup?
In 2009, an early opening was predicted (July 1) but the ice was actually 6 weeks later than that breaking up (Aug. 12), which was 3 weeks later than the average (July 21).
We heard about the late opening in 2009 but not about the fact that an early opening had been anticipated.
“Steven Goddard writes below that he agrees with the prediction I made in late 2009 that we’d see another 500,000 km2 of Arctic sea ice recovery in 2010. The Arctic Oscillation seems to be negative again…” — Anthony
———-
Despite so many predictions going awry when there’s so many variables, especially when it comes to climatic changes, I’m going to have to disagree with both Anthony and Steve Goddard, and say that the warmer winter with the extreme negative AO will bring less sea ice extent in 2010.
It also seems as if roy spencer is amazed at the +0.72 C global temperature anomaly for Jan. 2010, almost exactly where we saw global temperatures during the extreme el Nino year of 1998.
http://www.drroyspencer.com/latest-global-temperatures/
Plus, it certainly appears as if Solar Cycle 24 will be giving us a bit more solar irradiance with the return of sunspots after such an extended solar low for the last few years, with a solar flux in the 90’s and M-class flares.
http://solarcycle24.com/
Rob,
Interesting. I actually wrote this piece about a month ago, and didn’t see that NSIDC AO drift discussion at the time. I wonder if the discussion has been updated since then? The web page has a more recent time stamp than the date of the article.
I guess I’m not getting the finer points of the discussion between Phil and Steve Goddard. Having never been that far up in the arctic (made it to Circle City, in July 1967 (mid summer)) so I couldn’t see the arctic ocean from there; I’m not up on the geography they are talking about.
But a colleague who was in the Submarine Navy is quite familiar with the ice up there including from above and below; and he says, when the sea starts to freeze, it gets really weird, and huge areas can “come and go” in a matetr of an hor or so.
Unless it is really salty up there, I would imagine that the sea freezing point is about -2.5 C; so I guess -3 deg C is a pretty safe freezing temperature.
And unless I am mistaken; the “ice coverage” numbers that at least JAXA is reporting are really areas where at least 15% of the area is actually ice, so as much as 85% could still be open water.
So it seems to me that the biggest changes are actually open water turning to thin first year ice; when the air temperature goes well below -3 deg C, and the temps seem to have been up and down around -20, -25, -30 C; so I would think that the first year ice coverage can be growing, uninhibited by the lower conductivity of thick multi-year ice that Phil seems to be referring to when he talks of the ice being a good insulator.
So isn’t the acreage increase somewhat independent of the thickness increase ?. There’s not much to stop the air water interface from freezing.
Well maybe there’s something I am missing here.
I think Doc lacota has it right. Increasing solar activity means:
1. Greater solar irradiance
2. Less GCR’s
3. Less cloud cover
4. More energy to troposphere & oceans
All this, combined with record amounts of CO2 and methane. Though I still think 2010 summer sea ice mimimum will come in right around 3 million sq. km, but a tiny bit above 2007’s summer minimum. But watch out for 2011, 2012, & 2013. I think we’ll hit 3 successive record lows in a row leading up to the solar max in 2013.
Vincent (09:08:33) :
“It still don’t get why drift favours thinner ice over thicker.”
Heat exchange is a function of volume and surface area. I.E Crushed ice melts faster then an ice cube as crushed ice has a larger surface area as a function of it’s volume. The radiator in you car has a gazillion little fins to maximize surface area.
A single 1″ square ice cube has 6 sq inches of surface area and a volume of 1 cubic inch. A Ratio of surface area to volumeof 6 to 1.
A single 2″ ice cube has 24 sq inches of surface area and a volume of 8 cubic inches. A ratio of surface area to volume if 3 to 1.
Hence, if the wind is blowing the sea ice apart(breaking it into smaller pieces), then it will melt faster.
“”” Harry (14:54:41) :
Vincent (09:08:33) :
“It still don’t get why drift favours thinner ice over thicker.”
Hence, if the wind is blowing the sea ice apart(breaking it into smaller pieces), then it will melt faster. “””
Which means that having a bunch of busibodies charging around the arctic ocean on an icebreaker, carving up the sea ice, is not such a good, or a green idea.
Rob Vermeulen
Hmmm…. I missed the paragraph you quoted when I read the NSIDC news in January. Weird. They didn’t mention anything about drift in the February article.
My bad.
R. Gates (12:25:35) :
??? Janaury 2010 the warmest on record in the troposphere. How is that “headed down again”???
Dear defense secretary, I meant Arctic.
http://climexp.knmi.nl/data/icrutem3_hadsst2_0-360E_70-90N_na.png
But northern hemisphere is heading down as well, now reaching temperature of 1990. If 3-7C warming predictions till 2100 are correct, it should warm during these two decades by 1-3C (northern hemisphere should warm twice the global average).
http://climexp.knmi.nl/data/icrutem3_hadsst2_0-360E_23.5-90N_n_1980:2010a.png
As Rob points out above, NSIDC did address the issue of drift in their January piece. My apologies for having overlooked it, though it definitely supports my conclusions.
Drift favors thinner ice because the mass to surface area ratio is less and it is more easily moved by the wind.
OK, so are the buoy movements normal, or not for a winter season? Is the outflow from the Arctic been normal, or not? Or is this all just a best guess game, like the climate?
R. Gates (14:44:43) :
I think Doc lacota has it right. Increasing solar activity means:
1. Greater solar irradiance
2. Less GCR’s
3. Less cloud cover
4. More energy to troposphere & oceans
All this, combined with record amounts of CO2 and methane. Though I still think 2010 summer sea ice mimimum will come in right around 3 million sq. km, but a tiny bit above 2007’s summer minimum. But watch out for 2011, 2012, & 2013. I think we’ll hit 3 successive record lows in a row leading up to the solar max in 2013.
But, but, but surely your IPCC bible says that the natural phenomena you cite above have no effect on climate?
If they do then CO2 has almost no effect, not to forget that industrial contribution to CO2 is ( and this is generous ) 3.3%.
How can you eat your dinner at a table without legs?
George E. Smith (14:42:15) :
See here George:
http://nsidc.org/seaice/processes/thermodynamic_growth.html
Note that ice thickens from below so the heat is lost through the ice to cool the layer of water just below the ice, as the ice thickens the rate of conduction drops therefore slowing the rate of ice accumulation. Also for the fresh ice to form a layer of water must first be cooled since the denser, cooler surface water sinks before it freezes.