Steven Goddard writes below that he agrees with the prediction I made in late 2009 that we’d see another 500,000 km2 of Arctic sea ice recovery in 2010. The Arctic Oscillation seems to be negative again, and according to NSIDC, this figures greatly in making thicker ice thus lowering summer losses. – Anthony

Source: Climate Prediction Center
NSIDC regularly puts out a news article describing the deteriorating state of the Arctic, called the Sea Ice News. In their May 5, 2008 article, they stated:
…the Arctic Oscillation was in its positive phase through the winter season, associated with a wind pattern helping to flush thick ice out of the Arctic, leaving thinner ice. This is one of the factors helping to set the stage for pronounced ice losses this summer.
Additionally, Dr. Walt Meier from NSIDC told WUWT:
The NAO/AO (Arctic Oscillation) is a particularly prominent one and a substantial amount of the decline in the sea ice during the late 1980s and early 1990s could be attributed to a strong positive mode during winters because the positive mode favors the loss of thicker ice (through drift) that is less likely to melt during summer.
In their January 5, 2010 article NSIDC states that we are in an “Extreme negative phase of the Arctic Oscillation” which can be seen in this NOAA graph below. Oddly (but not surprisingly) the article failed to mention how this affects drift.

If a positive Arctic Oscillation flushes out the Arctic into the Atlantic, the implication is that a negative phase would tend to retain ice. This indeed appears to be the case. Arctic buoys show very light polar drift this winter.

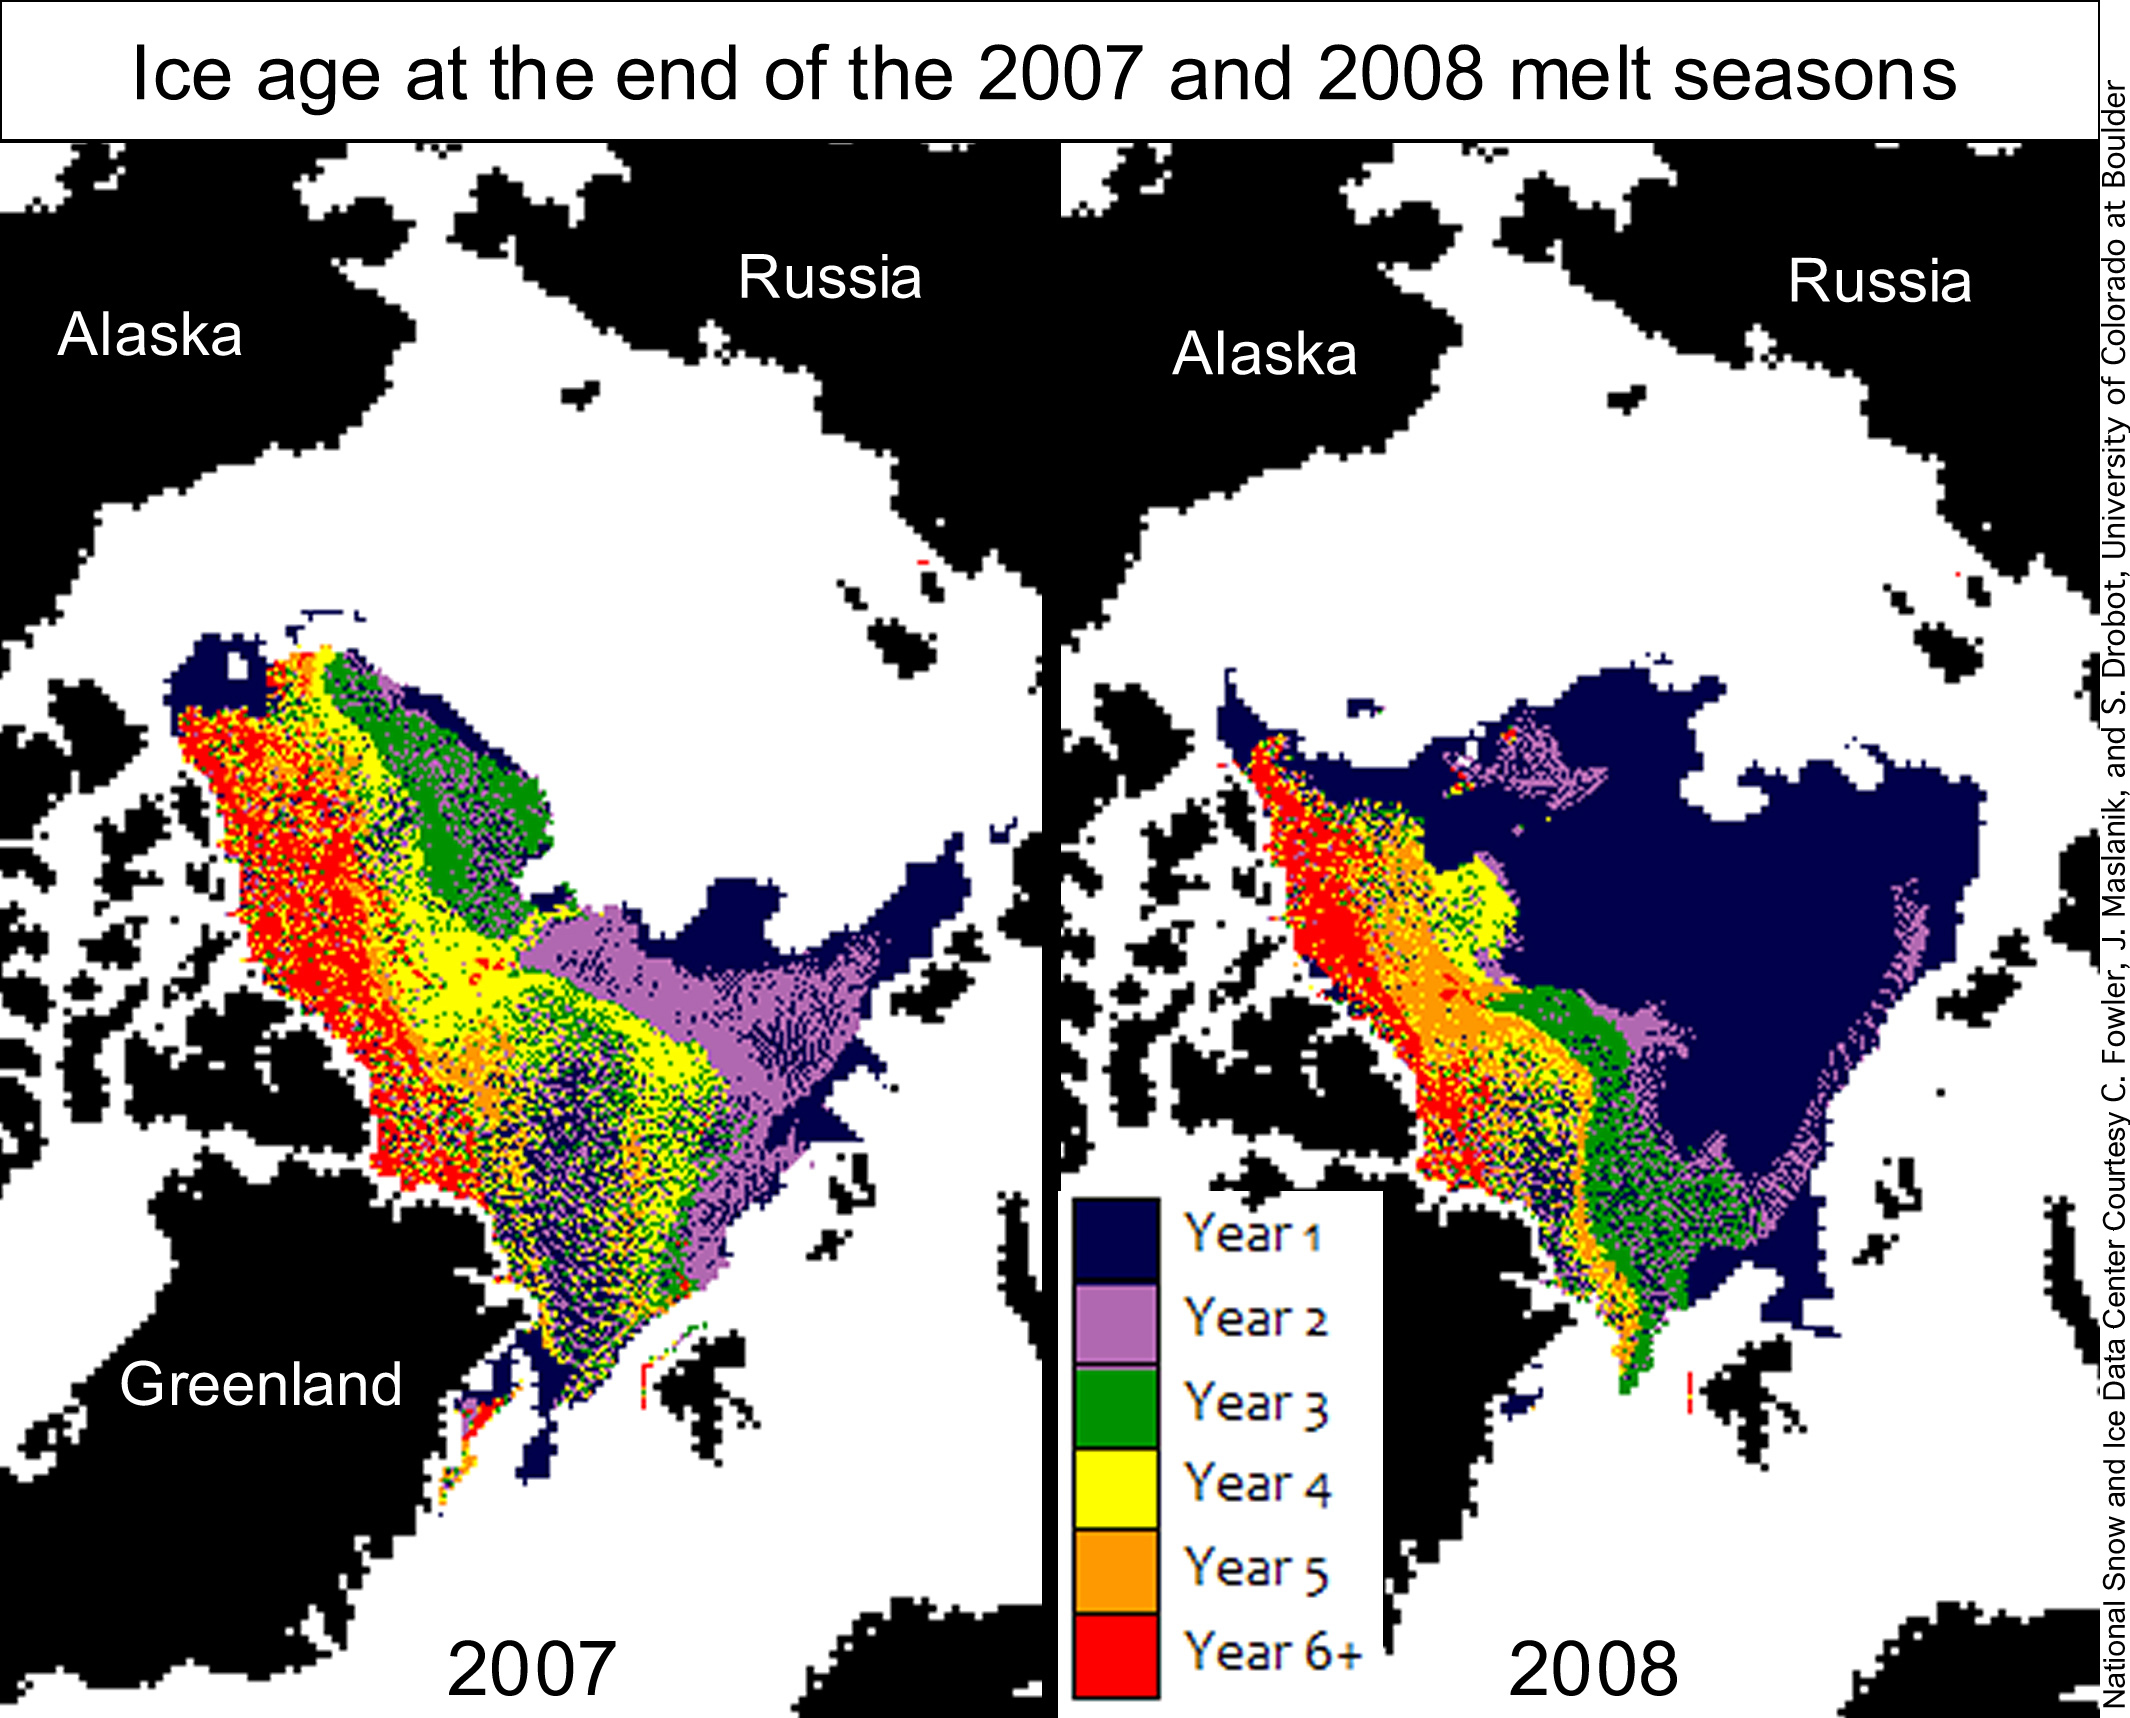
NSIDC made a big deal about loss of multi-year ice in the Arctic during 2007-2008, but this was due more to drift in the winter than melting in the summer, as can be seen in the NSIDC map pair below. Note that most of the 2007 multiyear ice was replaced by first year ice after the 2007 melt season ended and (necessarily) before the 2008 melt season started. The only way this could have happened was due to drift during the 2007-2008 winter, i.e. it could not be the result of summer melt -because ice only forms in the winter.

If the ice is not drifting (i.e. not under tensile stress) the concentration should be high. This indeed appears to be the case. According to UIUC maps, sea ice concentration is high (above 90%) across the Arctic Basin.
http://arctic.atmos.uiuc.edu/cryosphere/NEWIMAGES/arctic.seaice.color.000.png
The Arctic ice minimum extent increased by about 25% between 2007 and 2009, and many indications (negative AO, light drift, high concentration) point to the idea that it will continue to increase in 2010.

http://www.ijis.iarc.uaf.edu/seaice/extent/AMSRE_Sea_Ice_Extent.png
We can also expect that the average age of the ice has increased this winter, continuing a trend started in 2009.

Here’s your chance to weigh in:
Prediction: Arctic Ice Will Continue to Recover this Summer
NSIDC regularly puts out a news article describing the deteriorating state of the Arctic, called the Sea Ice News. In their May 5, 2008 article, they stated:
the Arctic Oscillation was in its positive phase through the winter season, associated with a wind pattern helping to flush thick ice out of the Arctic, leaving thinner ice. This is one of the factors helping to set the stage for pronounced ice losses this summer.
Additionally, Dr. Walt Meier from NSIDC told WUWT:
The NAO/AO (Arctic Oscillation) is a particularly prominent one and a substantial amount of the decline in the sea ice during the late 1980s and early 1990s could be attributed to a strong positive mode during winters because the positive mode favors the loss of thicker ice (through drift) that is less likely to melt during summer.
In their January 5, 2010 article NSIDC states that we are in an “Extreme negative phase of the Arctic Oscillation” which can be seen in this NOAA graph below. Oddly (but not surprisingly) the article failed to mention how this affects drift.

If a positive Arctic Oscillation flushes out the Arctic into the Atlantic, the implication is that a negative phase would tend to retain ice. This indeed appears to be the case. Arctic buoys show very light polar drift this winter.

NSIDC made a big deal about loss of multi-year ice in the Arctic during 2007-2008, but this was due more to drift in the winter than melting in the summer, as can be seen in the NSIDC map pair below. Note that most of the 2007 multiyear ice was replaced by first year ice after the 2007 melt season ended and (necessarily) before the 2008 melt season started. The only way this could have happened was due to drift during the 2007-2008 winter, i.e. it could not be the result of summer melt -because ice only forms in the winter.
If the ice is not drifting (i.e. not under tensile stress) the concentration should be high. This indeed appears to be the case. According to UIUC maps, sea ice concentration is high (above 90%) across the Arctic Basin.

http://arctic.atmos.uiuc.edu/cryosphere/NEWIMAGES/arctic.seaice.color.000.png
The Arctic ice minimum extent increased by about 25% between 2007 and 2009, and many indications (negative AO, light drift, high concentration) point to the idea that it will continue to increase in 2010.

http://www.ijis.iarc.uaf.edu/seaice/extent/AMSRE_Sea_Ice_Extent.png
We can also expect that the average age of the ice has increased this winter, continuing a trend started in 2009.
Poll:
What will the 2010 Summer Arctic Sea Ice Extent Be?
It will be greater than 2009
It will be greater than 2008 but not 2009
It will be less than 2007
It will be near normal
The North pole will be “ice Free” in 2010
rbateman: “Next time you take a hot bath, perform this experiment. Grab a bucket of ice cubes and dump them in after you’ve settled in.”
I’ll take your word for the experiment. Not gonna try it. (Shrinkage Warning in effect).
Chris
Norfolk, VA, USA
Caleb (18:19:35) : “If the reduced abedo-effect of an ice-free arctic didn’t destroy the earth back then, why should it now?…Don’t forget that ice extent is at its lowest in September, when the sun is right down on the arctic horizon. It seems even the sea surface would reflect a lot of sunlight, at that angle.
“Until I see actual numbers, the albedo-effect seems nothing but a vague theory to me, and may indeed be nothing but an old maid’s worry.”
Quite right. In the early days of AGW, warmist think tanks flogged their members until the latter could come up with reasons why warm would be bad. Vicious circle albedo decrease was one of the first straws they grasped at.
But the albedo of open sea water at high zenith angles overlaps that of ice. Old ice is pretty dirty, pockmarked, and is not the best reflector. The emittance of seawater is about 0.997, essentially a black body, and it is radiating to a night (winter) sky at about 4°K. It rapidly ices over. Have you ever driven down to the sea in the afternoon and looked out at the water? A bright image of the sun reflects off the waves, almost too intense to look at. There will always be Arctic ice in winter.
Daryl M (19:53:18) :”…I still question whether we are heading for an increase in the summer ice, since the winter maximum is not looking like it will it will set any records. In fact, it looks like it will be on the low side. So if the 2010 winter maximum is lower than normal, the summer minimum will be disadvantaged out of the gate.”
Note that winter maximum ice is geographically constrained, since ice growth in most directions is obstructed by coastline. Also, the mechanisms for growth and recession are vastly different. Winter maximum is not a perfect predictor of summer minimum.
Pamela Gray (19:40:29) :
“I want to understand the AO a bit more before I feel I have what it takes to predict it’s winds and pressure systems that long out. What do we know about the predictive signs of this thing going positive or negative? It is quite obvious that NOAA/NASA hasn’t got it down.”
True. I wish they would take some time to explain this:
http://www.cpc.ncep.noaa.gov/products/precip/CWlink/daily_ao_index/hgt.shtml
Fascinating.
Chris
Norfolk, VA, USA
“The exceptional melt of 2007 was not just caused by wind patterns, it was coupled with exceptionally clear sunny days too. The latter keeps getting forgotten in some quarters.”
While it is true that the weather was sunnier than normal, the ice did not melt in place. The transportation of ice past Greenland into the Atlantic was quite dramatic. Sunshine notwithstanding, wind was the primary cause. Also note that while is was sunnier, it was also a colder than normal summer.
2008, for example, was a warmer summer than 2007 was.
Lars (09:56:56) : In a few more weeks with this cold we can walk from Stockholm to St. Petersburg on ICE.
So, should we tell them to get “pointers” from the Danes about how to handle the situation? “Swedes on Ice” have an interesting history
😉
Steve Goddard (10:27:09) : The 2007-2009 minimums have been dominated by loss of ice in the western Arctic, not the east. Drift in the western Arctic has been close to zero this winter, and Bering Strait ice is above normal.
Um, from the North Pole, which way is “East” and which is “West” ??!?
Does “west” mean Alaska or Kamchatca? Does “east” mean Greenland or Svalbard? Or is Siberia “east” while Canada is “west”…
I guess “normal” here means the average of the years 2002- 2009?
“Normal” is lay mans term, approximately meaning “what I can remember and liked”.
Why is the extent of the current ice only higher than the 2007 satellite record minimum? If it isn’t floating/blowing out to the Atlantic, and the temperatures are well below freezing where’s the ice?
Show me the Ice!
E M Smith,
East/West is defined by the Greenwich Meridian. West of London are west longitudes, and east of London are east longitudes. Barrow, Alaska is at 71N 156W. Svalbard is at 76N 19E.
Norm,
Ice extent this time of year is not a good indicator of summer extent. Note that 2006 was lowest in February and second highest in September.
http://www.ijis.iarc.uaf.edu/seaice/extent/AMSRE_Sea_Ice_Extent.png
I’ve made available a simple version of a spreadsheet which is DIY calculation for Arctic sea ice deviation.
You have to download and add the new IJIS data, extend a couple of columns copy/fill and magic.
What you do with the result is your business. Plot of the whole set may pose a problem.
This is _daily_ data 1978 to date, long story which I won’t go into now, other than is compensated NASA stereo joined over common period 2003..2007 and IJIS continues. Can’t both be right and must be different projections, compensations works well.
Ice is low right now.
http://www.gpsl.net/climate/data/sea_ice/sea-ice-np-ext-daily-pub.zip
300k zip of .xls, no macros, is minimal data otherwise is large
>>Here’s a comparison between the last week of
>>Jan this year and in2007. >>http://i302.photobucket.com/albums/nn107/Sprintstar400/Drift2010vs07
Nice pictorial.
I bet all that movement towards and into N Canada and N Greenland is going to create a whole raft of very thick pressure ice.
.
Predicted value of the Sea Ice Index (extent) for September 2010 , estimated by the statistical method , is 5.55 (±0.62) x 10^6 km2 The method of the prognosis of the ice-extent in the Arctic was worked out (and is applied) in Dpt. Meteorology and Nautical Oceanography, Gdynia Maritime University (Poland).
Predictor for the prognosis is the index characterizing signal of the heat content in the subtropical zone of Northern Atlantic (DG3L – about the index DG3L and mechanisms of changes of the temperature in Arctic – look “Oceanic control of the warming processes in the Arctic – a different point of view for the reasons of changes in the Arctic climate” http://ocean.am.gdynia.pl/p_k_p/pkp_19/Marsz-Stysz-pkp19.pdf
Regards
aamarsz
My guess for the parlor game as of today is. . . . 4.85M km2 (2009 = 5.1M, 2008 = 4.67M). But sure, this year will be an interesting test that will add to our knowledge of AO impact and the maturation of “multi-year ice”.
At what point does “multi-year ice” become fully “mature” (as an insurance guy I think of this in claims-made risk rating terms for you medical doctors and dentists out there). My suspicion is it is around year four, but that is a gut feeling rather than a scientific analysis.
DMI shows 2006 February extent as the lowest on record and 2006 September extent as the highest.
http://ocean.dmi.dk/arctic/icecover.uk.php
Point is again that February extent tells you literally nothing about the thickness of the perennial ice – which is a key factor in how much ice melts during the summer. The extent graphs don’t provide much useful information until mid-June, when the years start to diverge.
‘Drift’ is this context is the movement of ice out of the Arctic Ocean into the North Atlantic as icebergs or sea ice flows. When the weather conditions are appropriate, lots of Arctic sea ice ends up in the North Atlantic flows South into warmer water and then melts.
Depletion of Arctic ice under such consditions is NOT A MELTING condition. It is an ice movement or ‘drift’ situation.
Thanks for the interesting data and analysis, and prediction Steven.
I find the use of anomalies regarding the Arctic somewhat specious. This is because it is largely landlocked. This means that as the ice fills the Arctic basin the area available for further ice extent is minimized. This biases the anomalies to be more weighted in the negative range. Since even no ice has occurred in the past, without NH glaciation, the upper boundry, or maximum, is limited. It is not a gaussian distribution.
The depiction of ice at CT for Feb. 9th in ’07 and ’10 seems to show far more density now as opposed to ’07.
http://igloo.atmos.uiuc.edu/cgi-bin/test/print.sh?fm=02&fd=09&fy=2007&sm=02&sd=09&sy=2010
I have complained about CT in the past, and notice it is rarely referenced by WUWT folks anymore. What I noticed in the past was the encroachment of the addition of snow into the arctic basin, making the sea smaller. That was in 2004, the loss of sea area pixels is ‘coincidentally’ equal to the step change in sea ice after 2004. In 2010, they have increased the size of the earth, but changed the perspective, it is not simply scaled larger. I will do a pixel count at some point and see if the scale of the sea matches that of the earth.
Steve Goddard (21:30:14) :
Phil,
Looks to me like TLT is 14,000 feet?
TLT = Temperature Lower Troposphere MSU 2 and AMSU 5
http://www.remss.com/msu/msu_data_description.html
Daily global average temperature at: 14,000 ft / 4.4 km / 600 mb (ch05)
http://discover.itsc.uah.edu/amsutemps/data/amsu_daily_85N85S_ch05.r002.txt
The 14,000ft refers to the straight-down view, however the weighting function for that view gives too big a contribution from the lower stratosphere. For each channel there are is a series of side views at various angles that shift the weighting functions to lower altitudes, the MSU TLT was made from a combination of these views to eliminate the stratospheric cooling. AMSU have a similar arrangement (more views), RSS have a link to a paper on their website describing the procedure they used to derive a comparable AMSU TLT. UAH does something similar for their monthly update but the daily on-line data is the unmodified channel 5 (see Spencer’s website).
This procedure is invalid near the poles which is one reason why data is not reported from there. The maximum in the TLT (MSU) weighting function is close to 2km over land and drops off to about 10% of max at ~10km.
Steve Goddard says:
“I’ve never seen any evidence of sunspot count affecting ice extent. The 1980s had unusually high ice extent and age, when solar activity was at a 300 year high.”
——————
Steve, not necessarily “sunspot number,” but a more active sun, especially since our sun has been so cool for an extended solar cycle low, which had many starting to talk about the Maunder Minimum. Most scientists will admit an active sun will surely emit more energy, even if the CME’s and other solar flares are not in the direction of our Earth, there still must be an increase in irradiation, no matter how small.
I beg to differ with your remark about the 1980’s being the 300-year high of solar activity, since Solar Cycle 19 peaking about 1958 was the record, and we saw solar maximum activity between 1950-2004. Reconstructions of TSI goes back to 1611, and there is little doubt that the second half of the 20th century was by far the most active for TSI in the past 400 years.
While you might disagree with certain global temperature measurements by NASA/NOAA, the latest +0.72 degree C. Jan. 2010 global temperature anomaly that dr. roy spencer just added to his graph is quite telling, and even has amazed him. To me, this is quite interesting while at a time of such low solar activity and TSI. http://www.drroyspencer.com/latest-global-temperatures/
My point is, the general consensus of the cause of the Maunder Minimum was extremely low solar activity and TSI coupled with above average volcanic effects, the possible increase in solar irradiance just since the 17th century — as small as it might be — seems to be having an effect of warming our planet. While it seems to also be the consensus that the Arctic is warming much more than the planet as a whole, especially during this winter of extreme negative Arctic oscillation, I seem to think that we’re about to experience some more rapid changes now that the sun has emerged from its funk, and Solar Cycle 24 is headed upwards to the high — maybe not in 2010, but surely in 2011, 2012 and 2013. We’ll see.
Oh. Hmm. I just realized the implication of a change from positive to negative of the AO is actually a reduction in what the March maximums would otherwise be (and alternately a change from negative to positive would tend to increase the March maximum).
So being on a trend for a lower March maximum this year (negative AO) than last year (positive AO) could *possibly* be explained by that, while still tending towards a greater minumum.
Still sticking with my 4.85M prediction for now, but I’m a little more comfortable that Anthony and Steve may prove to be right in the end.
Here is the link showing the extension of the plot below (-4). It briefly hit (-5) and currently at about (-4.3).
http://www.cpc.noaa.gov/products/precip/CWlink/daily_ao_index/ao_index_mrf.shtml
So if there was a positive AO all year until about early August and then a negative AO until late September that would maximize this totally artificial and almost absurd metric “15% coverage ice extent” that only exists because of our limited ability to technologically have *some* historic (hah! Decades “historic”) metric to hang our hats on.
Oy vey.
No problem, Steve and like you say, it supports your analysis.
Steve Keohane,
That CT map does show very clearly how concentrated the ice is now, thanks.