Steven Goddard writes below that he agrees with the prediction I made in late 2009 that we’d see another 500,000 km2 of Arctic sea ice recovery in 2010. The Arctic Oscillation seems to be negative again, and according to NSIDC, this figures greatly in making thicker ice thus lowering summer losses. – Anthony

Source: Climate Prediction Center
NSIDC regularly puts out a news article describing the deteriorating state of the Arctic, called the Sea Ice News. In their May 5, 2008 article, they stated:
…the Arctic Oscillation was in its positive phase through the winter season, associated with a wind pattern helping to flush thick ice out of the Arctic, leaving thinner ice. This is one of the factors helping to set the stage for pronounced ice losses this summer.
Additionally, Dr. Walt Meier from NSIDC told WUWT:
The NAO/AO (Arctic Oscillation) is a particularly prominent one and a substantial amount of the decline in the sea ice during the late 1980s and early 1990s could be attributed to a strong positive mode during winters because the positive mode favors the loss of thicker ice (through drift) that is less likely to melt during summer.
In their January 5, 2010 article NSIDC states that we are in an “Extreme negative phase of the Arctic Oscillation” which can be seen in this NOAA graph below. Oddly (but not surprisingly) the article failed to mention how this affects drift.

If a positive Arctic Oscillation flushes out the Arctic into the Atlantic, the implication is that a negative phase would tend to retain ice. This indeed appears to be the case. Arctic buoys show very light polar drift this winter.

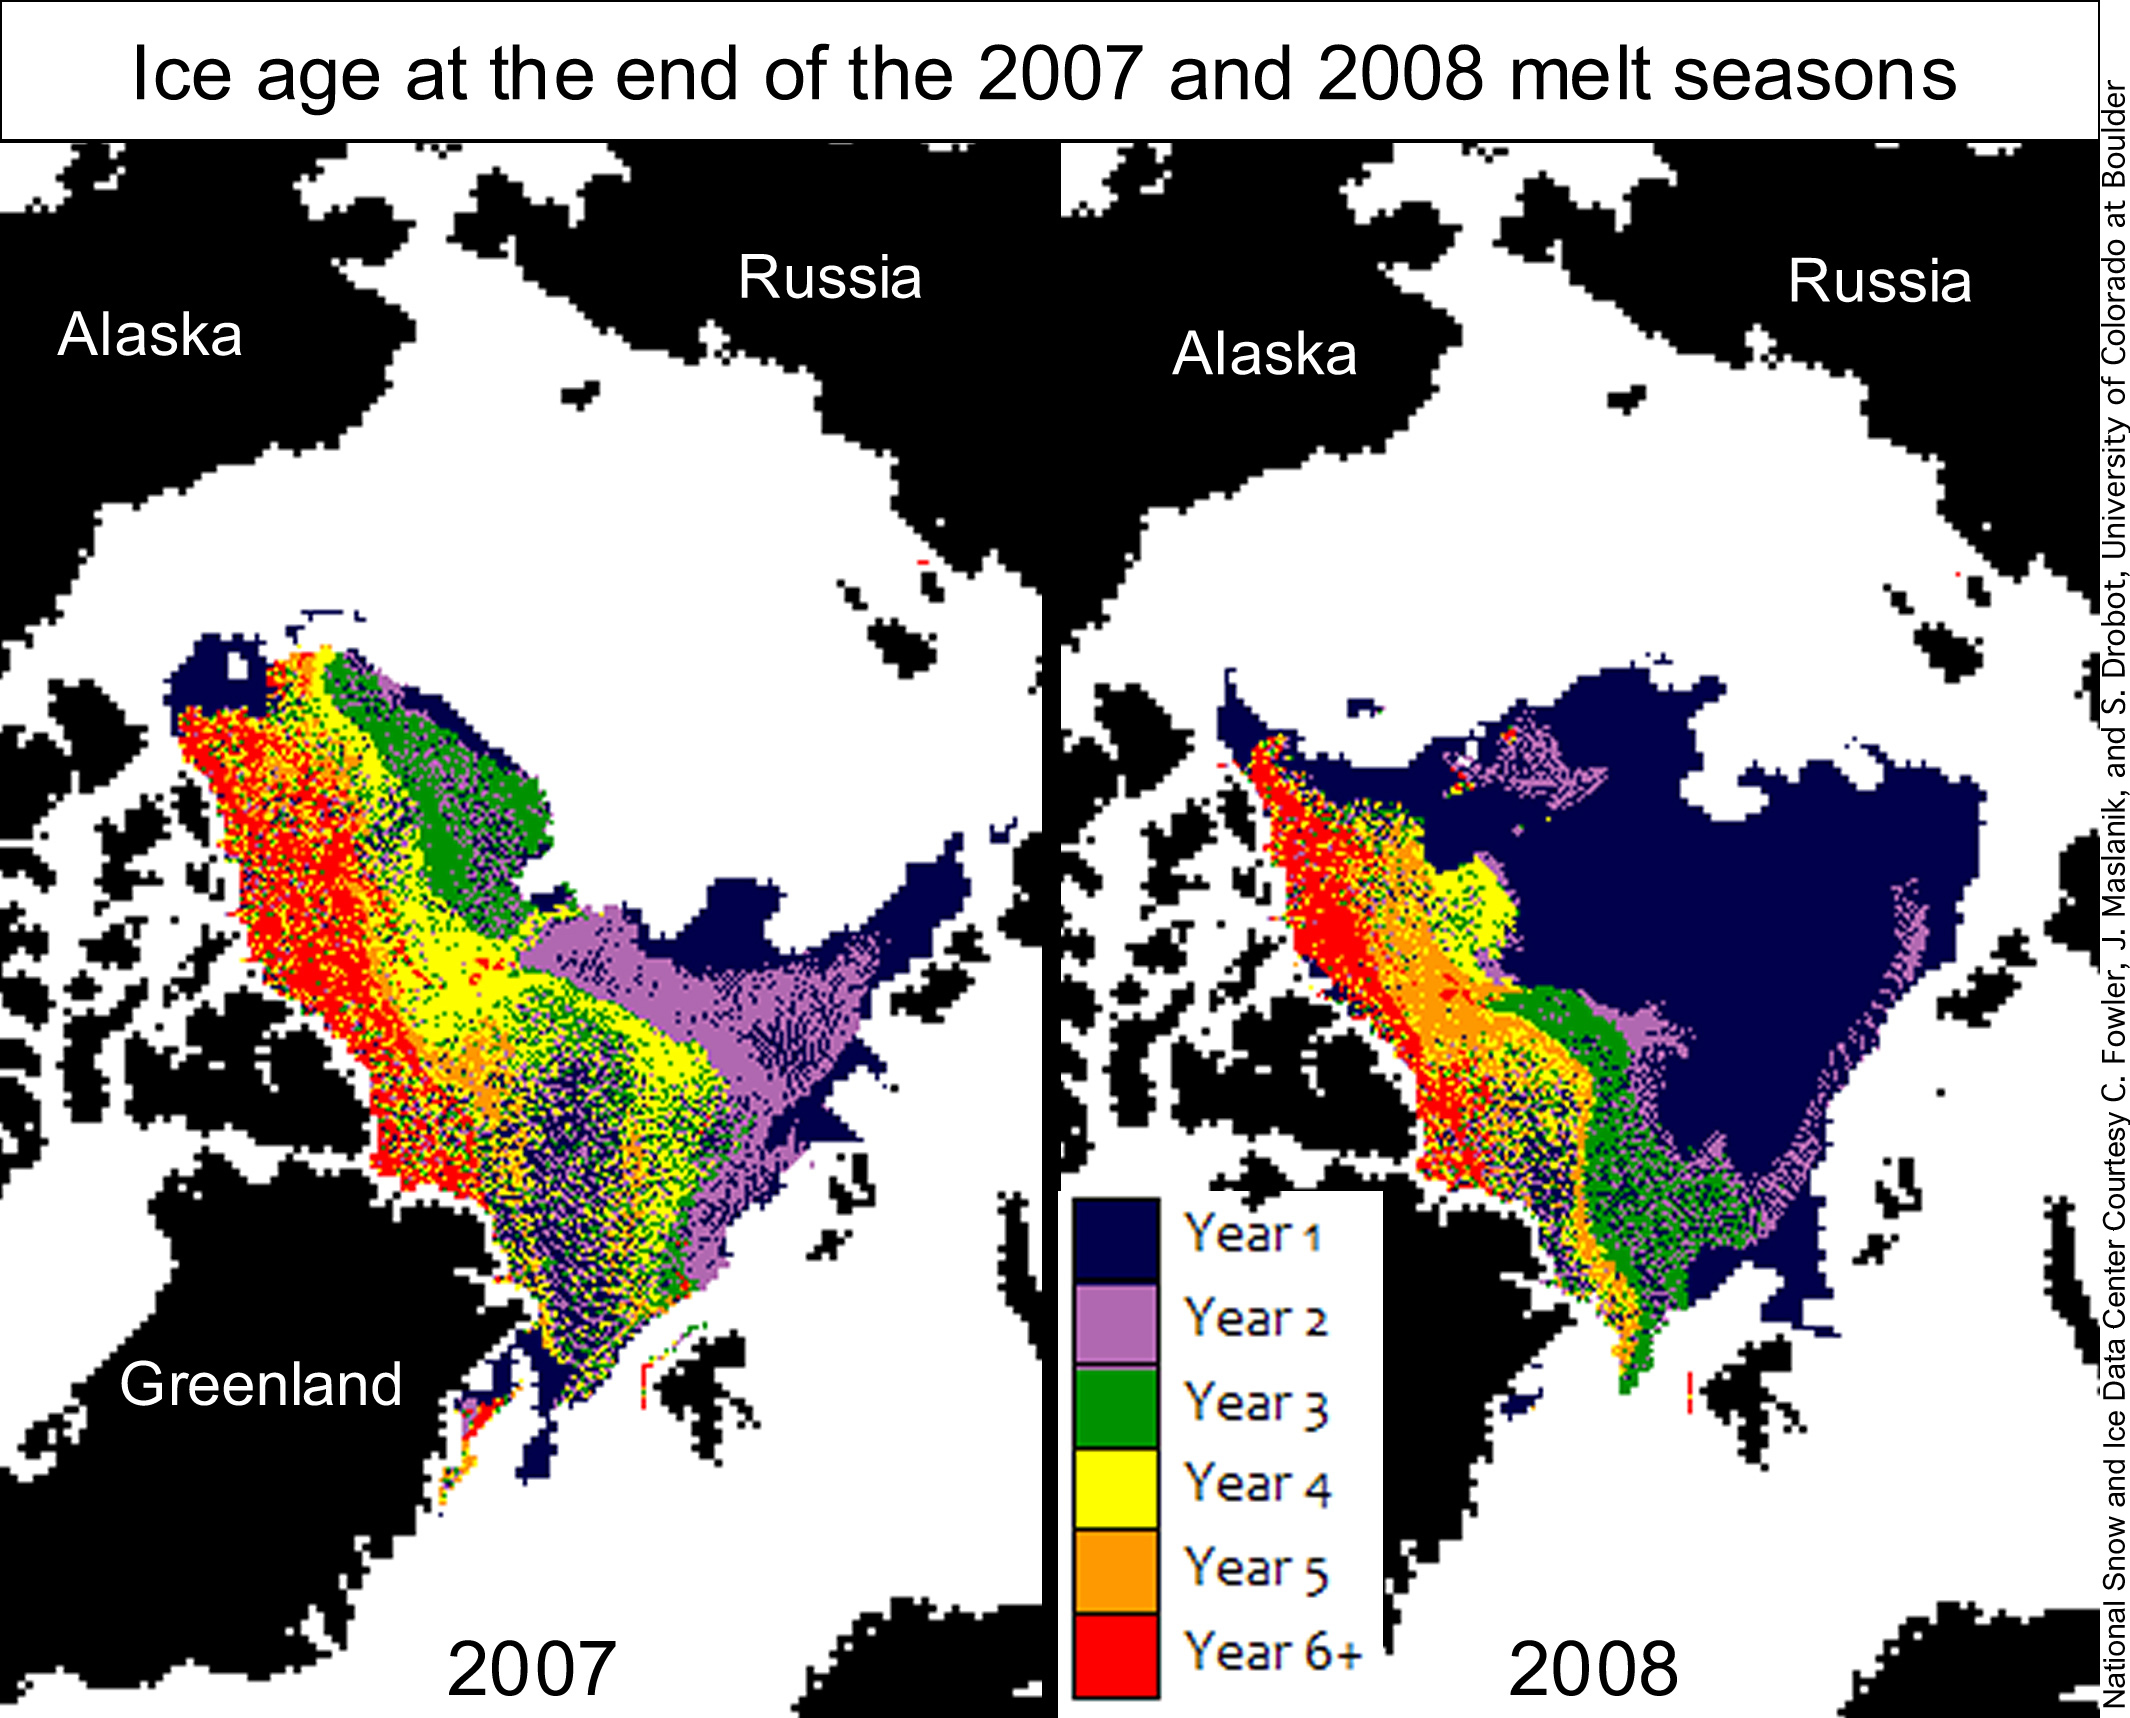
NSIDC made a big deal about loss of multi-year ice in the Arctic during 2007-2008, but this was due more to drift in the winter than melting in the summer, as can be seen in the NSIDC map pair below. Note that most of the 2007 multiyear ice was replaced by first year ice after the 2007 melt season ended and (necessarily) before the 2008 melt season started. The only way this could have happened was due to drift during the 2007-2008 winter, i.e. it could not be the result of summer melt -because ice only forms in the winter.

If the ice is not drifting (i.e. not under tensile stress) the concentration should be high. This indeed appears to be the case. According to UIUC maps, sea ice concentration is high (above 90%) across the Arctic Basin.
http://arctic.atmos.uiuc.edu/cryosphere/NEWIMAGES/arctic.seaice.color.000.png
The Arctic ice minimum extent increased by about 25% between 2007 and 2009, and many indications (negative AO, light drift, high concentration) point to the idea that it will continue to increase in 2010.

http://www.ijis.iarc.uaf.edu/seaice/extent/AMSRE_Sea_Ice_Extent.png
We can also expect that the average age of the ice has increased this winter, continuing a trend started in 2009.

Here’s your chance to weigh in:
Prediction: Arctic Ice Will Continue to Recover this Summer
NSIDC regularly puts out a news article describing the deteriorating state of the Arctic, called the Sea Ice News. In their May 5, 2008 article, they stated:
the Arctic Oscillation was in its positive phase through the winter season, associated with a wind pattern helping to flush thick ice out of the Arctic, leaving thinner ice. This is one of the factors helping to set the stage for pronounced ice losses this summer.
Additionally, Dr. Walt Meier from NSIDC told WUWT:
The NAO/AO (Arctic Oscillation) is a particularly prominent one and a substantial amount of the decline in the sea ice during the late 1980s and early 1990s could be attributed to a strong positive mode during winters because the positive mode favors the loss of thicker ice (through drift) that is less likely to melt during summer.
In their January 5, 2010 article NSIDC states that we are in an “Extreme negative phase of the Arctic Oscillation” which can be seen in this NOAA graph below. Oddly (but not surprisingly) the article failed to mention how this affects drift.

If a positive Arctic Oscillation flushes out the Arctic into the Atlantic, the implication is that a negative phase would tend to retain ice. This indeed appears to be the case. Arctic buoys show very light polar drift this winter.

NSIDC made a big deal about loss of multi-year ice in the Arctic during 2007-2008, but this was due more to drift in the winter than melting in the summer, as can be seen in the NSIDC map pair below. Note that most of the 2007 multiyear ice was replaced by first year ice after the 2007 melt season ended and (necessarily) before the 2008 melt season started. The only way this could have happened was due to drift during the 2007-2008 winter, i.e. it could not be the result of summer melt -because ice only forms in the winter.
If the ice is not drifting (i.e. not under tensile stress) the concentration should be high. This indeed appears to be the case. According to UIUC maps, sea ice concentration is high (above 90%) across the Arctic Basin.

http://arctic.atmos.uiuc.edu/cryosphere/NEWIMAGES/arctic.seaice.color.000.png
The Arctic ice minimum extent increased by about 25% between 2007 and 2009, and many indications (negative AO, light drift, high concentration) point to the idea that it will continue to increase in 2010.

http://www.ijis.iarc.uaf.edu/seaice/extent/AMSRE_Sea_Ice_Extent.png
We can also expect that the average age of the ice has increased this winter, continuing a trend started in 2009.
Poll:
What will the 2010 Summer Arctic Sea Ice Extent Be?
It will be greater than 2009
It will be greater than 2008 but not 2009
It will be less than 2007
It will be near normal
The North pole will be “ice Free” in 2010
Tim,
Antarctic sea ice changes by nearly 14 million km2 between the winter maximum and the summer minimum.
http://arctic.atmos.uiuc.edu/cryosphere/IMAGES/seaice.recent.antarctic.png
Arctic ice changes by less than that – about 11 million km2.
http://arctic.atmos.uiuc.edu/cryosphere/IMAGES/seaice.recent.arctic.png
Antarctic ice, being further from the pole, reflects more sunlight than Arctic ice, and thus has a stronger influence on the earths radiation balance.
Steve Goddard (22:07:46) :
Phil,
MSU doesn’t cover much of the Arctic Basin, and the DMI graph looks neutral for January.
MSU covers up to 82.5ºN which covers virtually all the Arctic that melts, and ‘winter’ is more than just January. And a week below average in January doesn’t fit a description of ‘neutral’ (for the first time since September). The parameter that is correlated with sea ice thickness is freezing degree days:
thickness ≅ √FDD
So since September the FDD is ~500 degree days below average which should lead to less ice growth.
http://nsidc.org/seaice/processes/thermodynamic_growth.html
Are you always this contrary?
You asked a question and I answered it, what’s contrary about that?
Roger Knights (02:38:00) :
Is there a URL or two where a readable table of the numeric values of daily ice extents (or areas) is updated daily? There must be somewhere, because the charts are updated daily, but I haven’t been able to find a readable source for the data the charts are based on.
http://www.ijis.iarc.uaf.edu/seaice/extent/plot.csv
See here for site policy:
http://www.ijis.iarc.uaf.edu/en/sitepolicy.htm
Steve,
The annual change tends to constant.
I have used shorthand but without a suitable upload facility here I could not show the reason why I said that. I did consider a paper, doesn’t seem any point.
Quick check here nothing public so I’ve put up a quick page here
http://daedalearth.wordpress.com/sea-ice-variation/
Of course I might be wrong.
Phil,
Serreze predicted that 90N would be ice free in 2008.
Steve Goddard:
“I’m not sure where people are getting the idea that the Arctic has been warm this winter.”
“Ground temperatures in Canada and Greenland were above normal, but not that much.”
—————-
Steve,
Is it all semantics to figure out the difference between warm, cool and cold? Obviously, it should be downright cold during polar darkness, and low temperatures mean that the ice generally refreezes to about the same boundaries each winter. You seem to repeat over and over again about multi-year ice, which I have to agree we’re seeing in the Arctic, but nobody has addressed the fact of the decline in thickness of all Arctic ice, whether it is first-year or multi-year ice. Do you disagree with that decline since 1980 according to this NOAA report card?
http://www.arctic.noaa.gov/reportcard/seaice.html
January 2010 Global Tropospheric Temperature Map
February 9th, 2010
Here’s the UAH lower tropospheric temperature anomaly map for January, 2010. As can be seen, Northern Hemispheric land, on a whole, is not as cold as many of us thought. Below-normal areas were restricted to parts of Russia and China, most of Europe, and the southeastern United States. Most of Canada and Greenland were well above normal.
The global-average lower tropospheric temperature anomaly soared to +0.72 deg. C in January, 2010. This is the warmest January in the 32-year satellite-based data record.
http://www.drroyspencer.com/
According to roy spencer, “most of Canada and Greenland were well above normal” (+7.5 C in places) so I’m not sure what your “not that much” really means. Personally, I guess I’m not quite as obsessed with Arctic sea ice extent as you appear to be, and just don’t have the time to devote comparing data from different sources. Seems as if many like to deride the NSIDC for some reason, but I’ve seen apologies to scientists at the NSIDC for wrongful blame as well.
February 3, 2010
Despite cool temperatures, ice extent remains low
Despite cool temperatures over most of the Arctic Ocean in January, Arctic sea ice extent continued to track below normal. By the end of January, ice extent dropped below the extent observed in January 2007. Ice extent was unusually low in the Atlantic sector of the Arctic, the one major area of the Arctic where temperatures remained warmer than normal.
Ice extent remained below normal over much of the Atlantic sector of the Arctic, including the Barents Sea, part of the East Greenland Sea, and in Davis Strait. The only region with above-average ice extent was on the Pacific side of the Bering Sea.
http://nsidc.org/arcticseaicenews/
So to answer your question, I guess I’m getting the idea of a warmer than normal Arctic from both the NSIDC and Roy Spencer, and although we can both agree that it’s too early to make predictions of how the rest of the winter will play out in the Arctic, there’s going to be quite a bit of speculation as to what September 2010 will look like. Seems as if a simple coin toss would work right now with all the different variables and opinions.
Steve Goddard (07:19:23) :
Phil,
Serreze predicted that 90N would be ice free in 2008.
Are you sure? According to your link above what he said was:
“The issue is that, for the first time that I am aware of, the North Pole is covered with extensive first-year ice – ice that formed last autumn and winter. I’d say it’s even-odds whether the North Pole melts out,” said Dr Serreze.
Phil,
Mark Serreze posted a comment on one of my articles a couple of years ago either on WUWT or The Register, that he got that prediction wrong. I don’t have time to search for it now though.
I did find this :
http://alaskareport.com/news68/x61385_north_pole_ice.htm
doc,
Land temperatures in Canada and Greenland have been above normal. That isn’t the same as the Arctic Basin above 80N where the sea ice forms though.
Phil:
“So since September the FDD is ~500 degree days below average which should lead to less ice growth.”
http://nsidc.org/seaice/processes/thermodynamic_growth.html
———-
Since the only region with above-average ice extent was on the Pacific side of the Bering Sea during January, I’m thinking that all this talk about multi-year ice is completely overblown. Even if there is more multi-year ice by the end of March 2010, wouldn’t NOAA’s assessment of a decline in ice thickness since 1980 be a factor, especially with the trend over the past decade of reduced extent of multi-year ice?
Seems as if some need to jump on the bandwagon of taking a couple of years out of context of the entire picture, even if it is only 30+ years of satellite imaging. I for one, would rather continue looking at the entire “big picture” and use all the data available, instead of using a starting point of 2002, 2005 or even 2007.
If multi-year ice is thinning like NOAA is reporting, and just not having the resilientcy it had decades ago, I would think that even multi-year Arctic ice would be more susceptible to a warmer year after a couple of cooler years.
“The declines in total volume and average thickness are explained almost entirely by thinning and loss of multiyear sea ice due to melting and ice export. These changes have resulted in seasonal ice becoming the dominant Arctic sea ice type, both in terms of area coverage and of volume.”
http://www.arctic.noaa.gov/reportcard/seaice.html
“”” Steve Goddard (06:18:54) :
Tim,
Antarctic sea ice changes by nearly 14 million km2 between the winter maximum and the summer minimum.
http://arctic.atmos.uiuc.edu/cryosphere/IMAGES/seaice.recent.antarctic.png
Arctic ice changes by less than that – about 11 million km2.
http://arctic.atmos.uiuc.edu/cryosphere/IMAGES/seaice.recent.arctic.png
Antarctic ice, being further from the pole, reflects more sunlight than Arctic ice, and thus has a stronger influence on the earths radiation balance. “””
Steve, the Antarctic Winter nights, also have the earth further from the sun; which might encourage more ice (extent) but lower sunlight to reflect off it. Then in the summer you would have the reverse, of a higher southern summer irradiance. I have also wondered about the annual loss of Antarctic sea ice, simply from the fact that the southern ocean sloshes all around it along with daily tides; whereas, the Arctic ice perimeter, is largely land locked.
Can you make anything of those specific differences; or is there data to take those into account ?
doc lakota (08:27:33)
“So to answer your question, I guess I’m getting the idea of a warmer than normal Arctic from both the NSIDC and Roy Spencer, and although we can both agree that it’s too early to make predictions of how the rest of the winter will play out in the Arctic,”
I agree that Steve’s imprecise remarks regarding arctic cold/warm and ice cover aren’t very helpful. But he is not wrong about NSIDC bias toward warming. Even though surviving summer ice extent expanded in 2007-08 and again in 2008-2009, they downplayed this in their reports by stating they are the second lowest and third lowest rather than saying there has been some 25% ice area recovery which is substantial. I have lost the link but the Wegener Institute in Germany did a broad regional survey at the same time the ridiculous Catlin Arctic survey was reporting all the thin ice over the Arctic basin. The German team found that the arctic basin ice was much thicker than they had expected. Believe me this thin arctic ice stuff was only cooked up by NSIDC when they were broadsided by rapidly expanding ice in the 2007-2008 winter and then again in the following winter.
The logic here is simple. First year ice that survived in the summer of 2008 became second year ice in 2000 freezup and I think to steal part of Sereze’s quote “I’d say it’s even-odds …” that it will become 3rd year ice in freeze-up, fall 2010 , the 2009 would become 2nd year ice. Check out the Wegener Institute who did a real survey last winter and don’t buy into this thin ice rationalization,
Steve Goddard (09:09:42) :
doc,
Land temperatures in Canada and Greenland have been above normal. That isn’t the same as the Arctic Basin above 80N where the sea ice forms though.
But that’s exactly where DMI says it’s been significantly above normal since September!
Steve Goddard:
doc,
“Land temperatures in Canada and Greenland have been above normal. That isn’t the same as the Arctic Basin above 80N where the sea ice forms though.”
———–
Now wait just a cotten-pickin’ minute….is that your arbitrary line or the generally accepted demarcation line, since there’s open seas much further south all the way to the Arctic Circle, like the Beaufort Sea, East Siberian Sea, Barents Sea, Lapter Sea, Kara Sea, Greenland Sea and even the Chukchi Sea and Baffin Bay? I’ve always been under the assumption that “the Arctic” was all that land and sea above the Arctic Circle at 66.56083° north of the Equator.
Also, do you agree or disagree with NOAA’s claim that there exists a downward trend since 1980 of the thickness of all Arctic ice, no matter whether or not it is first-year or multi-year ice?
I found the Mark Serreze post where he says that he bet on an ice free North Pole.
http://wattsupwiththat.com/2008/08/15/arctic-ice-extent-discrepancy-nsidc-versus-cryosphere-today/
doc,
Arctic ice thickness and extent decreased significantly leading up to 2007, and has been increasing again since then.
Phil,
We are entering the coldest part of the Arctic winter now and temperatures are plenty cold in the Arctic.
http://ocean.dmi.dk/arctic/meant80n.uk.php
The point of this article is that a key factor in predicting summer ice extent is winter drift, rather than winter temperature. It makes little difference if the air temperature is minus 30 or minus 35 C during February.
@Tim & Phil:
Thanks. I’ve managed to open the file below using text edit:
http://www.ijis.iarc.uaf.edu/seaice/extent/plot.csv
But the numbers lack internal commas and are hard to read out of the box (small size). Is there a better program I could use to open the file with?
Roger Knights (10:49:35) :
@Tim & Phil:
Thanks. I’ve managed to open the file below using text edit:
http://www.ijis.iarc.uaf.edu/seaice/extent/plot.csv
But the numbers lack internal commas and are hard to read out of the box (small size). Is there a better program I could use to open the file with?
It opens fine with Safari for me but since you’re having trouble open it the way you’re doing now then save it as a ‘.csv’ file which you can then open with Excel and format any way you want.
@Phil.: Thanks, I’ve opened it in both Excel and Safari.
The pack is starting to grow again at a better rate, even tho the AO is still strongly negative, which I feel better about. Logically you’d expect a transition in the AO from positive to negative to reach some practical limit of compaction and then start to grow faster in total extent again –wouldn’t you?
Thanks, nice!
I think that this year will show lower sea ice in the Arctic , but not record lows , but could be close the thicker ice will slow the melt , the big variable will be if the wrmer water sitting off the pacific coast makes its way further north we have had a much warmer sea this winter on the pacific, the atlantic is mising ice allowing the sun again to warm the water open water heats ice reflects, Allso Canada on a whole has experianced the warmest winter on recoerd as a country and has extremly low snow levels on land so the continent will heat more than usuall this summer so the big facter will be air and ocean currents. I work on the water everyday and all I know is we are seeing much warmer water last summer was crazy warm in Canada yes -30 is cold but nothing to what we are used to