Steve Goddard points out that warm SST events often have a downside. My view: something like capacitor discharge in an RC circuit. – Anthony

Dr. Roy Spencer reported that January, 2010 was the warmest on record at +0.72C anomaly after a relatively cool +0.28 in December. Dr. Spencer is one of the most trustworthy players in climate science and clearly does not have a warming agenda. So is earth’s climate warming out of control after all?
To answer this question, it is worth looking back at the “second warmest January” which came in 2007. Like 2010, January, 2007 also took a big jump up from the previous month and was at the peak of an El Nino. The warm weather led the Met Office and to forecast a record warm year. Hansen also speculated about the possibility of a “Super El Nino.”
4 January 2007
2007 – forecast to be the warmest year yet
2007 is likely to be the warmest year on record globally, beating the current record set in 1998, say climate-change experts at the Met Office. http://www.metoffice.gov.uk/corporate/pressoffice/2007/pr20070104.html
But the Met Office was wrong in 2007. Instead of breaking the temperature record, temperatures plummeted nearly 0.8C to below normal after El Nino quickly faded – as you can see in the graph below.

Source : Wood For Trees – Late 2006 to mid 2008
One big difference between January, 2007 and January, 2010 is that this time around, land temperatures are not so warm. Many parts of the planet have been reporting near record cold temperatures, in particular Europe, Siberia, Antarctica and the US.
So what is going on in 2010? Bob Tisdale has reported that this is the warmest El Nino since 1998.

http://bobtisdale.blogspot.com/2010/02/preliminary-january-2010-sst-anomaly.html
The ocean makes up 2/3 of the planet and dominates the global temperature average. Bob reports that “NINO3.4 SST anomalies peaked about five weeks ago and they’ve been dropping like a stone” so we may be in for a repeat of 2007. The Met Office is doing their part to make it happen.
Met Office : Climate could warm to record levels in 2010
10 December 2009
http://www.metoffice.gov.uk/corporate/pressoffice/2009/pr20091210b.html
In the meantime, try to stay warm during the “record heat.”

http://wxmaps.org/pix/temp1.html

http://wxmaps.org/pix/temp4.html

http://wxmaps.org/pix/temp3.html
Flashback to 2007
Dr. Roy Spencer reported that January, 2010 was the warmest on record at +0.72C anomaly after a relatively cool +0.28 in December. Dr. Spencer is one of the most trustworthy players in climate science and clearly does not have a warming agenda. So is earth’s climate warming out of control after all?
To answer this question, it is worth looking back at the “second warmest January” which came in 2007. Like 2010, January, 2007 also took a big jump up from the previous month and was at the peak of an El Nino. The warm weather led the Met Office and to forecast a record warm year. Hansen also speculated about the possibility of a “Super El Nino.”
4 January 2007
2007 – forecast to be the warmest year yet
2007 is likely to be the warmest year on record globally, beating the current record set in 1998, say climate-change experts at the Met Office. http://www.metoffice.gov.uk/corporate/pressoffice/2007/pr20070104.html
But the Met Office was wrong in 2007. Instead of breaking the temperature record, temperatures plummeted nearly 0.8C to below normal after El Nino quickly faded – as you can see in the graph below.

Source : Wood For Trees – Late 2006 to mid 2008
One big difference between January, 2007 and January, 2010 is that this time around, land temperatures are not so warm. Many parts of the planet have been reporting near record cold temperatures, in particular Europe, Siberia, Antarctica and the US.
So what is going on in 2010? Bob Tisdale has reported that this is the warmest El Nino since 1998.

http://bobtisdale.blogspot.com/2010/02/preliminary-january-2010-sst-anomaly.html
The ocean makes up 2/3 of the planet and dominates the global temperature average. Bob reports that “NINO3.4 SST anomalies peaked about five weeks ago and they’ve been dropping like a stone” so we may be in for a repeat of 2007. The Met Office is doing their part to make it happen.
Met Office : Climate could warm to record levels in 2010
10 December 2009
http://www.metoffice.gov.uk/corporate/pressoffice/2009/pr20091210b.html
In the meantime, try to stay warm during the “record heat.”
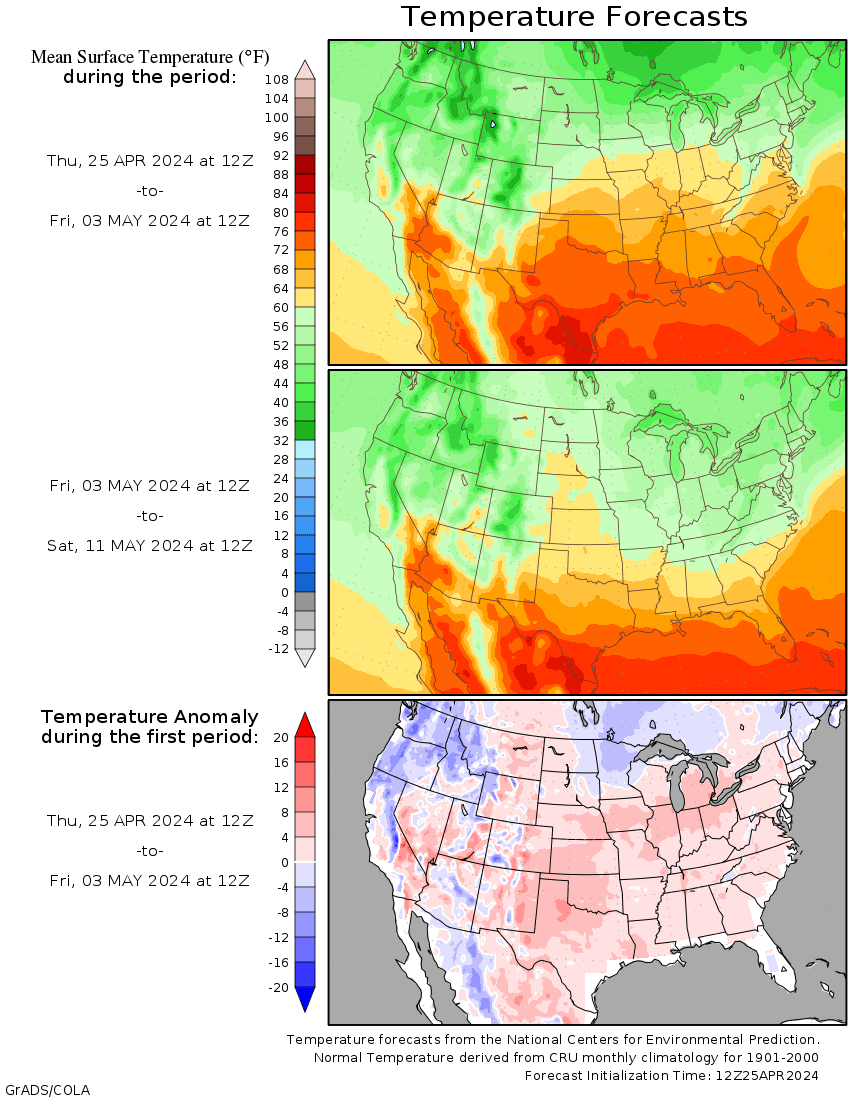
http://wxmaps.org/pix/temp1.html
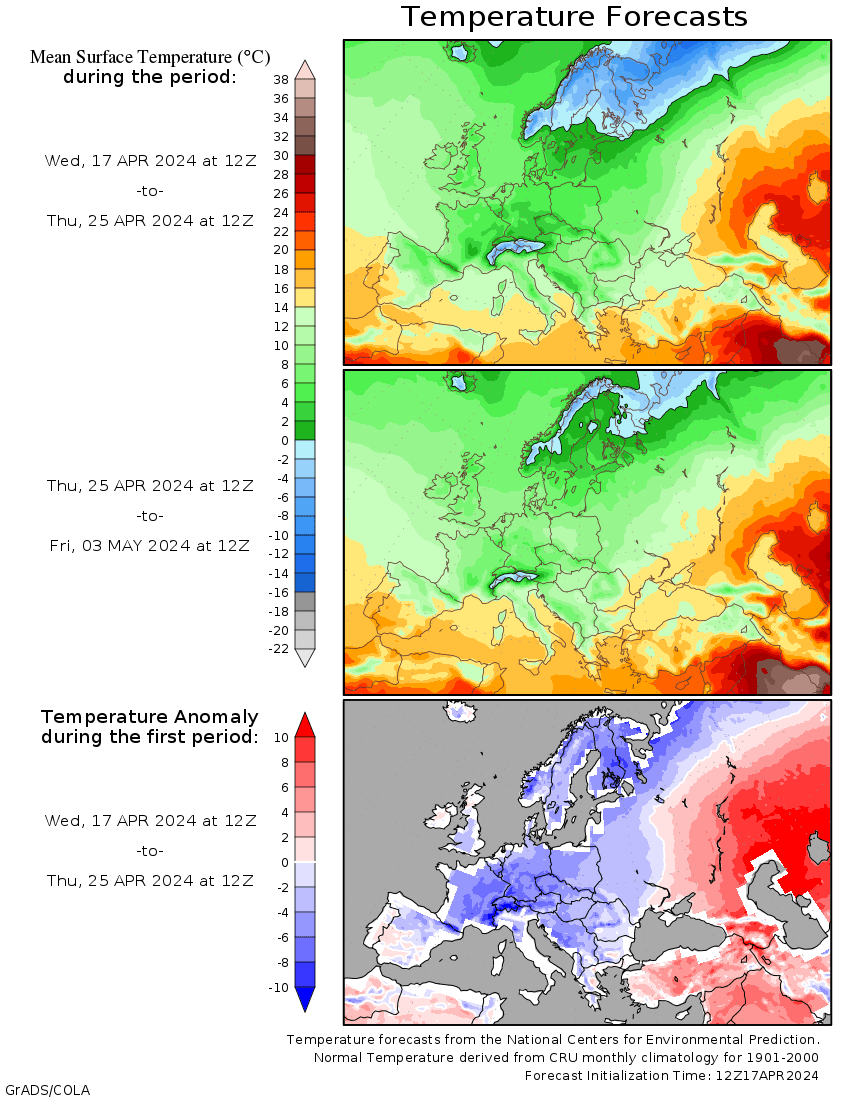
http://wxmaps.org/pix/temp4.html
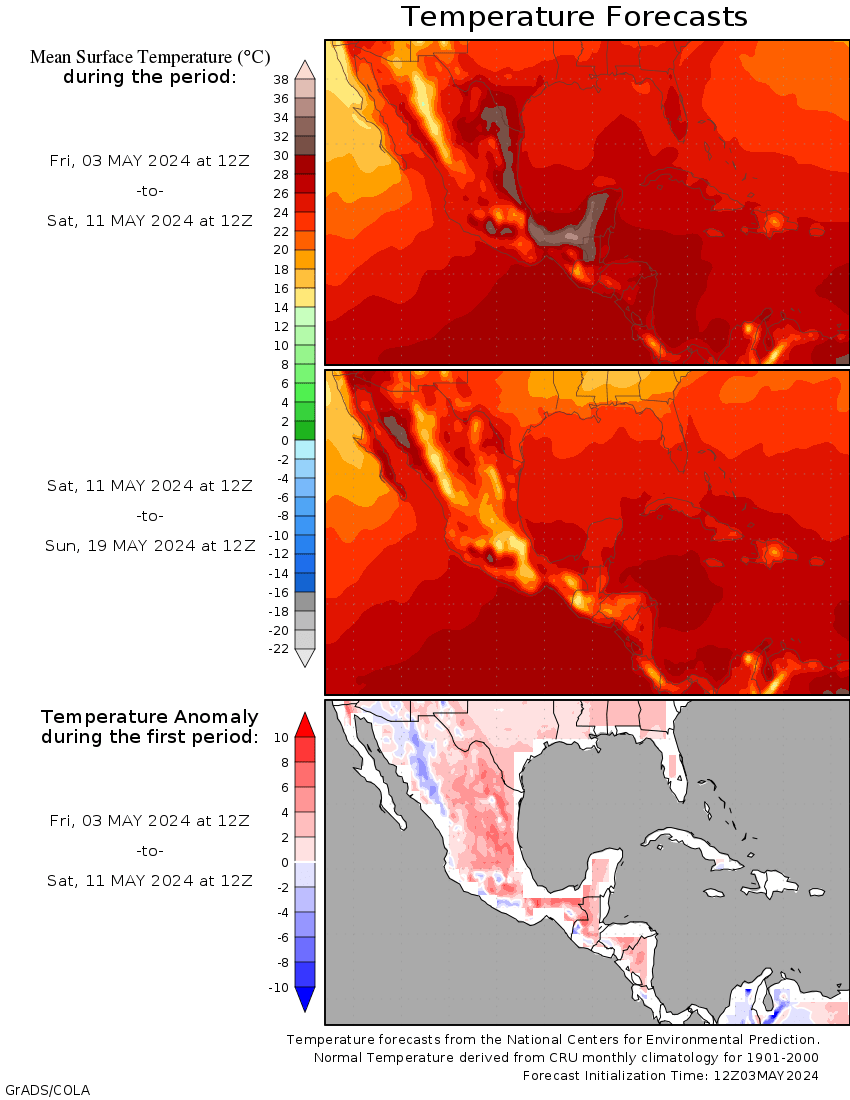
http://wxmaps.org/pix/temp3.html
Steve Goddard (16:15:50) :
I’m willing to bet that 2010 is likely to be one of the warmest years recorded, if not the warmest. That’s hardly agreeing with your prediction of UAH temperatures. And I think the composition of the atmosphere would certainly play an important part in that warming.
Tom P,
I’ll take you up on that bet. Based on UAH temperatures. 2010 will not be as warm as 1998.
Warmest year on record, according to some.
http://www.telegraph.co.uk/topics/weather/7182802/Second-cold-snap-set-to-sweep-across-Britain-with-more-snow-and-ice.html
Tenuc (16:07:43) “Perhaps your confusing chaos with randomness, Paul.”
As I settle down from laughing at this suggestion: No, certainly not.
I shall leave you to your hobby of promoting the defeatist belief that we have exhausted all possibilities.
There are many voices in the choir.
Steve Goddard (19:49:01) :
Intrade were offering 32% that 2010 will be warmer than 2009. What are you offering?
Tom P,
I’m offering you a gentleman’s bet. UAH higher vs. lower than 1998.
Steve Goddard (06:09:49) :
1998 was quite an exceptional El Niño year. But with the latest ONI coming out at 1.8 plus the background of a warming trend, 2010 looks like it has the capability of being even hotter.
But I’ll stick to betting with people who, unlike you, are willing to put their money where there mouth is.
Tom P,
Understood – so apparently you don’t have a lot of confidence in your prediction that 2010 will be the warmest. If you read this article again, you will see that I am predicting that UAH temperatures will plummet later in the year.
Pamela Gray (18:20:26) :
El Nino induced warm temps are perfect measures of increased long wave radiation from increasing greenhouse affect, is it not?
Well since you ask,
NO.
It’s a sign of large amounts of energy coming out of the oceans. The Greenhouse effect doesn’t put energy into the oceans to any measurable degree. Only sunshine does that.
Tom P (10:02:16) :
Steve Goddard (06:09:49) :
1998 was quite an exceptional El Niño year. But with the latest ONI coming out at 1.8 plus the background of a warming trend, 2010 looks like it has the capability of being even hotter.
But I’ll stick to betting with people who, unlike you, are willing to put their money where there mouth is.
The ’98 el nino was dying down by Feb 98.
http://www.woodfortrees.org/plot/wti/from:1998/to:1999
Betting on Jan 1st to Dec 31st temps makes no sense in this context.
Steve Goddard (12:29:57) :
“…so apparently you don’t have a lot of confidence in your prediction that 2010 will be the warmest.”
Not at all – unlike you I’ve got some real money riding on this year’s UAH temperature.
Tom P,
Hope you didn’t bet too much.
Steve Goddard (14:41:59) :
It’s against some foolish sceptic who actually believed 2008 was the start of a downward trend in temperatures. He lost last year.
I can’t imagine where he got the idea that the Earth was cooling…
Tom P,
You keep changing the subject. Again, this article is a prediction that UAH temperature anomalies will decline this year from the January high.
Good luck with your gambling.
“something like capacitor discharge in an RC circuit”
Perhaps your thinking of a LC circuit.
It has more kick. the RC combo has no “inertia” like the
LC pair does.
I know your talking metaphorically, but …
As the capacitor (dis)charges either thru or in parallel
with the inductor a mag field builds storing energy in the
field around the inductor.
As the charge in the capacitor reaches peak or zero the
collapsing field of the inductor continues to drive current.
such a “tank” circuit would ring forever if it wasnt for
the resistive and stray magnetic coupling losses (toroids
are better).
its an apt metaphor anyway, you can add the notion of
harmonics and/or modulation into the mix.
On a old school Ampl Modulated transmitter, the peak power
at 100% is four times the carrier power.
As for the notion of harmonics, when the two waveforms briefly sync, the peak/valley moves from the difference to the sum of both.
Here a worldwide map of January Temperatures. Uses a 20 yr normal from 1990 to 2009. We use both NCEP reanalysis data and approximately 4,000 QC’d surface observations. I do hereby acknowledge that their could be somewhere on the map that is not perfect. Error can be from mapping process or bad ob that missed the QC. All in all gives a fairly reasonable snapshot of the world. Using this methodology 2010 was not the warmest year since 1990, but it was in the top 5.
I am testing this image posting site since we typically do not allow the general public to browse our database for information, but I thought it might be useful for the discussion here.
Cheers
[IMG]http://i49.tinypic.com/mraaud.png[/IMG]
Ok that didn’t work..
Try this link…someone let me know if they are able to see the map…just interested in finding out if it works.
Ok last try as obviously I must be dumb today…
http://tinypic.com/r/mraaud/6
Aghh one more mistake in my explanation..its actually a 30 year normal from 1980 to 2009.
If I use this data, Jan 2010 was the 3rd warmest since 1993 (when my history begins) with a temperature of 55.32 F. The warmest January was 2007 with a temperature of 55.64 F. January 1998 was actually in the middle of the pack with a temperature of 54.90 F. 54.8 F is my 30 year normal from 1980 to 2009.