Steve Goddard points out that warm SST events often have a downside. My view: something like capacitor discharge in an RC circuit. – Anthony

Dr. Roy Spencer reported that January, 2010 was the warmest on record at +0.72C anomaly after a relatively cool +0.28 in December. Dr. Spencer is one of the most trustworthy players in climate science and clearly does not have a warming agenda. So is earth’s climate warming out of control after all?
To answer this question, it is worth looking back at the “second warmest January” which came in 2007. Like 2010, January, 2007 also took a big jump up from the previous month and was at the peak of an El Nino. The warm weather led the Met Office and to forecast a record warm year. Hansen also speculated about the possibility of a “Super El Nino.”
4 January 2007
2007 – forecast to be the warmest year yet
2007 is likely to be the warmest year on record globally, beating the current record set in 1998, say climate-change experts at the Met Office. http://www.metoffice.gov.uk/corporate/pressoffice/2007/pr20070104.html
But the Met Office was wrong in 2007. Instead of breaking the temperature record, temperatures plummeted nearly 0.8C to below normal after El Nino quickly faded – as you can see in the graph below.

Source : Wood For Trees – Late 2006 to mid 2008
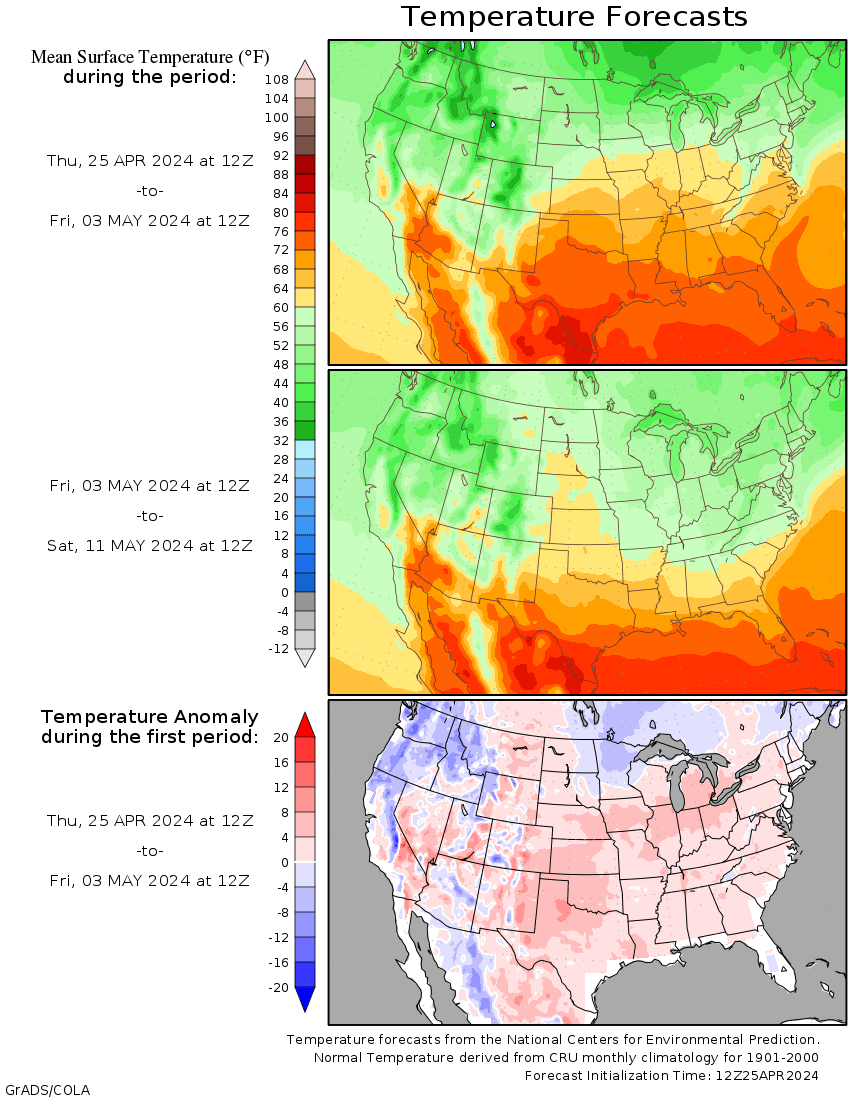
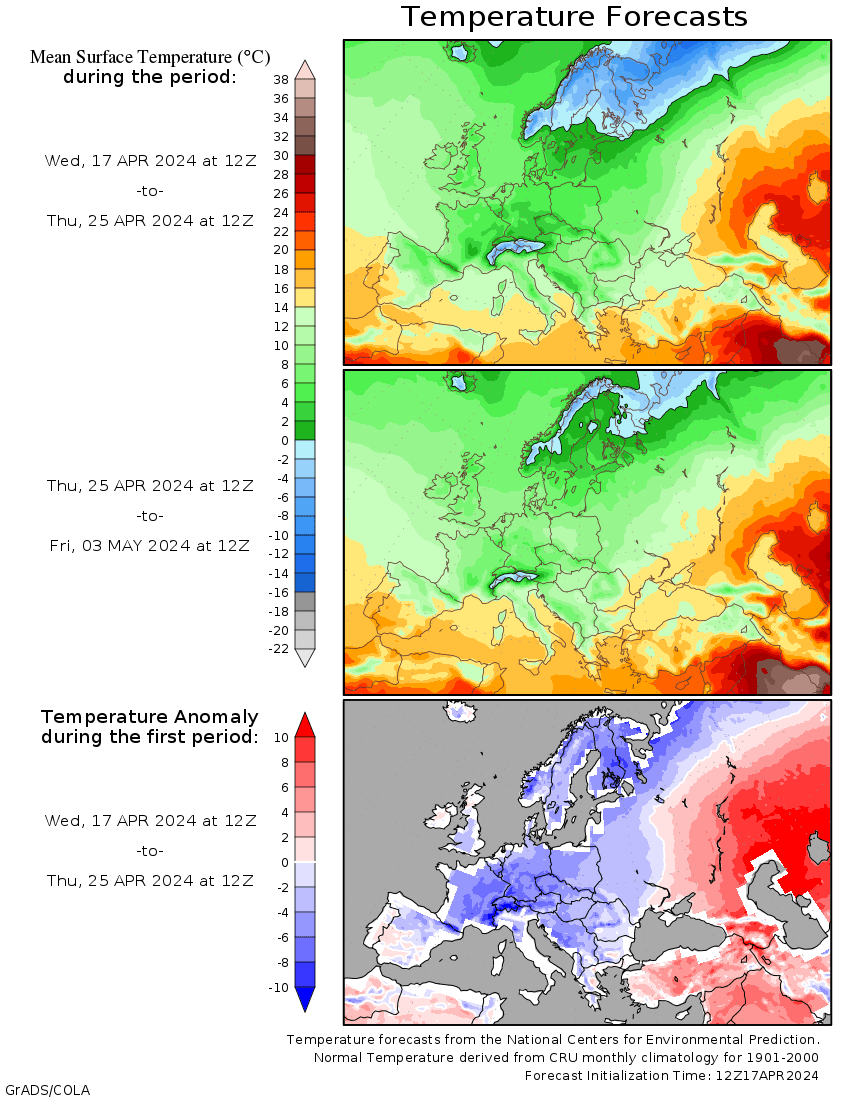
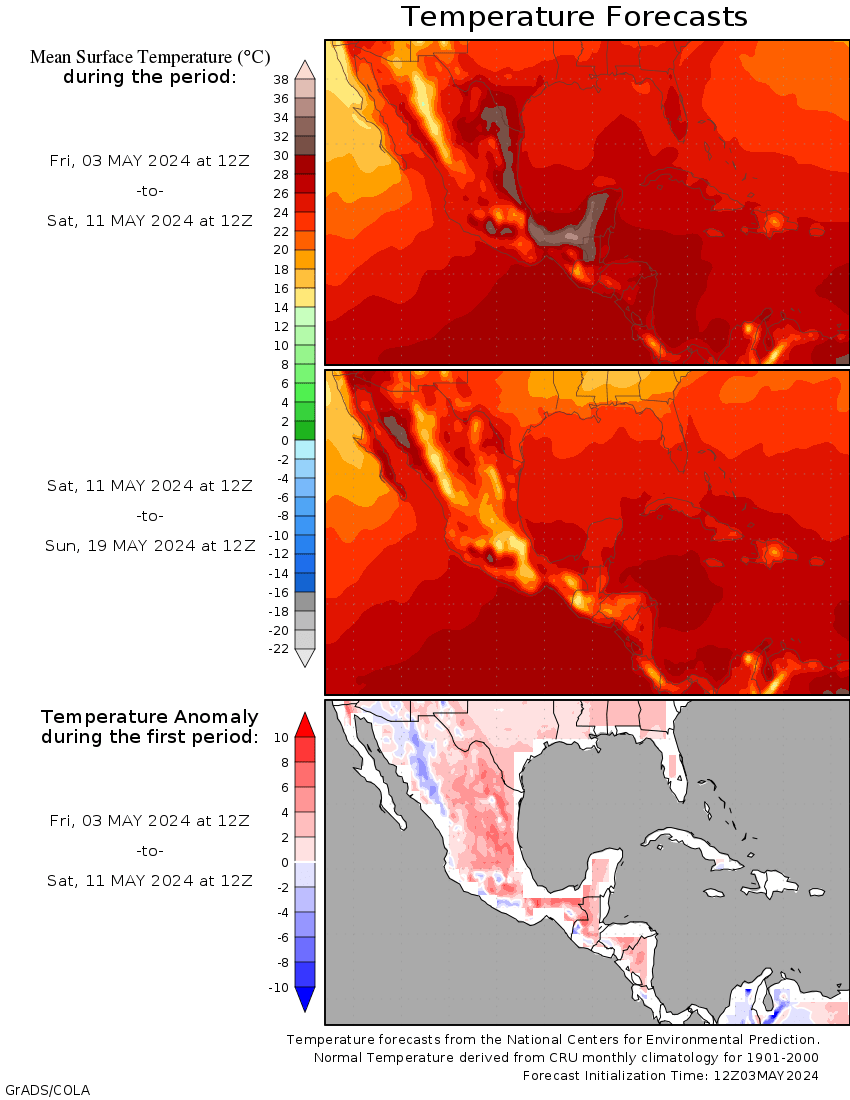
One big difference between January, 2007 and January, 2010 is that this time around, land temperatures are not so warm. Many parts of the planet have been reporting near record cold temperatures, in particular Europe, Siberia, Antarctica and the US.
So what is going on in 2010? Bob Tisdale has reported that this is the warmest El Nino since 1998.

http://bobtisdale.blogspot.com/2010/02/preliminary-january-2010-sst-anomaly.html
The ocean makes up 2/3 of the planet and dominates the global temperature average. Bob reports that “NINO3.4 SST anomalies peaked about five weeks ago and they’ve been dropping like a stone” so we may be in for a repeat of 2007. The Met Office is doing their part to make it happen.
Met Office : Climate could warm to record levels in 2010
10 December 2009
http://www.metoffice.gov.uk/corporate/pressoffice/2009/pr20091210b.html
In the meantime, try to stay warm during the “record heat.”

http://wxmaps.org/pix/temp1.html

http://wxmaps.org/pix/temp4.html

http://wxmaps.org/pix/temp3.html
Flashback to 2007
Dr. Roy Spencer reported that January, 2010 was the warmest on record at +0.72C anomaly after a relatively cool +0.28 in December. Dr. Spencer is one of the most trustworthy players in climate science and clearly does not have a warming agenda. So is earth’s climate warming out of control after all?
To answer this question, it is worth looking back at the “second warmest January” which came in 2007. Like 2010, January, 2007 also took a big jump up from the previous month and was at the peak of an El Nino. The warm weather led the Met Office and to forecast a record warm year. Hansen also speculated about the possibility of a “Super El Nino.”
4 January 2007
2007 – forecast to be the warmest year yet
2007 is likely to be the warmest year on record globally, beating the current record set in 1998, say climate-change experts at the Met Office. http://www.metoffice.gov.uk/corporate/pressoffice/2007/pr20070104.html
But the Met Office was wrong in 2007. Instead of breaking the temperature record, temperatures plummeted nearly 0.8C to below normal after El Nino quickly faded – as you can see in the graph below.

Source : Wood For Trees – Late 2006 to mid 2008
One big difference between January, 2007 and January, 2010 is that this time around, land temperatures are not so warm. Many parts of the planet have been reporting near record cold temperatures, in particular Europe, Siberia, Antarctica and the US.
So what is going on in 2010? Bob Tisdale has reported that this is the warmest El Nino since 1998.

http://bobtisdale.blogspot.com/2010/02/preliminary-january-2010-sst-anomaly.html
The ocean makes up 2/3 of the planet and dominates the global temperature average. Bob reports that “NINO3.4 SST anomalies peaked about five weeks ago and they’ve been dropping like a stone” so we may be in for a repeat of 2007. The Met Office is doing their part to make it happen.
Met Office : Climate could warm to record levels in 2010
10 December 2009
http://www.metoffice.gov.uk/corporate/pressoffice/2009/pr20091210b.html
In the meantime, try to stay warm during the “record heat.”
http://wxmaps.org/pix/temp1.html
http://wxmaps.org/pix/temp4.html
http://wxmaps.org/pix/temp3.html
Pamela Gray (14:04:18) :
So what to do? Present temperature anomalies just like Nino anomalies: IE a three month moving average. Jan-Feb-Mar, Feb-Mar-May, Mar-May-Jun, etc. Why it isn’t just stuns me.
Trying to do away with April showers Pamela? 😉
I am not sure that it is correct to speak of the ocean being heated by CO2 as CO2 is not an inherent source of heat.
As best I can determine, the contribution of CO2 to the greenhouse effect is on the order of one degree Celsius for each complete doubling of the CO2 concentration in the atmosphere. This is equivalent to saying that the warming from the pre-industrial era, when the CO2 concentration was on the order of 280 ppm, is given by the following formula:
W=(1/Ln(2))*(Ln(CO2)-Ln(280)) where CO2 is the CO2 concentration in ppm.
Science Daily reports that a “10 percent drop in water vapor ten miles above Earth’s surface has had a big impact on global warming, say researchers in a study published online January 28 [2010] in the journal Science. The findings might help explain why global surface temperatures have not risen as fast in the last ten years as they did in the 1980s and 1990s.”
Steve Goddard (18:57:23) :
“But what we are seeing now is cold land temperatures and warm sea temperatures.”
Nonsense. The RSS land anomaly for January is 0.795 C while for the oceans it’s 0.565 C. Dr Roy Spencer’s plot in the post below shows that historically when the global temperatures are high, so are sea-surface temperatures.
You won’t get very far in understanding the cause of this warming if you misread the data.
Pamela Gray (16:14:04) : Are you asking if the response of global temperatures to an El Nino event is greater now than it was decades ago? As far as I know there has not been a noticeable change. Now my question, whould there be one? That is, if anthropogenuc greenhouse gases were having an effect, should we see a greater global response now than we had in the past? Scientists assume the response has been linear, that the response to the 2007 event was the same as in 1997, 1982, 1972, etc. But should it be increasing with time?
Pamela Gray (16:14:04): Oops. My question should read, Now my question, should there be one? Not whould there be one?
Pamela Gray (14:04:18) :
These kinds of blog posts: our monthly “how cold/hot was it”, beg for a better way of analyzing temperature data. Once again and I will type slowly: The…Earth’s temperature machine…does…not…care…what…day/week/month…it…is. It does not have a 30 day monthly period (though it appears the weather back East appears to be quite irritable). Comparing this January to a past January is nonsense. But we are human creatures all live with monthly calendars. So what to do? Present temperature anomalies just like Nino anomalies: IE a three month moving average. Jan-Feb-Mar, Feb-Mar-May, Mar-May-Jun, etc. Why it isn’t just stuns me.
Fair enough, Pamela.
Nov-Dec-Jan for 2009-2010 is the warmest NDJ period in the UAH record.
Steve Goddard (18:44:49) :
Alaska, Brazil, parts of Australia and southern Africa have actually been running below normal.
http://www.esrl.noaa.gov/psd/map/images/fnl/sfctmpmer_01a.fnl.anim.html
The last 30 days (includes most of Jan)
http://www.esrl.noaa.gov/psd/map/images/rnl/sfctmpmer_30a.rnl.html
Even in the NH, land areas are warmer than average overall.
Tom P (01:39:07) :
You won’t get very far in understanding the cause of this warming if you misread the data.
Since you think it’s co2, we’ve got further than you have at least. 😉
Tom P,
RSS shows very cold January temperatures across the US, Europe, Siberia and Central Asia. However, the Canadian Arctic and Greenland was minus 20C instead of the normal minus 25C – due to the record low Arctic Oscillation. This drove the average land anomaly up. Is minus 20C what you consider warm?
http://www.remss.com/data/msu/graphics/TLT/medium/global/ch_TLT_2010_01_anom_v03_2.png
Tom P,
Pond Inlet, Nunavut is near the center of the RSS January “hot spot” which drove the land average up. Temperatures in January averaged -22F in Pond Inlet.
http://www.wunderground.com/history/airport/CYIO/2010/1/7/MonthlyHistory.html
http://maps.google.com/maps?q=Pond+Inlet,+Nunavut&oe=utf-8&client=firefox-a&ie=UTF8&hl=en&hq=&hnear=Pond+Inlet,+Nunavut,+Canada&ll=70.377854,-82.617187&spn=86.201591,360&z=2
http://www.remss.com/data/msu/graphics/TLT/medium/global/ch_TLT_2010_01_anom_v03_2.png
Do you consider -22F to be warm?
Viljujsk, Russia is near the center of the RSS Russian cold spot, and averaged -29F in January.
http://www.wunderground.com/history/station/24641/2010/1/8/MonthlyHistory.html
http://maps.google.com/maps?q=Viljujsk,+Russia&oe=utf-8&client=firefox-a&ie=UTF8&hl=en&hq=&hnear=Russian+Federation,+Sakha+Republic,+Vilyuyskiy+rayon,+Vilyuysk&ll=60.500525,162.421875&spn=51.983077,203.203125&z=3
What this shows is that the “global temperature average” can be a dodgy concept.
John Finn,
The map you sent over is low resolution and smears in February data, but did confirm my assertion that Alaska and parts of Australia were below normal in January. The RSS January map confirms that Southern Africa was below normal in January. NCEP showed Brazil below normal in January, but RSS showed it slightly above.
Steve Goddard (07:13:01) :
“What this shows is that the “global temperature average” can be a dodgy concept.”
It’s the anomaly that is important, not the absolute temperature. Of course there were plenty of very cold places in January, but on the whole the lower troposphere over the ocean, and especially the land, was considerably warmer than normal.
What’s dodgy here is you ability to comprehend this.
Tom P,
OK, so predict that UAH anomaly will not drop this year when El Nino fades and the AO returns to normal. I’ll mark that one down and we can discuss later.
Tom P,
You said “on the whole the lower troposphere over the ocean, and especially the land, was considerably warmer than normal.”
Your statement is misleading. The “average” anomaly was above normal, due to a large area of warm water in the South Pacific and a large positive anomaly over the Canadian Arctic and Greenland. That tells you nothing about the distribution of temperature in the rest of the land areas. The AO has pushed cold air down south, making Canada less cold than their January average. To say that land “was considerably warmer than normal” is not accurate for much of the planet – where the land was actually considerably colder than normal.
At the center of the RSS hot spot:
Steve Goddard (07:40:24) :
John Finn,
The map you sent over is low resolution and smears in February data, but did confirm my assertion that Alaska and parts of Australia were below normal in January. The RSS January map confirms that Southern Africa was below normal in January. NCEP showed Brazil below normal in January, but RSS showed it slightly above.
There are bound to be some differences. The NCEP anomaly map represents the surface while RSS and UAH are measuring temperature in the lower troposphere. Incidentally what base period is NCEP using. It looks like 1966-1996 but I can’t make out the start year properly.
Steve Goddard (09:58:38) :
I would be very surprised if the UAH anomaly didn’t drop. It’s remarkably high, +0.83 C, at present, especially given that the current El Nino is nothing like as strong as in 1998. But I also think there is a good chance of 2010 being the hottest year seen since satellite records began.
“To say that land “was considerably warmer than normal” is not accurate for much of the planet – where the land was actually considerably colder than normal.”
Please look at: http://www.remss.com/data/msu/graphics/TLT/medium/global/ch_TLT_2010_01_anom_v03_2.png
Much less of the land area is coloured blue rather than red or yellow. There is nothing misleading in saying that on the whole the land was considerably warmer than normal. You are misrepresenting the data when you claim otherwise.
Tom P,
Very few people will remember January, 2010 as being record heat, but many will remember it as being near record cold and snow.
The RSS and UAH January land anomalies are heavily skewed by the Canadian Arctic reading at 14,400 feet. If you look at the UAH near surface layer CH4, you will see that the anomalies are much smaller. Likewise, the ground based thermometer readings in the Canadian Arctic also show a different story.
http://www.wunderground.com/history/airport/CYIO/2010/1/7/MonthlyHistory.html
Note that Pond Inlet, Nunavut (near the center of the RSS hotspot) spent half of the month far below normal.
A deeply negative AO means warm air in the upper atmosphere over the Arctic. It is essentially an inversion. The high January satellite anomaly indicates to me that measuring land temperatures at 14,400 feet has some serious limitations.
http://nsidc.org/arcticmet/patterns/arctic_oscillation.html
My guess is that GISS will not show such a large January spike, just like it didn’t in 1998.
Steve Goddard (11:44:53) :
“The high January satellite anomaly indicates to me that measuring land temperatures at 14,400 feet has some serious limitations.”
You were quite happy to rely on lower-troposphere satellite measurements when you thought they showed a cooling trend:
http://wattsupwiththat.com/2009/01/18/giss-divergence-with-satellite-temperatures-since-the-start-of-2003/#more-5166
But now they’re showing unprecedented warming, you reckon they have “serious limitations”. Some consistency would be nice!
“Steve Goddard (10:32:40) :
At the center of the RSS hot spot:
Iqaluit: ‘Cold enough to freeze a can of 10W30′
[…]
The G7 finance ministers appear to be more concerned – even alarmed – at the prospect of being fed raw seal meat, being eaten by polar bears, and of course braving the Nunavut capital’s freezing temperatures.”
No pina colada, samba dancers and enchiladas there by now? I’m relieved. Maybe there is still a glimmer of hope for humanity.
Oops — I should have de-indented the second portion instead of further indenting it.
Roger Knights (14:16:04) :
“The skeptics seem to be more willing to put their money where their mouth is.”
Readers of this site were remarkably reluctant to bet against me concerning UAH temperature trends last year. But I’ll have a look at that site – the odds look pretty good, especially that 2010 will be warmer than 2009.
Paul Vaughan (13:57:34) :
How do you explain the regularity of the QBO? and of polar motion? and what of spatial autocorrelation? Surely all “chaos”. (sarcasm)
Perhaps your confusing chaos with randomness, Paul. Deterministic chaos does have structure and order, but is unpredictable. That’s why instead of regular cycles which happen on the same timings, with the same magnitude, in climate we get quasi-cycles, like the atmospheres Quasi-Biennial Oscillation, and the polar motion is made up by two quasi-periodic components and a gradual ‘drift’.
Tom P,
You are changing the subject again, which you seem to like to do. This article is about predicting that UAH temperatures will drop as the year progresses – and you have acknowledged that you agree.
I use NCDC/USHCN ground based measurements for most of my articles, simply because they have a longer temperature record than satellites. Clearly there are problems with both ground based and satellite readings. When there is a temperature inversion, satellite data at 14,000 feet is going to give very different numbers from temperatures recorded on the ground. On the other hand, the paucity of data used by GISS in the Canadian Arctic is also problematic.
I don’t buy the idea that the current warm spot at 14,400 feet over the Canadian Arctic has anything to do with CO2. Would you disagree?