Steve Goddard points out that warm SST events often have a downside. My view: something like capacitor discharge in an RC circuit. – Anthony

Dr. Roy Spencer reported that January, 2010 was the warmest on record at +0.72C anomaly after a relatively cool +0.28 in December. Dr. Spencer is one of the most trustworthy players in climate science and clearly does not have a warming agenda. So is earth’s climate warming out of control after all?
To answer this question, it is worth looking back at the “second warmest January” which came in 2007. Like 2010, January, 2007 also took a big jump up from the previous month and was at the peak of an El Nino. The warm weather led the Met Office and to forecast a record warm year. Hansen also speculated about the possibility of a “Super El Nino.”
4 January 2007
2007 – forecast to be the warmest year yet
2007 is likely to be the warmest year on record globally, beating the current record set in 1998, say climate-change experts at the Met Office. http://www.metoffice.gov.uk/corporate/pressoffice/2007/pr20070104.html
But the Met Office was wrong in 2007. Instead of breaking the temperature record, temperatures plummeted nearly 0.8C to below normal after El Nino quickly faded – as you can see in the graph below.

Source : Wood For Trees – Late 2006 to mid 2008
One big difference between January, 2007 and January, 2010 is that this time around, land temperatures are not so warm. Many parts of the planet have been reporting near record cold temperatures, in particular Europe, Siberia, Antarctica and the US.
So what is going on in 2010? Bob Tisdale has reported that this is the warmest El Nino since 1998.

http://bobtisdale.blogspot.com/2010/02/preliminary-january-2010-sst-anomaly.html
The ocean makes up 2/3 of the planet and dominates the global temperature average. Bob reports that “NINO3.4 SST anomalies peaked about five weeks ago and they’ve been dropping like a stone” so we may be in for a repeat of 2007. The Met Office is doing their part to make it happen.
Met Office : Climate could warm to record levels in 2010
10 December 2009
http://www.metoffice.gov.uk/corporate/pressoffice/2009/pr20091210b.html
In the meantime, try to stay warm during the “record heat.”

http://wxmaps.org/pix/temp1.html

http://wxmaps.org/pix/temp4.html

http://wxmaps.org/pix/temp3.html
Flashback to 2007
Dr. Roy Spencer reported that January, 2010 was the warmest on record at +0.72C anomaly after a relatively cool +0.28 in December. Dr. Spencer is one of the most trustworthy players in climate science and clearly does not have a warming agenda. So is earth’s climate warming out of control after all?
To answer this question, it is worth looking back at the “second warmest January” which came in 2007. Like 2010, January, 2007 also took a big jump up from the previous month and was at the peak of an El Nino. The warm weather led the Met Office and to forecast a record warm year. Hansen also speculated about the possibility of a “Super El Nino.”
4 January 2007
2007 – forecast to be the warmest year yet
2007 is likely to be the warmest year on record globally, beating the current record set in 1998, say climate-change experts at the Met Office. http://www.metoffice.gov.uk/corporate/pressoffice/2007/pr20070104.html
But the Met Office was wrong in 2007. Instead of breaking the temperature record, temperatures plummeted nearly 0.8C to below normal after El Nino quickly faded – as you can see in the graph below.

Source : Wood For Trees – Late 2006 to mid 2008
One big difference between January, 2007 and January, 2010 is that this time around, land temperatures are not so warm. Many parts of the planet have been reporting near record cold temperatures, in particular Europe, Siberia, Antarctica and the US.
So what is going on in 2010? Bob Tisdale has reported that this is the warmest El Nino since 1998.

http://bobtisdale.blogspot.com/2010/02/preliminary-january-2010-sst-anomaly.html
The ocean makes up 2/3 of the planet and dominates the global temperature average. Bob reports that “NINO3.4 SST anomalies peaked about five weeks ago and they’ve been dropping like a stone” so we may be in for a repeat of 2007. The Met Office is doing their part to make it happen.
Met Office : Climate could warm to record levels in 2010
10 December 2009
http://www.metoffice.gov.uk/corporate/pressoffice/2009/pr20091210b.html
In the meantime, try to stay warm during the “record heat.”
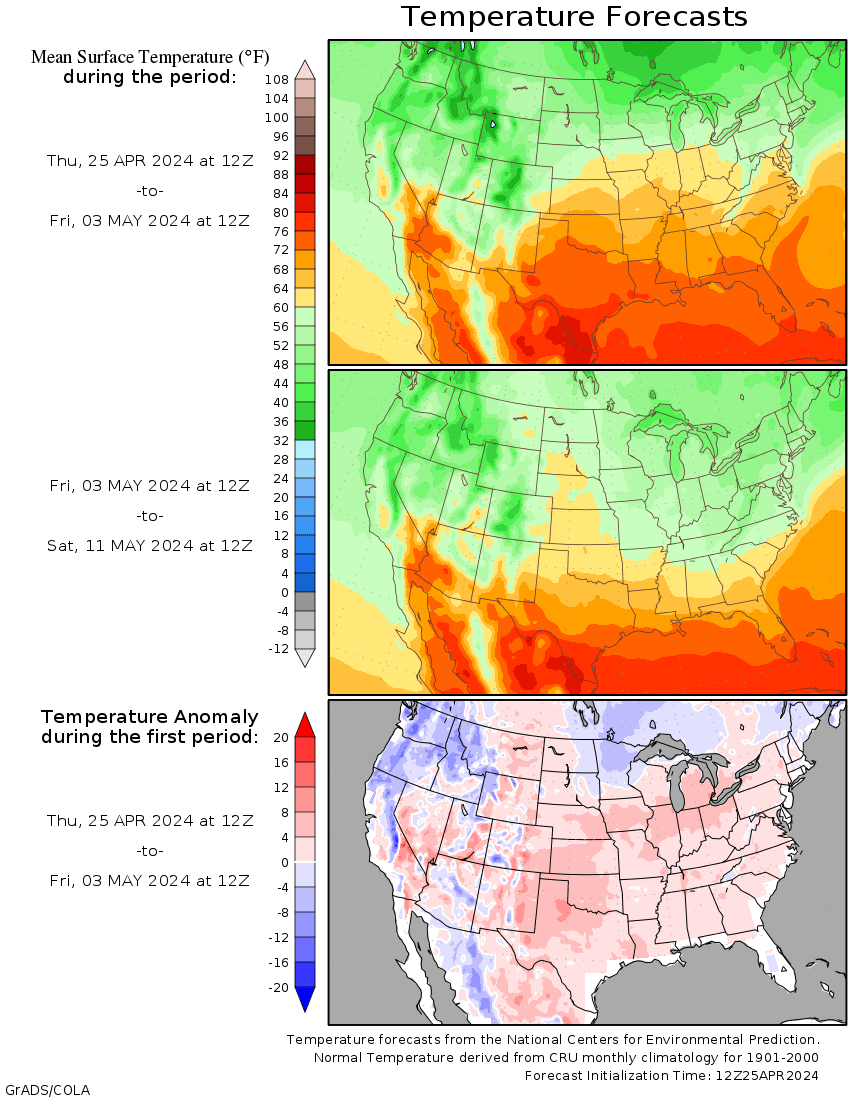
http://wxmaps.org/pix/temp1.html
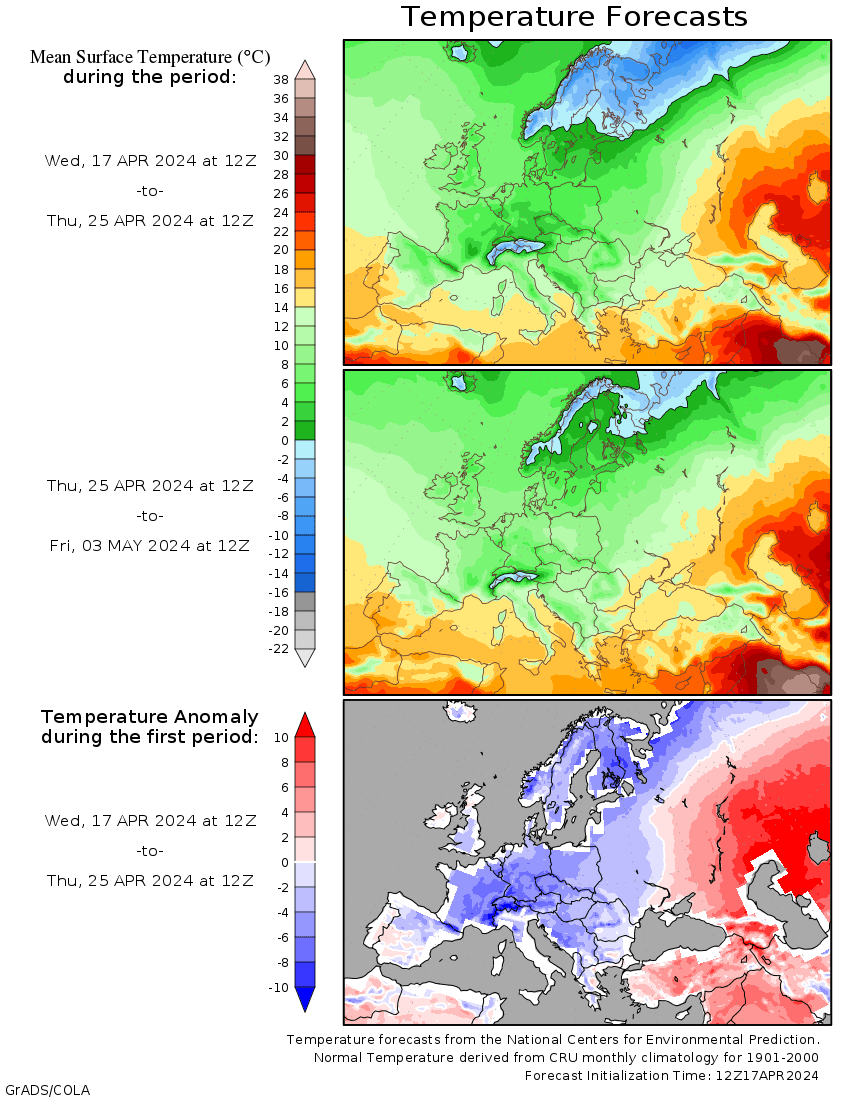
http://wxmaps.org/pix/temp4.html
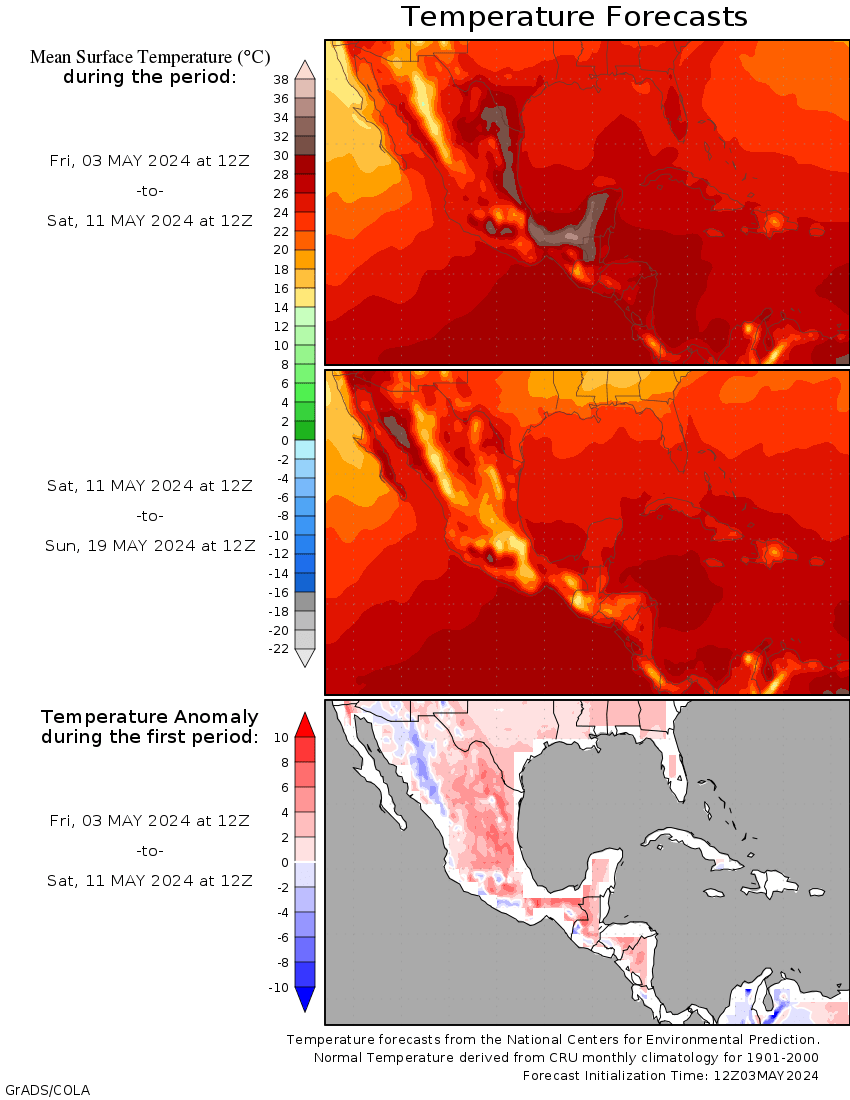
http://wxmaps.org/pix/temp3.html
@R. Gates (14:11:19)
“…. Now we are seeing an increasingly active sun with its irradiance steadily increasing toward the solar max of 2013.”
We are currently in solar cycle 24. Australian scientist David Archibald is of the opinion that in the next 20 years, solar cycles 24 and 25 will be diminutive.
“In this presentation, I will demonstrate that the Sun drives climate, and use that demonstrated relationship to predict the Earth’s climate to 2030. It is a prediction that differs from most in the public domain. It is a prediction of imminent cooling.”
David Archibald
International Conference on Climate Change
March, 2008
http://www.warwickhughes.com/agri/Solar_Arch_NY_Mar2_08.pdf
From The Times Jan 5, 2010
http://www.timesonline.co.uk/tol/news/weather/article6975867.ece
Arctic air and record snow falls gripped the northern hemisphere yesterday, inflicting hardship and havoc from China, across Russia to Western Europe and over the US plains.
There were few precedents for the global sweep of extreme cold and ice that killed dozens in India, paralysed life in Beijing and threatened the Florida orange crop. Chicagoans sheltered from a potentially killer freeze, Paris endured sunny Siberian cold, Italy dug itself out of snowdrifts and Poland counted at least 13 deaths in record low temperatures of about minus 25C (-13F).
I got news for these folks. I live in the middle of the Pacific and it has been freezing, December and January, albeit dry except at higher levels.
–Offhand you’d think the little fiberglass fibers could do something similar – I don’t know anything about that except you obviously don’t want to inhale fiberglass, which can literally shower from uninclosed batts.–
I was thought to be at risk of silicosis at one point (very similar to asbestosis but caused by silica instead), turned out to be sarcoid instead, so I know a bit about this stuff.
Asbestosis, black lung, silicosis, etc, are caused by the microscopic fibers which are inhaled and lodge so deeply in the alveoli they cannot be expelled.
According to my pulmonary doc, fiberglass fibers are simply to large to do the same thing.
And mesothelioma itself is not, IIRC, technically a lung cancer. It begins as cancer of the pleura surrounding the lungs. It can also occur in the peritoneum or abdominal pleura. I’m open to correction by more knowledgable folks.
There is a significant difference in SSTs already from January 4 to Feb 4.
Jan 4: http://www.osdpd.noaa.gov/data/sst/anomaly/2010/anomnight.1.4.2010.gif
Feb 4: http://www.osdpd.noaa.gov/data/sst/anomaly/2010/anomnight.2.4.2010.gif
El Nino is definitely waning. Feb’10 will be much closer to normal than Jan’10
Bob Tisdale (06:43:22) :
tallboke: Disregard my 06:39:46 comment. Excuse my mistake. I missed the word “away” in your opening sentence. I must not be awake. I’ll read your post after some coffee.
Bob, no worries, and thanks for your input on my blog. I’ve replied to the best of my ability.
Found a very nice NOAA Weekly Report that supports Bob’s observations. It looks like the weekly shows more trend detail then the monthly report for Jan.
http://www.cpc.ncep.noaa.gov/products/analysis_monitoring/lanina/enso_evolution-status-fcsts-web.pdf
NOAA SST: Nino Regions SST Departures – Recent Evolution
page 5: Regions 3, 3.4, and 4 are showing rapid decline since Jan. 2010. Nino region 1+2 is showing a recent increase in weekly temperature.
page 10:Central & Eastern Pacific Upper Ocean weekly SST (0-300m) also shows rapid decline since Jan. 2010.
page 13: Atmospheric Circulation over the North Pacific & North America During the Last 60 Days show the Temp. Anoms.
page 16: Oceanic Kelvin Waves
page 19: Outgoing Longwave (OLR)
additional pages show models and forecast and summary
Tenuc (23:30:29) “One of the problems that we and the whole of climate science face is that because of deterministic chaos […] However, turbulent systems can also change state very quickly in unpredictable directions […]”
How do you explain the regularity of the QBO? and of polar motion? and what of spatial autocorrelation? Surely all “chaos”. (sarcasm)
These kinds of blog posts: our monthly “how cold/hot was it”, beg for a better way of analyzing temperature data. Once again and I will type slowly: The…Earth’s temperature machine…does…not…care…what…day/week/month…it…is. It does not have a 30 day monthly period (though it appears the weather back East appears to be quite irritable). Comparing this January to a past January is nonsense. But we are human creatures all live with monthly calendars. So what to do? Present temperature anomalies just like Nino anomalies: IE a three month moving average. Jan-Feb-Mar, Feb-Mar-May, Mar-May-Jun, etc. Why it isn’t just stuns me.
Pamela,
Sorry you think this is post ridiculous. Lets check back in a few months and see if the implied predictions are correct.
The ‘this year’ – ‘last year (at this time)’ measurements act as a simple filter to null out annual periodicities. It is much like a one year moving average or one year moving sum except that is does not smooth out shorter period effects.
I recall one amateur meteorologist who kept track of the one year moving rainfall sum at his home. Once he charted a mid-year point where the one-year total rainfall was less than half the normal annual amount for this area. That fact was not evident in the normal year-to-date numbers issued by the weather bureau.
Steve wrote:
Steve Goddard (19:32:22) :
“My high school girlfriend’s father was a non-smoking dock worker in WWII, who was exposed to asbestos on the docks. He died a horrible death at age 55 from asbestosis.”
Steve,
Your girlfriend’s father smoked alright. Smoking was so prevalent in WWII and in all public places that non-smokers inhaled vast quantities of ciggy smoke. Don’t forget that populated areas had high smoke levels from vehicles, industry, and home fires. Airborne pollution was a problem.
The asbestos abatement engineers that I have worked with never wore masks, gloves, or protective gear when analyzing samples for me. They always laughed at me when I handled the abestos samples as if they were radioactive.
The other posters are correct. A person has to inhale FINE asbestos dust for a lifetime along with another agent, like ciggarette smoke, to form asbestosis. I am cautous when I handle asbestos, but I am not paranoid over the stuff.
Pamela Gray (14:04:18) :
Pamela, you are one smart person! What you wrote seems so logical.
Baa Humbug (16:56:47) :
I like and agree with your layman’s explanation. Anthony’s capacitor discharge is another analogy that I like.
markm
Steve, I did not say you are nonsensical or that your post was nonsense. Please don’t accuse me of words I did not say. I am simply repeating my opinion about how global temperature anomalies are reported. The habit of reporting same month anomaly is nonsense. The Earth does not care about Jan 1 through Jan 30. We would do better with a running 3-month average as that would take into account the fact that the Earth knows no such 30-day time tables. So I say again, it is nonsense to compare one month in one year with the same month in another year as if that helps us understand cause and effect, and trends. Maybe it is more important to compare this January with December or February a few years back, because the conditions were similar but Earth’s winter conditions were not between the exact dates. Do you see my point?
To continue the discussion, it would be good to compare temperature anomaly responses to El Nino’s, regardless of the month they occur in (or months). Since it is anomalies we are talking about, the month doesn’t matter. Are we getting hotter with each El Nino (an AGW suggestion)? In other words, it don’t matter what month we are talking about. It matters greatly that we compare El Nino to El Nino global temperature anomaly response.
Pamela,
El Nino is normally a winter phenomena and peaks around January or February. The 1998 El Nino produced warmer anomalies than the 2010 El Nino, but they peaked in February.
The month does matter, which is the point of this article – the similar behavior to the previous El Nino of 2007.
Pamela
From the Wikipedia I see that the ENSO (El Niño Southern Oscillation) period is typically five years, but varies from three to seven years. I presume one could try a ten-year moving average to minimize this effect.
Precisely.
The coldest and most severe Winter for Northern Hemisphere land areas
(North America, Europe, Russia, East Asia) in many, many decades.
Makes me wonder “what”(if anything) we ARE measuring.
ENSO is fading fast.
A massive drop in “Global” temps is inevitable this year.
The obvious point so far is – the worldwide “science” community can’t predict climate change because they have been focused on minor aspects of a system they can’t fully define?
Can anyone point me to a climate model that embraces all aspects of the climate system?
If you can’t, what is this logic based on?
I’m not saying to get rid of variation by smoothing it away, I am saying record the variations in an Earth sense, not a human sense. Steve, it is useful to talk about the El Nino winter temperature period of 98, 07, and the current one, as it relates to the El Nino three month running average (which is the way El Nino is recorded, not single month by single month). Are we seeing a warming temperature trend with each one? The only way to compare would be to use the temp anomaly 3-month running average, taking into account the temperature response delay we usually see, and determine if things are getting hotter. Saying that January 2010 is the hottest recorded January anomaly does not tell us if it is getting warmer due to CO2 causing increased long wave radiation making El Nino’s warmer. El Nino induced warm temps are perfect measures of increased long wave radiation from increasing greenhouse affect, is it not? So does it matter if the month is December, January, or February? No. What matters is if the El Nino warm peak is getting hotter.
Very interesting thought, PDO seems to want to go back to a negative phase, note warm waters along western Canada and Alaska.
Just so no one thinks you are just picking cold weather anomalies here are some tidbits about warm areas. While much of the USA, Mexico and Europe/Asia are very cold for the next 2 weeks (coldest in 15-20 years), most of Canada, Africa, Greenland, Alaska, South America and the southern Oceans are trending warmer than normal.
I’d like send you a plot of the expected world temperature anomalies for the next 2 weeks, just don’t know how…
wxtrendsguy,
Just post links. Here I’l do it for you.
http://wxmaps.org/pix/temp1.html
http://wxmaps.org/pix/temp2.html
http://wxmaps.org/pix/temp3.html
http://wxmaps.org/pix/temp4.html
http://wxmaps.org/pix/temp5.html
http://wxmaps.org/pix/temp6.html
http://wxmaps.org/pix/temp7.html
http://wxmaps.org/pix/temp8.html
http://wxmaps.org/pix/temp9.html
http://wxmaps.org/pix/temp10.html
http://wxmaps.org/pix/temp11.html
Alaska, Brazil, parts of Australia and southern Africa have actually been running below normal.
http://www.esrl.noaa.gov/psd/map/images/fnl/sfctmpmer_01a.fnl.anim.html
Pamela,
CO2 should warm temperatures over land much more rapidly than it does over the ocean. But what we are seeing now is cold land temperatures and warm sea temperatures. So I don’t see how the current high UAH anomalies can be attributed to CO2.
Land cools off much more rapidly than oceans do so I am not too concerned about the temporary direct greenhouse affect on land. Besides, the argument has been made that CO2 related heat is being stored in the oceans. I don’t think so. It has also been postulated that weather extremes will happen as a result of CO2. Again, I don’t think so. El Nino is far and away the stronger reason for weather and I want to show the correlation between SST conditions and the delayed but moderately predictable affects on global temps. To be clear, I am trying to state the case for the hydrologic/atmospheric cycle as the cause of temperature behavior and trends, short and long term, as opposed to CO2. Therefor, temperature needs to be analyzed and reported in the same way SST’s are in terms of El Nino/La Nina and other SST oscillations. If they were, we would not be dealing so much with ideas that the Sun is cooling the planet, or CO2 is heating it up. We instead would be learning about the real connections that make up our weather pattern variations. Once that is understood by the general public, a case can be made for or against man-made changes in weather pattern variations.
Capacitor discharge? Yes. With a capacitor with severe dielectric absorption.
Pamela,
I’m not trying to solve the fundamentals of climate science in this article (or any other.) I’ll leave that to other people like yourself. I’m just saying that I expect to see a similar pattern in UAH temperatures as 2007 – for the same reasons as it happened in 2007.