By Joseph D’Aleo, AMS Fellow, CCM
In this recent post, we discussed the problems with recent data that showed the argument presented by the EDF’s millionaire lawyer playing clueless environmentalist on Lou Dobbs Tonight that this will be the warmest decade is nonsense. This claim was well refuted and Al Gore’s credibility disassembled by Phelim McAleer, of the new documentary Not Evil, Just Wrong that challenges the lies and exaggerations (totalling 35) in Al Gore scifi horror comedy film, An Inconvenient Truth. 9 were serious enough for a UK judge to require a disclaimer itemizing them be read whenever, the movie was shown in the schools.
The world’s climate data has become increasingly sparse with a big dropoff around 1990. There was also a tenfold increase in missing months around the same time. Stations (90% in the United States which has the Cadillac data system) are poor to very poorly sited and not properly adjusted for urbanization. Numerous peer review papers suggest an exaggeration of the warming by 30%, 50% or even more. The station dropout can be clearly seen in the two maps below with the number of station going from over 6000 to just 1079 from April 1978 to April 2008.


See the big gaps in the recent data in Canada, Greenland, Africa, South America, parts of western Asia, parts of Australia.
SEE FOR YOURSELF
Take this test yourself to see how bad a shape the global data base is. Look for yourself following these directions using the window into the NOAA GHCN data provided by NASA GISS here.
Point to any location on the world map. You will see a list of stations and approximate populations. Locations with less than 10,000 are assumed to be rural (even though Oke has shown that even a town of 1,000 can have an urban warming of 2.2C).
You will see that the stations have a highly variable range of years with data.
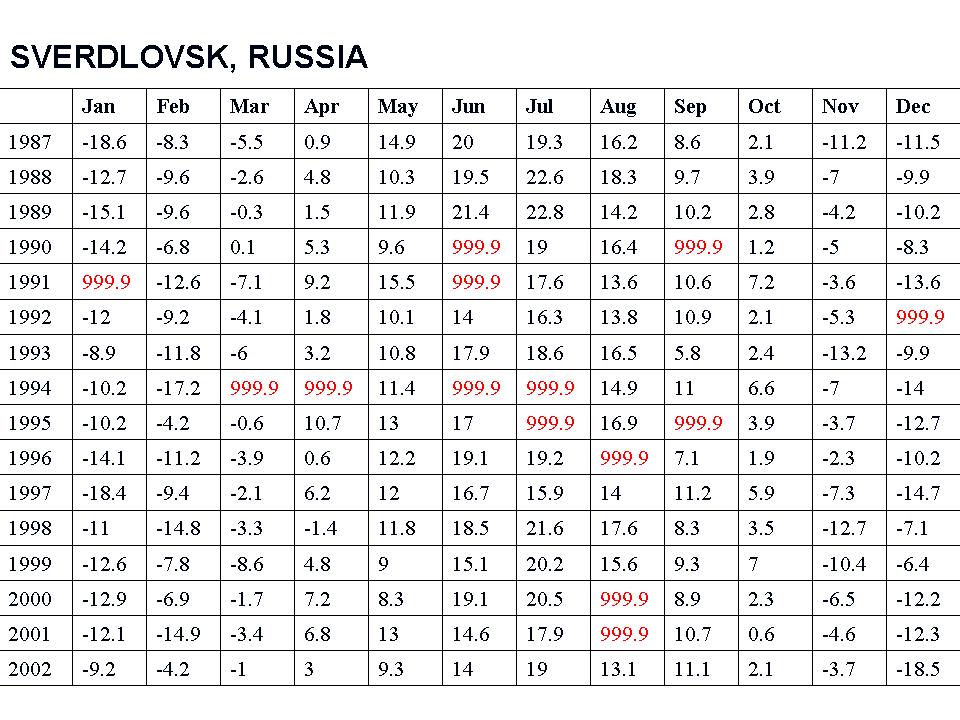
Try and find a few stations with data that extends to 2009. To see how complete the data set is for that station, click in the bottom left of the graph Download monthly data as text.
For many, many stations, you will see the data set in a monthly tabular form has many missing data months mostly after 1990 (designated by 999.9).

See larger image here
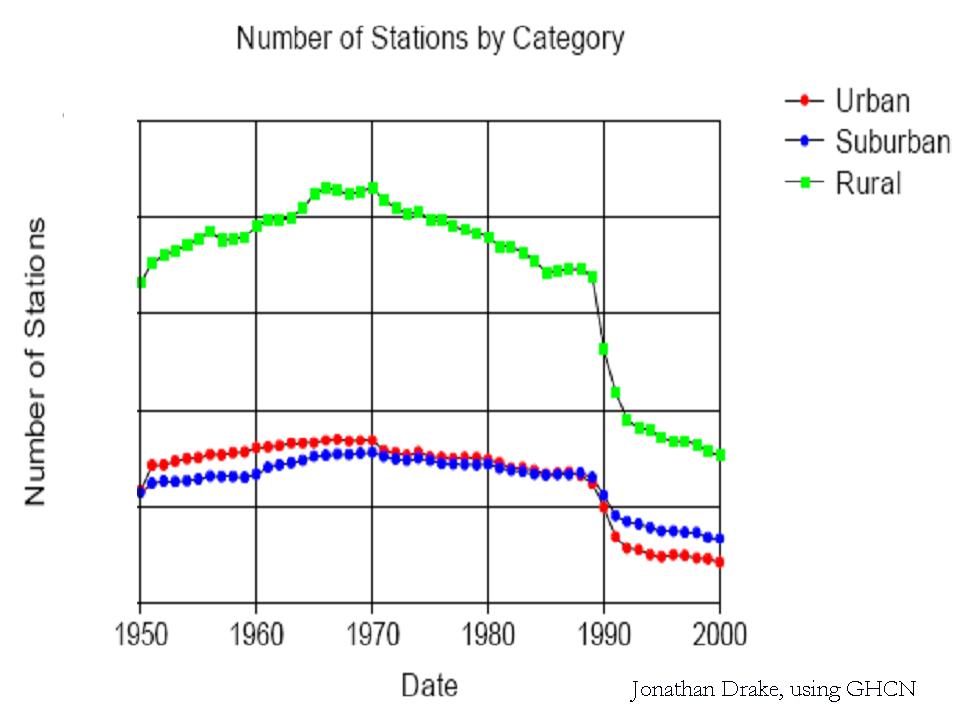
This required the data centers to estimate data for the grid box for that location with other stations nearby (homogenization). In the 2008 plot above only 1079 stations were used. NASA went to locations within 250 km (155 miles) to find data for the grid boxes. For grid boxes without stations within 250 km, they are left blank, thus the large gaps.
Most of the stations that dropped out were rural. More of the missing data points are having their missing months filled in with more urban data in the grid boxes.

See larger image here
WUWT Volunteer John Goetz created this video that shows the worldwide dropout of weather stations:
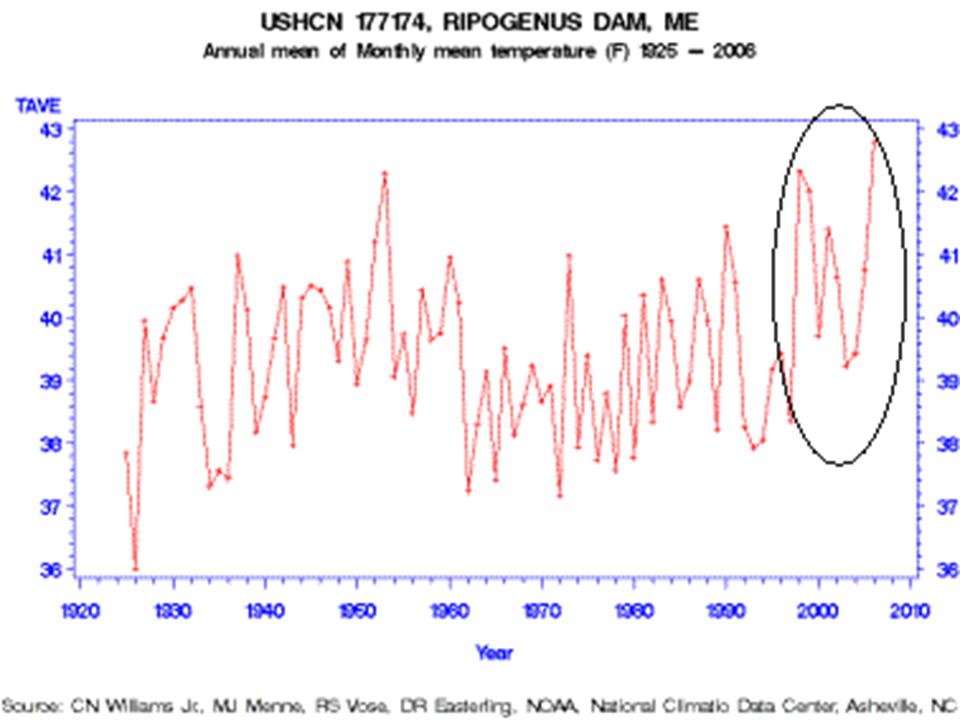
One example of how good or bad this works is from Maine. Volunteers completed surveys of the United States Historic Climate Network (USHCN) temperature stations in Maine for Anthony Watts surface station evaluation project. The survey determined that every one of the stations in Maine was subject to microclimate or urbanization biases. One station especially surprised the surveyors, Ripogenus Dam, a station that was officially closed in 1995.

See larger image here
Despite being closed in 1995, USHCN data for this station is publicly available until 2006! (GISS stopped in 1995)
Part of the USHCN data is created by a computer program called “filnet” which estimates missing values. According to the NOAA, filnet works by using a weighted average of values from neighboring stations. In this example, data was created for a no longer existing station from surrounding stations, which in this case as the same evaluation noted were all subject to microclimate and urban bias, no longer adjusted for. Note the rise in temperatures after this before the best sited truly rural station in Maine was closed. GISS does display this station that did incorporate the “filnet” data input for missing months although as noted they stopped its plot in 1995 which NOAA extended artificially to at least 2006.
How can we trust NOAA/NASA/Hadley assessment of global changes given these and the other data integrity issues? Given that Hadley has destroyed old original data because they were running out of room in their data cabinet, can we ever hope to reconstruct the real truth?
As one of our scientist readers noted: “Well, the 999.9s you showed me today sure opened my eyes…the ramifications are stunning. I knew about the drop-off of stations before but never that existing station reports are so full of gaps or that they’re getting temperature readings from “ghost” stations. This is, as you have said, GARBAGE. See PDF here.
Scott A. Mandia (11:41:16) :
“Of course, your plot shows an increasing trend since 1850 even with the cooling decades so there is an underlying trend upward that I do not believe natural causes can explain. I also think that global dimming caused the cooling before the 1980s or at least offset much of the warming.”
Blah blah blah blah blah….
“You also mention the Wegman Report. That report addresses the 1998 temperature reconstruction. So? The 2008 Mann et al. and newer reconstructions show the same hockey stick even without using tree data.”
You didn’t even read my comment!!! I told you LOOK AT FIGURE 5.8! Do you even know why I reference that specific figure?????
“Also, the NAS report vindicated Mann 1998. I give more weight to NAS than Wegman but it is still a moot point with the newer data sets.”
WRONG!
http://www.climateaudit.org/?p=2322
North UNDER OATH BEFORE A CONGRESSIONAL COMMITTEE, said that Mann’s method was WRONG.
The “newer data sets” are not independent of the older ones and resolve NOTHING.
More “blah blah blah”
“How do you figure there has been a lack of warming in the past 12 years, and, does 12 years change the past 160 regarding trend?”
Because it is, I don’t know, true?
http://masterresource.org/wp-content/uploads/2009/10/cherry-pick_fig2.JPG
And no, it doesn’t! For the last damn time, I’m not refuting the existence of twentieth century warming, I am refuting the claim of accelerating warming! How can you have twelve years of no warming and honest tell me that EVERY DECADE IS WARMING FASTER THAN THE LAST???
Finn, stuff it, your “right” in a pointless, stupid way, that means nothing. Drop this crap, because I won’t respond again.
Timetochooseagain:
I just realized that you are an 18-19 year old freshman college student. I am very impressed with your intelligence. I had always assumed I was speaking to a degree-holding scientists of some sort. Wow, I am being smacked down by somebody who could be sitting in my class. I wish all of my students could be this well-read, bright, and energetic.
I wish to retract my statement “The rate of warming is increasing each decade.” As I said before, I was wrong, dumb, and daft. I admit it.
However, the data shows the past three decades have been warmer than almost all of the decades since 1850 (and if one believes the hockey sticks – the past 2,000 years) and the underlying trend has been up, up, up. There is no “blah, blah, blah” there.
I also think Figure 5.8 of the Wegman Report does NOT disqualify the various proxy records.
Some advice for you now:
According to your blog, you calim to be libertarian/conservative. Don’t you wonder that your libertarian/conservative belief system is clouding your judgement? Those of your political persuasion do not like any type of regulation by the government or other organization of personal or societal activities. Certainly if there is AGW, there will have to be quite a bit of regulation. Isn’t it possible that this idea abhors you so much that you are trying to find a way out?
When you and I chatted about Zhang and the NAO/AGW influence on global precip, you were fairly courteous in your responses. Your latest posts to me and to Finn, although including valuable information, have a very derogatory and condescending tone. People will judge you on both what you say and HOW you say it. Be careful or you may lose credibility. I will chalk this up to you having a bad week and venting on me. No problem – we all do it occasionally.
You are bright but I still think those profesional researchers in the field who are strong supporters of AGW are at least a tiny bit smarter than you. One day you may put them all to shame but it is not today.
Good luck in your college career and always be sure to learn much but also to have much fun doing so.
“Certainly if there is AGW, there will have to be quite a bit of regulation.”
I disagree. It depends on the degree. And even then, there doesn’t have to be regulation, there are other mechanisms.
But let’s be clear on one point. I started out totally agnostic on the science. I’ll admit, I had my doubts but I would never claim to know what I am talking about. My first post on climate audit was to the effect that “I don’t know who is right, but isn’t it reasonable that maybe there can be a solution to the “problem” which is not as objectionable to [well, to us rightists]? After all, it seems plausible that there might be a problem, even if the big proponents are jerks like Gore.”
I was sixteen. And I don’t like to brag about my intelligence. But yes, I have been told I am really smart!
“Your latest posts to me and to Finn, although including valuable information, have a very derogatory and condescending tone.”
Let me be frank. I don’t like Finn’s tendency to be impenetrable and determined to “win” arguments in completely wrong ways-that is, by side stepping normal logic and the arguments themselves.
This got me irritated. And I’m a quarter Spaniard, so that’s…a little hazardous, to say the least. I feel I probably took out my frustration on you too much. Finn, I think, totally deserved it.
“I still think those profesional researchers in the field who are strong supporters of AGW are at least a tiny bit smarter than you.”
Here, I think, I must totally disagree. It’s not that I’m smarter or they’re smarter. I didn’t come to be of a strong opinion and high knowledge base through innate intelligence. I just think, and research, and to be honest, I rely a lot on people who know more than me. These include researchers who are “smarter” than I am, and who are not “strong supporters” of AGW. And I have read their papers in the literature and understand them, kind of. In my mind the whole picture is rather coherent. Of course, you have yet to correctly gauge my true opinion on the issue (hence some of my frustration). I suspect that you think that I think that 1. There is no such thing as Global Warming (I “believe” believe it or not) 2.That AGW is completely wrong (Heavens no! My view of AGW is probably far too nuanced for most of the WUWT readership).
So everyone is clear from now on:
I believe that the world has warmed in the last century if not longer than that. I also believe that some part of that is greenhouse warming. I even believe that the AGW influence is probably more important than the natural factors, if marginally, in causing the late twentieth century warming. But I do NOT believe in the AGW apocalypse.
timetochooseagain (14:53:32) :
Finn, stuff it, your “right” in a pointless, stupid way, that means nothing. Drop this crap, because I won’t respond again.
Scott Mandia (17:25:15) :
Timetochooseagain:
I just realized that you are an 18-19 year old freshman college student. I am very impressed with your intelligence.
18-19? That surprises me – I’d have said more like 8 or 9.
Andrew (11:22:26) :
E.M.Smith (10:29:21) :
The GISS corrections in Pisa would be ROW (ie not US) where they us a completely different UHI correction method that pretty clearly sucks. But I was refering specifically to the US.
GIStemp uses it’s own “UHI correction” and applies it to all the data, US and ROW. The Pisa example is valid as an example of the exact same thing that the exact same program does to the US data. (It is all merged by this step of GIStemp).
You also didn’t answer my question as to the seasonality of UHI or landuse effects, but rather commented on it having something to do with the GISS method.
Sorry, didn’t know I was obligated to answer all your questions for you.
But the winter warming I have seen occurs in many different data sets.
Because they use the same thermometers and suffer the same failings.
Airports are warmer in winter than their surroundings. We are increasingly putting thermometers at airports and more of those airports are in the tropics or southern hemisphere. Average that together and you get global “winter warming” because more thermometers are in places that are warm in winter. (And no, gridding, boxing, and anomalizing don’t make this go away, I’ve measured it all the way through GIStemp. It tries, and fails, to do the correction sufficiently).
For some reason folks love to assert that “Winter warming is to be expected” and then turn around and assert that the “gridding, boxing, and anomaly steps” will take care of any thermometer count issues. Somehow they don’t seem to notice that these two things are mutually exclusive. If the GB&A steps cured the thermometer count issues then both hemispheres would be equally weighted and there is no GLOBAL winter.
So for the globe to warm in N. Hemisphere winter is, on the face of it, evidence for a broken grid, box, and anomaly process and for the unequal distribution of thermometers to be ‘leaking through’ the process.
GISS unfortunately does not seem to have monthly anomalies for the US, so I can’t compare them with NOAA’s, which show a strong winter effect. I’m trying to figure out how real that might be, given the indications that the USHCN used by NOAA still has spurious warming in it (GISS warms considerably less).
You can download the data from NOAA (both GHCN and USHCN) and it has monthly data in it. What is done on the way to “anomalies” is anyones guess.
FWIW, the stations with the longest life span do not show warming in winter to any significant degree. Since it looks like you didn’t bother to follow the link I provided, here is the data. Notice that January (1st column) rises all the way from 1.8 to 1.0 degrees. Oh, Wait, that’s a drop… Maybe February will be better: 2.9 to 2.0. Oops. December? 2.7 to 1.7. This just isn’t working out for that Winter Warming Thing, now is it? November? 6.8 to 6.9! Yeah, hurray, a 0.1 C rise. Too bad it is well inside the error band…
So if you would like to use the link, here it is again:
http://chiefio.wordpress.com/2009/08/13/gistemp-quartiles-of-age-bolus-of-heat/
Now this is the “nearly raw” data before GIStemp manufactures it into anomalies, so don’t expect to find the politically corrected fluctuations in it. And this data is limited to the best longest lived records, so don’t expect to find the bolus of tropical thermometers at airports post WWII nor the burst of jet age airport warming at them. These are just well tended thermometers that have a life span of 103 minimum to 286 maximum years of being recored with the same “modification flag” (meaning, in the same way).
An Inquirer (14:33:27) :
Much has been observed and extensive analysis has taken place on land surface temperature records. However, the seas cover 70% of the earth. I would suggest that those who follow the AGW debate would be very interested in understanding how HadCru and GISS calculates ocean surface temperatures.
GIStemp does not have SST in it until STEP4_5 where it merges in the Hadley data. It does, in STEP3, fabricate SST “data” in the zones, grids, boxes process by taking LAND data and smearing it out over the ocean. (Up to 1200 km away…).
http://chiefio.wordpress.com/2009/09/08/gistemp-islands-in-the-sun/
And please do not say that GISS uses satellite data — that is a very misleading claim even though there is some truth in it.
I examine that misleading claim and find it wanting here:
http://chiefio.wordpress.com/2009/02/28/hansen-global-surface-air-temps-1995/
Scott Mandia (08:33:57) : Urban heat island effects are real but local, and have not biased the large-scale trends. A number of recent studies (see IPCC 2007 Chapter 3) indicate that effects of urbanization and land use change on the land-based temperature record are negligible (0.006ºC per decade) as far as hemispheric- and continental-scale averages are concerned because the very real but local effects are avoided or accounted for in the data sets used.
I’m sorry, but I’ve gone through the GIStemp code. Their UHI correction is seriously broken and in some cases has the sign backwards (i.e. makes the slope of warming greater rather than smaller as a “removal” of UHI).
The notion that the data are correctly adjusted for UHI is what’s broken.
Scott A. Mandia (13:31:03) :
1) All 4 data sets show a warming climate in the past three decades.
Gee, when the PDO was in a warming phase they recorded a warming phase. That’s fine, but has nothing to do with climate. 30 years is just 1/2 of the 60 ish year normal ocean cycle. Oh, and you get to deal with the 176-210 or so year solar cyclicality too. And don’t forget the 1500 year cycle that gives us Bond Events (a cycle that has been going on for hundreds of thousands of years, so don’t expect it to stop any time soon…)
If you are measuring with anything less than about a 3000 year baseline, you are simply riding cyclical ripples and fooling yourself.
http://chiefio.wordpress.com/2009/10/09/how-long-is-a-long-temperature-history/
2) They are fairly close in agreement with warming rates (one cannot just throw out RSS because they do not like the results).
The only problem with this is that GIStemp fudges their data by re-writing the older bit, prior to sats. So sure, the recent stuff can match, but they made the past colder to “find” global warming. Yes, I’ve read the code. Yes, it does this.
3) Joe suggests that there is a serious enough UHI bias that we cannot use this data for policy decisions.
He is right.
4) There is literature that shows UHI and no UHI but the data from point #1 doesn’t show UHI.
And there is literature telling me to prepare for the second coming too.
That the couple of decade trend matches AFTER the major growth of airports and urbanization is not very good evidence that the UHI effect is insignificant to the climate history. Oh, BTW, GIStemp uses airports as pristine rural reference stations to “correct” other stations. I’m sure all that asphalt and jet exhaust wouldn’t change a thing compared to grass and trees /sarcoff>
http://chiefio.wordpress.com/2009/08/23/gistemp-fixes-uhi-using-airports-as-rural/
And the transition of the jet age matters:
http://chiefio.wordpress.com/2009/08/26/agw-gistemp-measure-jet-age-airport-growth/
5) There is a plethora of actual observed effects of rapid climate change if we choose to ignore surface data. Shall we ignore
Sorry, but not in my experience. We’re having some cyclicality is all. It’s been warmer in the past, repeatedly, and it will be colder in the future. “The Ice Man” was only melted out from under his glacier recently. Guess what that means… It means the glacier was not there when he fell down and died. The alps were much warmer when Hanibal crossed with his elephants. Etc. All your “observed effects” are in the range of the normal cyclical variation of the planet.
Now that the PDO has flipped and the sun has quieted down, you will see more “observed effects of rapid climate change”, only it is toward colder and snowy. It’s a cycle. Learn to ride it.
E.M.Smith (06:14:29) : “GIStemp uses it’s own “UHI correction” and applies it to all the data, US and ROW.” This is not correct:
http://www.climateaudit.org/?p=4852
“Outside the US, the GISS meta-data on population and rural-ness is so screwed up and obsolete that their UHI “adjustment” is essentially random and its effectiveness in the ROW is very doubtful.”
Perhaps you would like to explain to Steve how he missed GISS throwing out the nightlight adjustment and now uses the same algorythm in the US and ROW?
“Sorry, didn’t know I was obligated to answer all your questions for you.”
You claim to have the “answer” to my question as to whether UHI effects winter versus summer significantly! But you didn’t answer it. I didn’t ask you, YOU STEPPED FORWARD with an “answer” to a question I hadn’t asked.
“Because they use the same thermometers and suffer the same failings.”
Right, the sattelite data suffers these problems to, presumably. And here I would refer you specifically to RSS because, although it has a spurious trend, it doesn’t have the seasonal problem UAH has right now.
“If the GB&A steps cured the thermometer count issues then both hemispheres would be equally weighted and there is no GLOBAL winter.”
This profoundly misunderstands the situation. If you look at the Northern Hemisphere independently, the NH winter warms more than summer. You are also wrong to assume that a perfect global average would have no seasonal effects. Again, look at the satellite data-even look at the daily non anomalized data, you will see that 1. the amplitude of the NH annual cycle is larger than the southern hemisphere and 2. the warming is generally greater in the NH, too.
Now why do you suppose that the global average has a NH winter effect? Because the hemispheres are not climatically symmetric! You falsely assume that they should show identical behavior, since they are just two halves of the globe. But the SH has more ocean, the NH more land, so that’ what causes it’s dominance.
Scott A. Mandia (05:34:08) : Don’t you ever wonder why there are no peer-reviewed journals articles
IMHO we are simply seeing the decline of the quality of the ‘peers’ in the peer review process. Peer review has always had the issue of “most folks think A, but the guy who shows A is false has trouble getting published”. The history of this is quite large. Plate techtonics comes to mind, there are plenty of others.
that can explain the warming of the modern climate while also showing why rapidly increasing GHGs have had little influence on recent climate change?
You require the proof of a negative. That doesn’t work…
What saddens me the most about posts here at WUWT is that folks here seem to believe one or more of the following so they choose to ignore the current state of climate science:
You left out “The majority of scientists believe the temperature data provided by Hadley and GISS and then go looking for something it would imply in their field; but the basic temperature series products are badly broken so their results are flawed”.
Hadley and GISS work closely together, read the same journals, have the same beliefs, and there will be similar thought processes and thus similar errors.
Basically, I only assume that about a dozen folks in two places are either wrong or crooked (and it might just be one or two leaders in each place) and that then breaks the temperature data. Everything else follows as a natural result.
And i can give strong assurance that GIStemp is broken. I’ve ported it to my computer, have it running, and have deconstructed most of the code. What it does is simply wrong. There isn’t any warming in the records once you pull GIStemp out of the way ( and it is helpful to adjust for thermometer count and location issues.)
3) The majority of scientists around the world are conspiring in order to secure funding.
Does not require a conspiracy. All it takes is “enlightened self interest”. I hear, as a hypothetical, that the Soros Foundation is handing out grant money to study Polar Bear response to global warming, I’m going to apply with a study based on the presumption of Gobal Warming. I’m not going to apply with a grant request that says “AGW is wrong and the thermometers are busted”. This happens all the time. (My spouse is writing a grant request as I type. It is in a different field, but the pattern is the same. They provide money for “foo”, so she is applying for “foo” money.
4) The majority of scientists around the world are just using group speak which implies that they do not think for themselves.
Close. Everyone suffers from “group think” and herd behaviour. It is well documented. If you travel much, you rapidly run into this. I once spent a few extra minutes stuck in a Japanese airport as the customs inspector enquired at length about what shoes I had brought with me. Puzzled, I later asked my travel companion what it was about. He had lived in Japan for years and explained that I was wearing Birkenstock sandals. What? Asked I. It seems that the inspector was worried that I would wear sandals in public as a business traveler. Sandals are for private in home use, not business. The inspector was relieved when I pointed to my hard business shoes in my luggage… So here we have a cultural norm (when to wear sandals) that is widely followed and ‘serious’ enough for the customs inspector to make it a bit of an “issue”. Yet in California you see sandals at work often. Different group, different group think. It is a fundamental part of being human.
Don’t believe me? Shave 1/2 of your head. The right side. See what happens for a week… especially in a business / office setting. Or cut one leg off of your trousers and see what happens. Cultural norms are so extraordinarily important that we often put people in prison for not indulging in the right “group think”. See the history of the inquisition, for example. More recently, the sodomy laws. Still on the books, drug laws and the war on drugs. Or just go to a nice Jewish Kosher deli and order a ham and cheese sandwich… And then ask your girl friend why fashion matters and can she just wear 5 year old designs. Or just dress up in Amish clothes and ask where the nearest bar is located… Just look at top hats and tails. Essential one decade, fading the next, ridiculous now.
We are, at our core, herd animals. It is very hard to go against that.
Instead, there are a small handful of scientists that do not fit any of the above points, rarely, if ever, publish their findings in a respected journal, and are the ones that most here are listening to.
It is not a small handfull of scientists. I have a whole shelf of books by folks with Ph.D after there name on the AGW is bunk side. And the refreshing thing about this site is that many of us here DO our own thinking and our own investigation. It is an active group. We don’t just sit, beaks open, waiting for a worm to be dropped in our gullet. It’s not about our belief system it is all about what the truth is.
The quest for truth is not mediated by a panel of peer reviewers.
Seems very foolish to me.
Only because of the way you choose to color things.
E.M.Smith (06:14:29) : “You can download the data from NOAA (both GHCN and USHCN) and it has monthly data in it. What is done on the way to “anomalies” is anyones guess.”
I guess I missed this one. I’m complaining that GISS has no monthly data for the whole US, so your response is totally useless.
timetochooseagain (07:46:58) :
E.M.Smith (06:14:29) : “GIStemp uses it’s own “UHI correction” and applies it to all the data, US and ROW.”
This is not correct:
OK, I read the link. I see no conflict between my statement and what Steve has posted. Oh, and you are quite wrong about my being ‘not correct’.
At the point were the “UHI Correction” is done, in the program PApars.f, the ROW and US data have already been merged into one single data set. It is run through PApars.f ‘en block’ and is subjected to the exact same lines of code. It does this after a rather ‘hokey’ un-adjusting step (in STEP0, IIRC) that does a somewhat cumbersome compare of the GHCN and USHCN data and uses a calculated “offset” to un-adjust some of the adjustments in some of the records. Details are in the code review on my site.
So you see, the exact same code is applied to both ROW and US stations. That is what I’m pointing out.
That the meta data is screwed up in ROW is quite true, no doubt about it. That much of it is screwed up in the USA is also true. For example, from:
http://chiefio.wordpress.com/2009/08/23/gistemp-fixes-uhi-using-airports-as-rural/
In follow on comments where some of us were inspecting what “pristine rural stations” has shown up in the GIStemp run logs, we have:
Now this is just silly. THE main airport on Kauai… My spouse and I flew into that airport on our honeymoon a couple of decades plus a few years ago. It was not exactly a small rural place.
5 425 91165000 LIHUE, KAUAI, 21.98 -159.35 45 86R -9MVxxCO 1A-9WARM FOR./FIELD C 21
http://hawaii.gov/lih
And in some ways, my favorite:
OOOhhh:
186 425 72405002 QUANTICO/MCAS 38.50 -77.30 4 22R -9FLxxno-9A-9WARM FOR./FIELD B1 10
Quantico! Marine Corps Air Station! Gotta Love It! Semper Fi!
http://www.globalsecurity.org/military/facility/mcb-quantico.htm
Calls it the “Crossroads of the Marine Corp” and says it’s 100 sq. miles on the Potomac.
Now maybe you want to argue that calling those two oceans of tarmac and jet exhaust “rural” and asserting that they have not had a UHI impact during the transition from grass fields to the jet age, but I would prefer to call it “messed up meta data”.
“Outside the US, the GISS meta-data on population and rural-ness is so screwed up and obsolete that their UHI “adjustment” is essentially random and its effectiveness in the ROW is very doubtful.”
And I agree with Steve’s statement completely. I would only add to it that the impact of airports as rural messes up the US record as well, only in a more orderly way, perhaps, due to more consistent airport growth profiles. This one, for example, will be growing nicely for years to come. Has an industrial park underway and the Air National Guard is moving in:
http://chiefio.wordpress.com/2009/09/04/most-used-rural-airport-for-uhi-adj/
Perhaps you would like to explain to Steve how he missed GISS throwing out the nightlight adjustment and now uses the same algorythm in the US and ROW?
Never said he missed anything. Just said that the ROW and US data are merged, and go through the same bit of code, and get the same UHI process applied, which is exactly what happens. The code is posted on my site and you can walk through it line by line if you like, as I have done.
I also said that the UHI is broken for both ROW and US (and in the same way) and it is. And I’d even go further and say that it is metadata related in both cases, with emphasis on “airports as rural” as a major issue.
“Sorry, didn’t know I was obligated to answer all your questions for you.”
Um, that was in response to “Andrew (11:22:26)”, not you, so I still don’t see why you are hot under the collar about it.
“Because they use the same thermometers and suffer the same failings.”
Your rant about satellites deleted. Look, the sats are just too short a time base to be significantly impacted by UHI growth. It takes time for cities to grow and airplanes to change from props to jets. To see UHI change over time, takes, well, time. So the sats look down on a world that has had a 30 year warming as a normal cyclical PDO thing and see normal. I’m fine with that. But to assert that somehow that says something about climate is a bad joke. To say it says anything about the 100 year long growth of urban centers in America around thermometers is even more of a joke. The UHI around, for example, Sacramento Metro Airport was pretty much a done-deal by 1970. New growth is out in Roseville.
“If the GB&A steps cured the thermometer count issues then both hemispheres would be equally weighted and there is no GLOBAL winter.”
This profoundly misunderstands the situation.
You got a problem with reading predicates? See that little word “if” followed by the Grid, Box and Anomaly abbreviation. That is a predicate. What I’m doing here is showing that the global set having a “winter warming” is not compatible with the assertion that GB&A “fixes it” (something that generally gets tossed up ever time this comes around). I’m showing a simple way to demonstrate that GB&A does not “fix it” (and in fact, it does not. I’ve been through that part of the code and due to all the islands, that step ends up warming the ocean grid boxes with airport tarmac. See the “islands in the sun” link).
But to your, orthogonal, point:
If you look at the Northern Hemisphere independently, the NH winter warms more than summer. You are also wrong to assume that a perfect global average would have no seasonal effects
Yup, a problem with predicates. And with logical deduction too.
OK, here we go. I’ll try to avoid reposting here all the stuff I’ve posted on my site (in the hopes of saving the moderators from reading it 100 times…) but will try to just put in enough for you to see what is happening. It would really be better, though, to follow the links.
Yes, the NH warms more in winter too. AND FOR THE SAME REASON. The thermometers migrate south. Not all the way to Brazil, just from Siberia to Italy in latitude. Now the GB&A folks assert this will be fixed by GB&A, but it doesn’t. GIStemp is just unable to correct for an order of magnitude change of thermometer records. The link is:
http://chiefio.wordpress.com/2009/08/17/thermometer-years-by-latitude-warm-globe/
You can see the thermometers migrate south in charts like this sample. This shows the percentage of thermometers in each latitude band by 20 degree bands. South on the left, north on the right:
An amusing sidebar: Notice that all of 1% of the thermometer records are in the southern 40 degrees of globe. It rises all the way to 5.5% at the 60 degree line, and you have to go all the way to “near the equator” to get to 11.2% of the thermometers. The whole Southern Hemisphere is seriously Missing In Action when it comes to thermometers, though it has roughly doubled it’s percentage over this time period as has the equator.
The 40 to 60 N band drops from about 65-69% ish down to 49-57% ish.
Notice we drop from about 20% of the thermometers in the 20-40 degree band to about 10%. Now look at the 6th column. It rises from 4% to 13%. Oh, and half of the 5th column will be “N.H.” too, and it rises from about 2% to 6.8%. Guess what happens as you move from Main to Florida (or Mexico), you get warmer winters. Thermometers notice this too.
And this is why that point about the GB&A code matters. Because the Warmers will want to insist that that code will “fix it”. But I’ve gone through that code, and it it does not. Not for the globe as a whole, and not for the Northern Hemisphere.
We move the thermometers southward, both for the N. Hemisphere and for the globe, and we find that ‘winters get warmer’. Golly, who knew…
And my apologies to the moderators for making you read all this, again; I really do wish folks could click a link and save both of us a lot of time…
E.M.Smith (10:18:42) : “Um, that was in response to “Andrew (11:22:26)”, not you, so I still don’t see why you are hot under the collar about it.”
Wow, you couldn’t even figure out that we are the same person? Really?
You missed the point about the satellites. Whatever.
Your point about migration of stations: can you also show stations move south within grids? Because it is NOT an effect of stations migrating south if it is seen in specific grids. You point seems to be that you think that the lack of data at higher latitudes later in the record is causing a spurious winter warming effect over the hemisphere as a whole. But I’m not talking about the hemisphere as a whole, I can show the same effect in individual bands!!!
Look:
http://data.giss.nasa.gov/cgi-bin/gistemp/do_nmap.py?year_last=2009&month_last=09&sat=4&sst=0&type=anoms&mean_gen=1106&year1=1979&year2=2008&base1=1951&base2=1980&radius=250&pol=reg
http://data.giss.nasa.gov/cgi-bin/gistemp/do_nmap.py?year_last=2009&month_last=09&sat=4&sst=0&type=anoms&mean_gen=0506&year1=1979&year2=2008&base1=1951&base2=1980&radius=250&pol=reg
NOTICE I didn’t use the 1200 km smoothing!!!!!
Andrew (09:46:40) :
E.M.Smith (06:14:29) : “You can download the data from NOAA (both GHCN and USHCN) and it has monthly data in it. What is done on the way to “anomalies” is anyones guess.”
I guess I missed this one. I’m complaining that GISS has no monthly data for the whole US, so your response is totally useless.
What you complain about is totally useless. Your evaluation of what someone says is what is totally useless. Have you any contribution beyond snark? If you would like monthly data, you can get it from GHCN. If you would like to use GIStemp, that’s your problem, not mine. And yes, the way GIStemp hides the truth of cooking the thermometer record by hiding the spike in winter temperatures in their odd “homgenizing” process is worth complaining about. (But not to me, I’m one of the folks tossing rocks at GIStemp.)
Andrew (12:16:58) :
E.M.Smith (10:18:42) : “Um, that was in response to “Andrew (11:22:26)”, not you, so I still don’t see why you are hot under the collar about it.”
Wow, you couldn’t even figure out that we are the same person? Really?
Now you expect me to keep track of all the pseudonyms you troll under? Really? Look, you want to hide under varying names that’s your problem, not mine, and I don’t need to “figure it out”. I have much more interesting things to work on than that.
You missed the point about the satellites. Whatever.
Didn’t miss it at all, was glad to ignore it as irrelevant.
Your point about migration of stations: can you also show stations move south within grids?
Yes. Though it doesn’t really matter. First step is STEP0 where data are fabricated out to 1000km if the USHCN / GHCN merger has an issue it wants to fill in. Pre-grids. Move a reference thermometer and you change the result. Could be 1000km away, might be just 10 km away, but move it to a warmer place, the “Reference Station Method” fill in will create a warmer data point.
Second step is STEP1 that does a homogenizing step with fill in out to 1000 km (that may be looking at a data point that was itself fabricated from 1000 km further away).
Third step is STEP2 that does a ZONE process. This uses 6 latitude bands for the whole globe (way too few) and some more fill and reach. It starts the ‘anomaly’ process and uses 1000 km (again, IIRC, the swapping from 1000 km to 1200 km is an amusing bit of cherry pick in the code but hard to keep straight). Now this may be using a data point that was fabricated based on a data point from 1000 km further away that was based on a data point another 1000 km away; so you could have a “data point” created from up to 3000 km away.
All if this is before the Grid and Box steps.
Now if you moved some thermometers further south, they can be still spreading their warmth up to 3000 km north. In the same box, grid, or whatever, or not. Makes no difference.
Forth step is STEP3. It does the grid, box et. al. step. But an interesting artifact here is that it reaches out to surrounding grid boxes and “fills in empty grids” based on another 1200 km reach. Ok, this is on top of the prior reaching, so a box with a temp from 3000 km away could create a box a further 1200 km away. That’s 4200 km.
No, I don’t think it happens “often” that the reach is that far. But there is no metric for just how much reaching is done. (It is “a lot”). I’m still working out benchmark code for this buggery.
And yes, empty boxes can (and frequently are) made up from nothing. Especially the empty oceans around islands. (See the “islands in the sun” link). Remember that at this point GIStemp is still “all land all the time”. The Hadley SST map gets blended in in STEP4_5 after GIStemp has fabricated temperature grid boxes for the empty seas around it’s island stations (that are nearly universally located at hot airports). So a single island airport patch of tarmac can warm a surface area of ocean about 1/2 the size of the U.S.A. lower 48 states. And yes, that happens. Log files are in the posting from a run of GIStemp. There are a lot of island airports in the worlds oceans…
Because it is NOT an effect of stations migrating south if it is seen in specific grids.
You really have never looked at the code and what it does, have you. You are stating a rampant belief as though it had first principle meaning.
The code has done so much data fabrication and smearing over distances before you ever get to the “box and grid” step that any change of thermometer location is already smeared all over the place. Heck, just the UHI “adjustment” in STEP2 reaches out to any distance up to 1000 km regardless of micro climate and smears the data around. So “Pisa” gets a backward UHI adjustment based on Hohenpeisenberg on the lower Alps in Germany. Put another thermometer in a hot place near or south of Pisa and it will “warm” Pisa in this step. Delete a cold one further north and it will “warm” Pisa. I can even show you what stations are used to “correct” Pisa from the convenient “cherry pick log” so you know exactly what thermometers to delete.
You point seems to be that you think that the lack of data at higher latitudes later in the record is causing a spurious winter warming effect over the hemisphere as a whole.
Well, at least you got that part straight. And It isn’t so much that I “think” it as that I’ve measured and demonstrated it.
But I’m not talking about the hemisphere as a whole, I can show the same effect in individual bands!!!
Great. Good for you. No surprise at all, though. You ought to be able to demonstrate it on a station by station basis from inspection of the STEP2 log files and the STEP3 log files and comparison of stations used over time in the v2.mean file. Haven’t done that bit of work yet, but it is very doable. (Had to save my cat from toxic commercial cat food and that sucked down a couple of weeks finding what was poisoning the cat. Yes, I have postings up on that too.)
It is all just a matter of how much work you want to put into the analysis to show the effect of thermometer change as a function of latitude (and potentially altitude too) on whatever scale you wish to observe. From the single station through boxes, grids, zonal bands, hemispheres, and the globe as a whole. All it takes is programming time.
Basically, we use a “composite thermometer instrument” to measure the globe; except the parts keep changing and moving around and a whole bunch got deleted. At the end of the day there is no way to properly calibrate ‘the instrument” and it has an essential bias based on the migration of thermometers to warmer places over time. A bias that can not be removed by the Anomaly, Zone, Grid, or Box steps.
http://chiefio.wordpress.com/2009/10/18/the-northern-hemisphere-what-warming/
http://chiefio.wordpress.com/2009/10/19/how-to-cook-a-temperature-history/
I’ve often wondered if other weather stations use the same (sloppy) method for calculating the daily average temperature as the one located near me. Several years ago, after becoming suspicious of the accuracy of their temperature reports, I emailed the Ithaca Climate Report folks at Cornell University in Ithaca, NY, and asked them how they calculated their daily average temperature. I was expecting that they sampled the temperature at least once every hour. Much to my surprise, in their reply they said that the daily average is the sum of the daily high plus the daily low divided by two! In addition, all reported temperatures (raw data) are rounded off to the nearest degree F. It is easy to realize that with only 2 daily data points, that on some days their calculated daily average can be in error by several degrees. Garbage in, Garbage Out. B.T.W., Ithaca, NY has many adherents to the church of Al Gore.
http://www.nrcc.cornell.edu/climate/ithaca/