By Joseph D’Aleo, AMS Fellow, CCM
In this recent post, we discussed the problems with recent data that showed the argument presented by the EDF’s millionaire lawyer playing clueless environmentalist on Lou Dobbs Tonight that this will be the warmest decade is nonsense. This claim was well refuted and Al Gore’s credibility disassembled by Phelim McAleer, of the new documentary Not Evil, Just Wrong that challenges the lies and exaggerations (totalling 35) in Al Gore scifi horror comedy film, An Inconvenient Truth. 9 were serious enough for a UK judge to require a disclaimer itemizing them be read whenever, the movie was shown in the schools.
The world’s climate data has become increasingly sparse with a big dropoff around 1990. There was also a tenfold increase in missing months around the same time. Stations (90% in the United States which has the Cadillac data system) are poor to very poorly sited and not properly adjusted for urbanization. Numerous peer review papers suggest an exaggeration of the warming by 30%, 50% or even more. The station dropout can be clearly seen in the two maps below with the number of station going from over 6000 to just 1079 from April 1978 to April 2008.


See the big gaps in the recent data in Canada, Greenland, Africa, South America, parts of western Asia, parts of Australia.
SEE FOR YOURSELF
Take this test yourself to see how bad a shape the global data base is. Look for yourself following these directions using the window into the NOAA GHCN data provided by NASA GISS here.
Point to any location on the world map. You will see a list of stations and approximate populations. Locations with less than 10,000 are assumed to be rural (even though Oke has shown that even a town of 1,000 can have an urban warming of 2.2C).
You will see that the stations have a highly variable range of years with data.
Try and find a few stations with data that extends to 2009. To see how complete the data set is for that station, click in the bottom left of the graph Download monthly data as text.
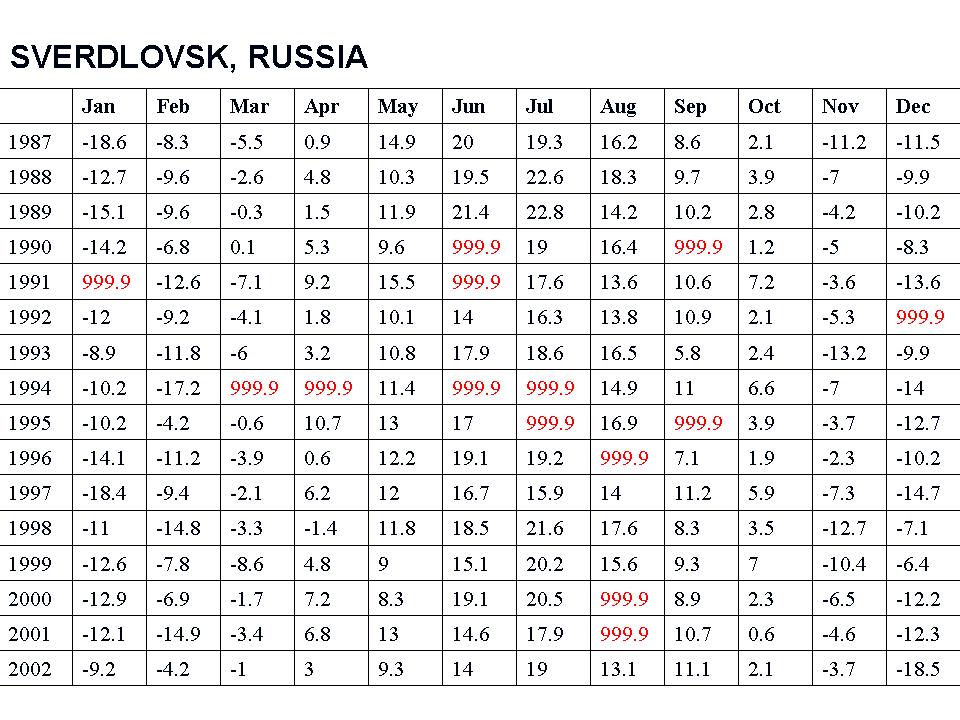
For many, many stations, you will see the data set in a monthly tabular form has many missing data months mostly after 1990 (designated by 999.9).

See larger image here
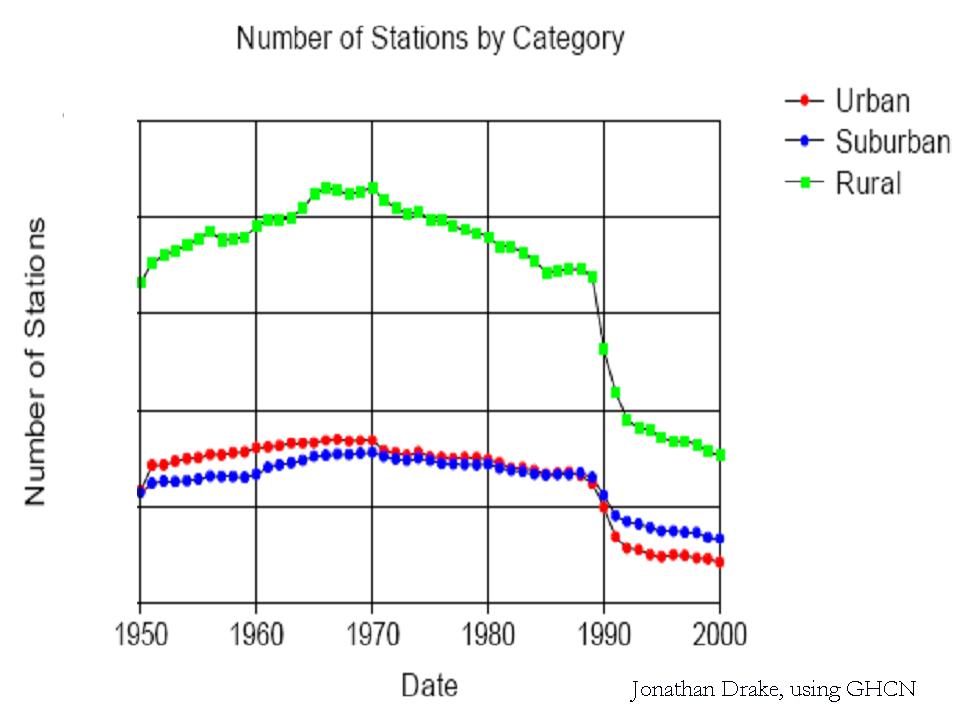
This required the data centers to estimate data for the grid box for that location with other stations nearby (homogenization). In the 2008 plot above only 1079 stations were used. NASA went to locations within 250 km (155 miles) to find data for the grid boxes. For grid boxes without stations within 250 km, they are left blank, thus the large gaps.
Most of the stations that dropped out were rural. More of the missing data points are having their missing months filled in with more urban data in the grid boxes.

See larger image here
WUWT Volunteer John Goetz created this video that shows the worldwide dropout of weather stations:
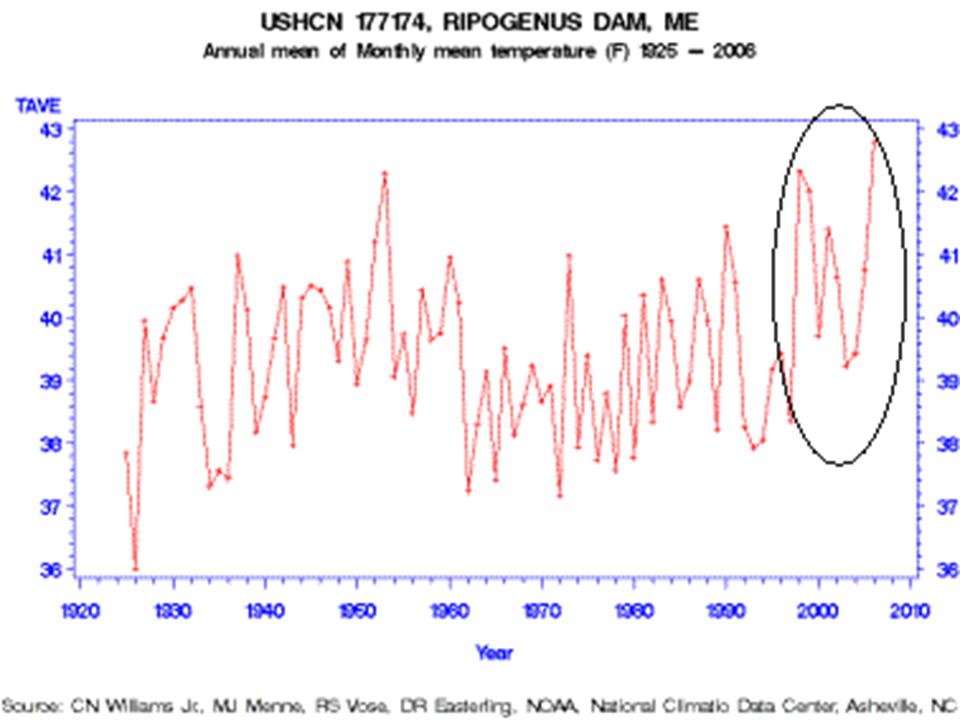
One example of how good or bad this works is from Maine. Volunteers completed surveys of the United States Historic Climate Network (USHCN) temperature stations in Maine for Anthony Watts surface station evaluation project. The survey determined that every one of the stations in Maine was subject to microclimate or urbanization biases. One station especially surprised the surveyors, Ripogenus Dam, a station that was officially closed in 1995.

See larger image here
Despite being closed in 1995, USHCN data for this station is publicly available until 2006! (GISS stopped in 1995)
Part of the USHCN data is created by a computer program called “filnet” which estimates missing values. According to the NOAA, filnet works by using a weighted average of values from neighboring stations. In this example, data was created for a no longer existing station from surrounding stations, which in this case as the same evaluation noted were all subject to microclimate and urban bias, no longer adjusted for. Note the rise in temperatures after this before the best sited truly rural station in Maine was closed. GISS does display this station that did incorporate the “filnet” data input for missing months although as noted they stopped its plot in 1995 which NOAA extended artificially to at least 2006.
How can we trust NOAA/NASA/Hadley assessment of global changes given these and the other data integrity issues? Given that Hadley has destroyed old original data because they were running out of room in their data cabinet, can we ever hope to reconstruct the real truth?
As one of our scientist readers noted: “Well, the 999.9s you showed me today sure opened my eyes…the ramifications are stunning. I knew about the drop-off of stations before but never that existing station reports are so full of gaps or that they’re getting temperature readings from “ghost” stations. This is, as you have said, GARBAGE. See PDF here.
Andrew (12:42:45) :
John Finn (12:22:40) : “There’s nothing misleading about it. I chose 1992 because that’s round about the time of the reduced number of stations.”
Bull. It is absolutely misleading.
The fact that you keep sayiing it’s misleading doesn’t make it so.
There’s no “OF COURSE” about it. I accept the effect of Pinatubo will increase the trend but it’s not obvious that the UAH trend has been more affected than the Hadley trend.”
B.S. again, the response to Pinatubo is much greater in the UAH record:
Ok let’s take it from 1994 …..
http://www.woodfortrees.org/plot/hadcrut3vgl/from:1994/offset:-.2/plot/uah/from:1994/plot/hadcrut3vgl/from:1994/offset:-.2/trend/plot/uah/from:1994/trend
Big difference – instead of the UAH trend being a couple of hundredths of a degree (per decade) warmer Hadley’s now a couple of hundredth’s warmer. Both are well within the stated error bars of each other whichever start point you use.
Scott A. Mandia (13:31:03) :
@ur momisugly Tim Clark (11:10:36) :
One cannot use a present day decadal rate and multiply it by 10 to get a century rate. The feedbacks are coming – you should not assume that the climate reacts to increased GHGs rapidly. The oceans are buffering the effect quite a bit. The models also show that much of the wamring will be in the later parts of this century.
About 1/2 of the CO2 has been added since the 1970s. The warming and feedbacks are coming, unfortunately.
You’re correct, the oceans are a buffer. Unfortunately for your predisposition, the “cool” PDO will not help your cause. Using a present day decadal rate is precisely what is imbedded in the models. Your models hyperventilate about the last 30 years of warming (about 1.5/century) and then extrapolate that into the future. Where’s the thermal energy hidden. Not in a negative PDO. According to predictions, we’re ~.5 degrees behind the eight ball right now. To catchup requires immense positive feedback. We shall see this winter.
Scott Mandia, you post here so much in disagreement with the blog in general without bad-mouthing, which is good. But I think you need to go a lot further back to basics, further than I’ve seen you go so far, and you need to check yourself more carefully lest you merely support strawman arguments.
Re your 5 points (@ur momisugly 13:31:03):
I don’t think anyone is disputing or ignoring the general agreement of the 4 temperature records that show recent rises in temperature, at least up to 2000. Concern about inadequate allowance for UHI, or about other problems with surface data, is not “ignoring surface data”. Now this “plethora of actual observed effects of rapid climate change” that you mention – I have not come across a single such harmful effect that is both relevant to today and true. May be true but irrelevant, or relevant but untrue, or relevant but harmless or beneficial, or relevant but misleading, or would be relevant only if at least one part of the basic AGW thesis of (a) unparalleled warming (b) CO2 as cause were substantially, transparently proven true. But perhaps you can enlighten me. Perhaps I’ve missed those plethora somehow. I would not like to be accused of ignoring important data.
The PDO cannot explain the long term trend. Just like the shorter-term El Ninos and La Ninas, PDOs effectively cancel out in the long run and the underlying AGW trend sticks out like a sore thumb.
Here are some good links for those of you who are unfamiliar with PDO:
http://www.skepticalscience.com/Pacific-Decadal-Oscillation.htm
http://www.jisao.washington.edu/pdo/
I could not believe how awful the GISS records might be until I started working with them, doing UK blink comparators for Ellie. I think my response reactions are still too much in the expletives stage, but that will pass… I shall channel it into better science…
Scott Mandia (08:33:57) : Joe… is strongly implying that [UHI] is significant. The problem with his arguments is that UHI is, for the most part, insignificant.
It would be great to have a post on UHI. I am certain Scott Mandia is wrong but it would be good to have the evidence of this spread out again. And I think we are going to need calibrators for UHI that we can trust, to try to reassemble a trustworthy global surface temperature record, though I understand Chiefio’s reasoning that we should only use rural sites. Personally I want to see the really long old records reinstated but with decent UHI corrections. The original keepers took a lot of care with them and I would rather have a few good records than a thousand botched ones. My guess is that many of the old records are still somewhere, in somebody’s archives, and may still exist, even if GISS or CRU have ignored or deleted them.
Scott A. Mandia (13:31:03) :
“1) All 4 data sets show a warming climate in the past three decades.”
Yes, although this really doesn’t say much, sense the 2 non satellite products are essentially analyses of the same data.
“2) They are fairly close in agreement with warming rates”
Not when one takes into account expected-and empirical-amplification
“(one cannot just throw out RSS because they do not like the results).”
No, one can however cite serious arguments that RSS is not a good data set. which I would indeed:
Christy, J.R. and W.B. Norris, 2006: Satellite and VIZ-Radiosonde intercomparisons for
diagnosis on non-climatic influences. J. Atmos. Oc. Tech., 23, 1181 – 1194.
Christy, J. R., W. B. Norris, R. W. Spencer, and J. J. Hnilo, 2007: Tropospheric
temperature change since 1979 from tropical radiosonde and satellite measurements,
J. Geophys. Res., 112, D06102, doi:10.1029/2005JD006881.
Christy, J.R. and W.B. Norris, 2009: Discontinuity issues with radiosondes and satellite
temperatures in the Australian region 1979-2006. J. Atmos. Oc. Tech., 26, 508-522,
DOI: 10.1175/2008JTECHA1126.1
Sakamoto, M. and J.R. Christy, 2009: The influences of TOVS radiance assimilation on
temperature and moisture tendencies in JRA-25 and ERA-40. J. Atmos. Oc. Tech.,
doi:10.1175/2009JTECHA1193.1.
Randall, R. M., and B. M. Herman (2007), Using Limited Time Period Trends as a Means to Determine Attribution of Discrepancies in Microwave Sounding Unit Derived Tropospheric Temperature Time Series, J. Geophys. Res., doi:10.1029/2007JD008864, in press
All of which find specific issues with RSS and similar data, and find UAH to be the more consistent data set, both internally, and with the best radiosonde data sets.
“3) Joe suggests that there is a serious enough UHI bias that we cannot use this data for policy decisions.”
It’s more than UHI but “use for policy decisions” does not have a clear meaning and I don’t find it particularly relevant. What is clear is that the surface data exaggerates the warming and therefore exaggerates the “problem” motivating policy makers.
“4) There is literature that shows UHI and no UHI but the data from point #1 doesn’t show UHI.”
See my response to point one. And again, it’s more than just UHI
“5) There is a plethora of actual observed effects of rapid climate change if we choose to ignore surface data. Shall we ignore those also?”
You miss the point. Again. Yes, there’s warming. I don’t know what the qualifier “rapid” is there for, but magnitude of the “problem” matters.
“He who refuses to do arithmetic is doomed to talk nonsense” and I tire of the qualitative defense of warming. Yawn.
John Finn (15:23:03) : You really deserve to be ignored for being incredibly thick. Look at the fluctuations. It’s clear that UAH goes up and down more. So why is the trend even slightly less?
If you misdirect with nonsense about “separate issues” you have lost and I will ignore you.
“The fact that you keep sayiing it’s misleading doesn’t make it so.”
Except that I give specific reasons. [snip ~ E].
@ur momisugly Lucy Skywalker (16:13:00) :
I have not come across a single such harmful effect that is both relevant to today and true
I suggest you read IPCC 2007 WGII: Impacts, Adaptation and Vulnerability
http://www.ipcc.ch/publications_and_data/publications_ipcc_fourth_assessment_report_wg2_report_impacts_adaptation_and_vulnerability.htm
@ur momisugly timetochooseagain (16:56:46) :
1) Yes, although this really doesn’t say much, sense (sic) the 2 non satellite products are essentially analyses of the same data.
2) No, one can however cite serious arguments that RSS is not a good data set….All of which find specific issues with RSS and similar data, and find UAH to be the more consistent data set, both internally, and with the best radiosonde data sets.
How can you make these two statements back to back? FYI: 4 of the 5 references that you claim show RSS is not a good data source are from the folks who run UAH. Conflict of interest?
3) What is clear is that the surface data exaggerates the warming and therefore exaggerates the “problem” motivating policy makers.
Actually, the surface data does not even begin to show the warming that is here and will be coming. The oceans have taken in almost half the CO2 and about 95% of the excess heat.
4) “He who refuses to do arithmetic is doomed to talk nonsense” and I tire of the qualitative defense of warming. Yawn.
If you took the time to review my Website, which is filled with data from peer-reviewed experts, you could not accuse me of a qualititative defense. I am sorry if I am boring you with my simple language here but I am not here to try to change your mind. I post here because I hope that the lurkers out there compare my comments to the regulars here so that they can hear the other side of the AGW debate – the side that has overwhelming support by the majority of experts in the field.
[REPLY – Do bear in mind that you get this opportunity because we moderators encourage that both sides be heard. And that is not the case on most prominent pro-AGW blogs. ~ Evan]
Scott Mandia
I enjoy your comments, you are a thoughtful and courteous debater and yes I have visited your site.
Several times I have pointed out here about historic precedents and you have said that was something you didn’t know about it and would go away and have a think about that aspect. (arctic ice variations, glaciers being higher in MWP and Roman times etc) it. I never get any feedback on that and the belief that all this is happening for the first time remains unchallenged on sites such as yours.
Do any of these well documented cases of cyclic variations in our climate that predate satellite data ever give you pause for thought?
best regards
Tonyb
Scott Mandia (20:34:34) :
I suggest you read IPCC 2007 WGII: Impacts, Adaptation and Vulnerability
I suggest that many have. The problem with the IA&V is that none of it matters if “The Physical Science Basis” is faulty or even slightly so. If I hand an agricultural specialist a “scenario” in which the US warms by 3°C and ask for a probable outcome, I get a chapter of doom and gloom but I would get just the same result back if I gave a -1°C change scenario.
Actually, the surface data does not even begin to show the warming that is here and will be coming. The oceans have taken in almost half the CO2 and about 95% of the excess heat.
Your suggestion seems to be that SAT is showing just some tiny fraction of the “real” warming? And don’t warming Oceans hold less CO2 not more? Hmmm…. colour me confused.
Scott Mandia: “Actually, the surface data does not even begin to show the warming that is here and will be coming. The oceans have taken in almost half the CO2 and about 95% of the excess heat.”
yes, and the ocean heat content has been sinking for a while now. Now SST is also going down. I wouldn’t be surprised if we’ll see a drop in land temperatures over the next few months. OHC seems to be the only reasonable measure of a warming earth. Unfortunately, records go no longer back than 1955, which means that they start at a local temperature minimum. We know that at least the Barents sea was just as warm around 1940 as it is now, so what if the global OHC was comparable to today’s values around that time? Even if it was lower: by how much? And would it mean that the difference between 1940 and today is due to AGW, or is it just a natural recovery from the LIA?
John Finn (15:23:03) : You really deserve to be ignored for being incredibly thick. Look at the fluctuations. It’s clear that UAH goes up and down more. So why is the trend even slightly less?
The largest relative difference is in 1998 which is near the start of the record is likely to dampen the UAH trend. Let’s take it from 2000
http://www.woodfortrees.org/plot/hadcrut3vgl/from:2000/offset:-.2/plot/uah/from:2000/plot/hadcrut3vgl/from:2000/offset:-.2/trend/plot/uah/from:2000/trend
Ooops. UAH now warming more than Hadley.
If you misdirect with nonsense about “separate issues” you have lost and I will ignore you.
Ok – can I assume from this you believe that the models are correct, i.e. the troposphere really is warming at ~1.2 times the rate of the surface. Also you seem to believe that non-climatic land-based factors just happen to have offset the surface/troposphere warming difference.
timetochooseagain (16:56:46) :
Take a look at this Lucia link and scroll down to the first graph.
http://rankexploits.com/musings/2009/adding-apples-and-oranges-to-cherry-picking/
It shows the trends from Sept of each year (1989-2004) until August 2009. Note all 5 records are pretty close over the longer term (i.e. 14+ years). Hadley and the satellites (UAH/RSS) remain in lock step right up until ~2000. There is divergence after that. This is where the magnitude of the fluctuations becomes more influential, i.e. over the very short term. Since 2004 we’ve moved from predominantly El Nino-type conditions to the La Nina cooling of 2008. If UAH and RSS measure a greater response than Hadley, the trends will differ over this period. As the period lengthens the difference will reduce.
Also I reckon there’s reasonable evidence that the earlier GISS divergence is related to the GISS arctic extrapolation.
@ur momisugly Scott Mandia (20:34:34) :
In response to Evans comments:
Do bear in mind that you get this opportunity because we moderators encourage that both sides be heard. And that is not the case on most prominent pro-AGW blogs. ~ Evan
Yes, this site is to be commended for that policy. I have thanked AW more than once for allowing me to post here. And I have learned from researching that I must do in order to provide an effective reply to some comnents here. 🙂
@ur momisugly TonyB (23:51:39) :
I guess what it comes down to is that I keep seeing various proxy data by various scientists yielding the same temperature reconstruction which shows that the climate now is warmer than in the past 2000 years and has done so at a relatively fast rate. In my eyes, there is a prepondernace of evidence for this position.
@ur momisugly 3×2 (00:42:23) :
Your suggestion seems to be that SAT is showing just some tiny fraction of the “real” warming? And don’t warming Oceans hold less CO2 not more? Hmmm…. colour me confused.
Yes they do. That is why CO2 will increase into the future even with drastic emission controls.
@ur momisugly Espen (01:31:58) :
yes, and the ocean heat content has been sinking for a while now
A few studies show that there may have been cooling or a flat trend since 2003 but more studies show that the oceans are gaining more heat. See the following site for a nice rundown on this topic:
http://www.skepticalscience.com/How-do-we-know-global-warming-is-still-happening.html
or is it just a natural recovery from the LIA?
Recovery from the LIA is not a forcing mechanism. Something has to warm up the planet just like a weak sun and volcanic eruptions likely cooled the planet during the LIA. What warmed up the climate since the LIA and did so at a rapid pace? It was not the sun, BTW.
Lucy,
Don’t you ever wonder why there are no peer-reviewed journals articles that can explain the warming of the modern climate while also showing why rapidly increasing GHGs have had little influence on recent climate change?
There are certainly plenty that show how CO2 is responsible.
What saddens me the most about posts here at WUWT is that folks here seem to believe one or more of the following so they choose to ignore the current state of climate science:
1) The majority of scientists around the world are incompetent (they do not interpret data correctly, for example), but folks here at WUWT can intepret the data better than these experts.
2) The majority of scientists around the world are afraid to publish alternate viewpoints to an AGW-forced climate despite the fact that they would become famous if they could refute AGW.
3) The majority of scientists around the world are conspiring in order to secure funding.
4) The majority of scientists around the world are just using group speak which implies that they do not think for themselves.
Instead, there are a small handful of scientists that do not fit any of the above points, rarely, if ever, publish their findings in a respected journal, and are the ones that most here are listening to.
Seems very foolish to me.
Scott Mandia,
The newest toy for the alarmist crowd is an alarmist blog that calls itself ‘skeptical’ science. There is nothing skeptical about it.
I’ve looked at it a couple of times. It’s simply a another alarmist blog with a mendacious name. It’s clear that the term “skeptic” tortures the scaremongers. They crave to be called scientific skeptics. But they fail to understand what a skeptical mind-set entails.
So they use the term dishonestly. They can not be skeptics, because they have bought into the whole bogus AGW scare hook, line and sinker. They don’t understand what scientific skepticism is. It is a questioning of any hypothesis until the hypothesis fails, or remains able to withstand all questioning. Alarmists can not prove their conjecture, and it certainly has not been able to withstand scrutiny.
Every good scientist is a skeptic. And skeptics are on the ascendant because the CO2=AGW conjecture not only fails to pass the scientific method, but the planet itself is falsifying the conjecture. If CO2 caused measurable global warming then where are the measurements? You can buy a pig in a poke, but the rest of us want to check out the pig before wasting our money.
The alarmists’ claim, which attempts to contradict the fact that the planet has not warmed despite steadily increasing CO2, doesn’t pass the skeptics’ requirement of testability. ARGO shows deep ocean cooling, so the alarmist crowd is naturally desperate to claim that 3,000 separate buoys are wrong, just like they claim that satellite data is inaccurate, but the surface station record is not. It is the alarmists who are wrong.
And it has been explained here that there is no clear division between feedbacks and forcings; they are only general definitions which overlap. You say that the planet’s natural recovery from the LIA is not a forcing. You think it is a feedback, which is ridiculous.
The entire alarmist belief in CO2=AGW comes down to the false assumption that a *very* minor trace gas, which is as harmless and beneficial as H2O, will cause runaway global warming if it increases from 4 parts in ten thousand to 5 parts in ten thousand. That is rubbish. There is no empirical evidence for that claim.
All the so-called ‘evidence’ for the CO2 conjecture comes from GCMs, which are notoriously inaccurate. Climate models are not evidence. They are simply a tool. Evidence is data. And the data shows that the alarmist crowd is wrong. At current low levels CO2 has no measurable effect on the climate. None. But I invite you to prove that wrong. Base your argument, if you even have one, on data, not on computer models or on the circular arguments of rent-seeking peer reviewed papers.
You can keep referring to a blog that wishes it were really skeptical. Alarmists are desperate enough to play word games like that, which tells us all we need to know about their lack of substance; the planet is falsifying the CO2 conjecture. Skeptics prefer to listen to what the Earth is saying, not to what alarmist propagandists want people to believe.
Finally, your claim in point #2 above shows how misunderstanding the scientific method leads you to false conclusions. Skeptics need refute nothing about AGW. Nor do they have to refute a conjecture that there is a methane monster living under my bed. As usual the scientific method is being turned around backward. What the alarmist contingent must show is that their AGW conjecture explains reality better than the long accepted theory of natural climate variability. Since it can not, alarmists demand that skeptics must disprove AGW.
Until climate alarmists understand how the scientific method works, they will continue to make the same error in believing that skeptics have any duty to prove or disprove AGW. Skeptics need prove nothing. It is the alarmists who must convincingly show that AGW has any validity. So far, they have failed to do so.
Scott Mandia: “Recovery from the LIA is not a forcing mechanism. Something has to warm up the planet just like a weak sun and volcanic eruptions likely cooled the planet during the LIA. What warmed up the climate since the LIA and did so at a rapid pace? It was not the sun, BTW.”
Well, except for the probably minuscule contribution from geothermal energy, and the actual heat release from human activity, nothing else than the sun can warm up the planet! The system of ocean currents, cloud cover and precipitation is vastly more complex than what it might seem that you suggest here. And in any case, given your simple observation of warming since LIA and “rapid pace”, how do you explain (I’m looking at the HADCRUT temperature graph now):
1) that the 1910-1940 warming was very similar in its rapid pace to the 1975-2005 warming?
2) the cooling from 1940 to 1975?
…and also:
3) the first part of the LIA recovery?
4) the onset of the medieval warm period?
@ur momisugly Espen (06:40:44) :
1) Perhaps similar but 1975-2005 was a steeper slope and the past three decades have been warmer than almost all of the decades since 1850. The rate of warming is increasing each decade.
2) Global dimming due to pollution offset much of the global warming.
3) Not true, but I would refer you to hockey sticks and I do not think that works for you.
4) See #4 above.
I think I am done with this thread now because I just keep repeating myself so I am not really adding anything new.
Scott Mandia:
“The rate of warming is increasing each decade.”
Here, let me help:
‘The rate of warming
iswas increasing each decade.’Fixed.
I’m not going to dignify Finn with a response.
Scott Mandia (03:20:28) :
“I guess what it comes down to is that I keep seeing various proxy data by various scientists yielding the same temperature reconstruction which shows that the climate now is warmer than in the past 2000 years and has done so at a relatively fast rate. In my eyes, there is a prepondernace of evidence for this position.”
See the Wegman Report figure 5.8:
http://www.climateaudit.org/pdf/others/07142006_Wegman_Report.pdf
“A few studies show that there may have been cooling or a flat trend since 2003 but more studies show that the oceans are gaining more heat. See the following site for a nice rundown on this topic:
http://www.skepticalscience.com/How-do-we-know-global-warming-is-still-happening.html”
Huh? NODC data doesn’t show what you are talking about:
http://bobtisdale.blogspot.com/2009/10/update-of-nodc-levitus-et-al-2009-ohc.html
(Note how Bob tried to post this as a comment on Romm’s flag waving, bible thumping SS triumphalism-and the juvenile response)
So I guess your point is…that Ocean Heat Content data is crap, and therefore, what’s the point?
“Recovery from the LIA is not a forcing mechanism. Something has to warm up the planet just like a weak sun and volcanic eruptions likely cooled the planet during the LIA. What warmed up the climate since the LIA and did so at a rapid pace? It was not the sun, BTW.”
And you know it wasn’t the sun because….? And what does “rapid pace” mean anyway? And incidentally, this idea that the only factors in nature are the Sun and Volcanoes is rather tiresome. One has to be rather feeble minded to not understand that the climate can fluctuate all on it’s own. The MWP and LIA are likely examples of this (not “likely solar and volcano”). But if, as you say, they didn’t exist…
Scott A. Mandia (07:13:47) :
“Perhaps similar but 1975-2005 was a steeper slope and the past three decades have been warmer than almost all of the decades since 1850. The rate of warming is increasing each decade.”
This is really stupid and I would have hope you would not be so daft, Scott.
Using the HadCrut annual data:
http://i23.photobucket.com/albums/b370/gatemaster99/warmtwice.png
that 1911-1941 and 1978-2008, thirty one year periods with essentially identical rates of change. There is no basis what so ever for you claim of either “acceleration” or the claim that the first warming of the twentieth century occurred slower than the recent warming.
Add to that the lack of warming for twelve years now, and the claim of ever faster warming is really outrageous.
Andrew,
Let me start off by saying, YES, I WAS DUMB when I fell into the trap of arguing about trends and using single decade comparisons. You are correct and I am wrong when considering just pieces of the plot.
Of course, your plot shows an increasing trend since 1850 even with the cooling decades so there is an underlying trend upward that I do not believe natural causes can explain. I also think that global dimming caused the cooling before the 1980s or at least offset much of the warming.
You also mention the Wegman Report. That report addresses the 1998 temperature reconstruction. So? The 2008 Mann et al. and newer reconstructions show the same hockey stick even without using tree data. Also, the NAS report vindicated Mann 1998. I give more weight to NAS than Wegman but it is still a moot point with the newer data sets.
The NODC data is indeed interesting and I will need to look into this when considering the Schukmann et al. 2008 paper. However, a few years does not a climate make and the trends in those graphs are still upward over the entire period. Also, it appears that the past 6 months of data are skewing the “trend since 2003”. I guess we will need to see how the next year or so goes to see if this is a real downswing or temporary.
Also an interesting read from a comment on Tisdale’s blog:
Ocean Heat content:
Sea Level Budget over 2003–2008: A Reevaluation from GRACE Space Gravimetry, Satellite Altimetry and Argo by Cazenave et al. 2008
http://sciences.blogs.liberation.fr/home/files/Cazenave_et_al_GPC_2008.pdf
Summary: You are correct and I am wrong regarding my comments about rates of warming in selected 10 year and 30 year periods. I was daft as you say! 🙂
However, I do not see how you can claim: “Add to that the lack of warming for twelve years now…” How do you figure there has been a lack of warming in the past 12 years, and, does 12 years change the past 160 regarding trend?
Scott Mandia in reply to Andrew: “…does 12 years change the past 160 regarding trend?”
Scott, I think that after all it all boils down to whether one thinks the hockey stick is broken or not. Even if it should eventually turn out that global temperature data actually isn’t as bad as the article we’re commenting on will have it, and that Hadcrut data really tell a pretty good story, it still remains to be decided if the last 160 years represent something unusual or not. My take on this is that ice cores show that warming usually happens fast, while cooling takes a long time.
So, suppose that the hockey stick is broken and that those who claim that the MWP was at least as warm as the current warm period are right. Further, suppose that the LIA was a pretty unique event for the last couple of thousand years. Then maybe the current warming isn’t unusual at all – it’s just the sign of the planet’s oceans returning to their normal heat content after an unusually long cold spell. It’s the return to normal, to equilibrium. And it happens fast because warming does happen fast, while cooling takes a long time.
Andrew (07:38:18) :
I’m not going to dignify Finn with a response.
Why – have you checked the Lucia link and found out I’m right.
D’Aleo writes “Numerous peer review papers suggest an exaggeration of the warming by 30%, 50% or even more.” Those papers to back up my estimate that 30% of the apparent 0.8C global temperature increase over the past 150 years is due to Data Bias.
It appears the actual increase is between 0.5C and 0.6C, or perhaps even less.
Other estimates are that around 40% is due to Natural Cycles (of the Sun and ocean oscillations), 20% to Ocean Carbon (due to more carbon gas emissions and less absorbtion by the slightly warmer ocean surface) and only about 10% due to Human Carbon (burning of formerly sequested carbon).