By Joseph D’Aleo, AMS Fellow, CCM
In this recent post, we discussed the problems with recent data that showed the argument presented by the EDF’s millionaire lawyer playing clueless environmentalist on Lou Dobbs Tonight that this will be the warmest decade is nonsense. This claim was well refuted and Al Gore’s credibility disassembled by Phelim McAleer, of the new documentary Not Evil, Just Wrong that challenges the lies and exaggerations (totalling 35) in Al Gore scifi horror comedy film, An Inconvenient Truth. 9 were serious enough for a UK judge to require a disclaimer itemizing them be read whenever, the movie was shown in the schools.
The world’s climate data has become increasingly sparse with a big dropoff around 1990. There was also a tenfold increase in missing months around the same time. Stations (90% in the United States which has the Cadillac data system) are poor to very poorly sited and not properly adjusted for urbanization. Numerous peer review papers suggest an exaggeration of the warming by 30%, 50% or even more. The station dropout can be clearly seen in the two maps below with the number of station going from over 6000 to just 1079 from April 1978 to April 2008.


See the big gaps in the recent data in Canada, Greenland, Africa, South America, parts of western Asia, parts of Australia.
SEE FOR YOURSELF
Take this test yourself to see how bad a shape the global data base is. Look for yourself following these directions using the window into the NOAA GHCN data provided by NASA GISS here.
Point to any location on the world map. You will see a list of stations and approximate populations. Locations with less than 10,000 are assumed to be rural (even though Oke has shown that even a town of 1,000 can have an urban warming of 2.2C).
You will see that the stations have a highly variable range of years with data.
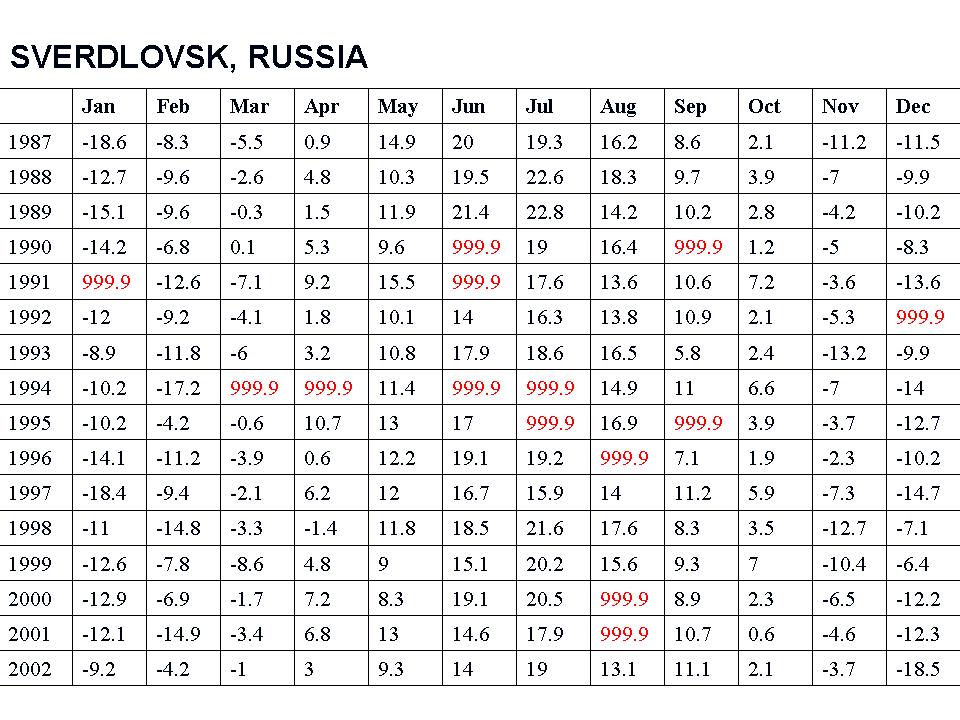
Try and find a few stations with data that extends to 2009. To see how complete the data set is for that station, click in the bottom left of the graph Download monthly data as text.
For many, many stations, you will see the data set in a monthly tabular form has many missing data months mostly after 1990 (designated by 999.9).

See larger image here
This required the data centers to estimate data for the grid box for that location with other stations nearby (homogenization). In the 2008 plot above only 1079 stations were used. NASA went to locations within 250 km (155 miles) to find data for the grid boxes. For grid boxes without stations within 250 km, they are left blank, thus the large gaps.
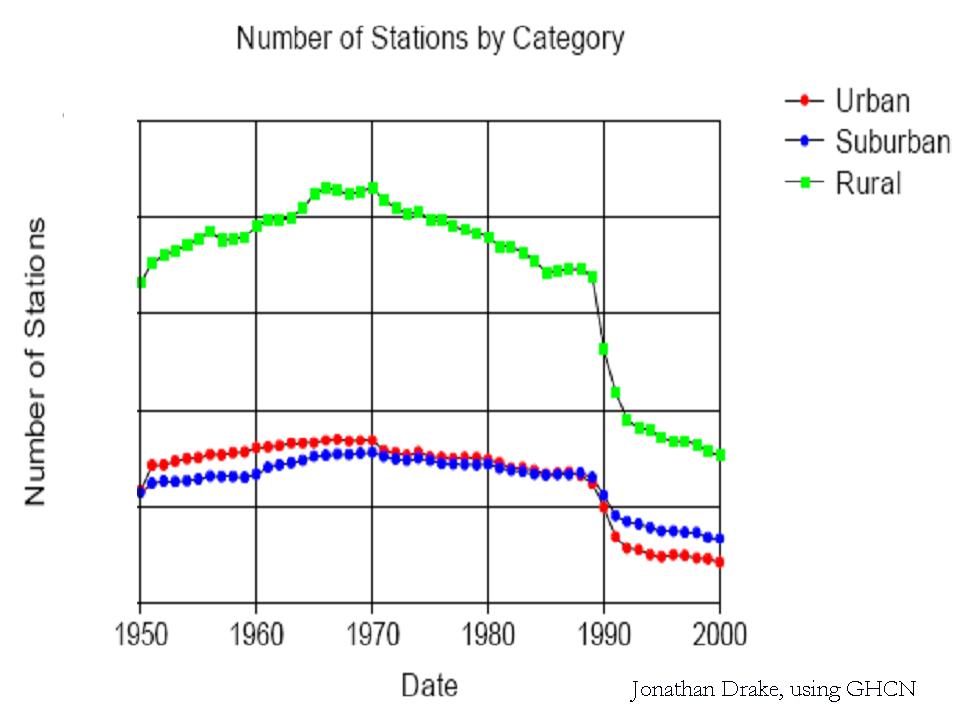
Most of the stations that dropped out were rural. More of the missing data points are having their missing months filled in with more urban data in the grid boxes.

See larger image here
WUWT Volunteer John Goetz created this video that shows the worldwide dropout of weather stations:
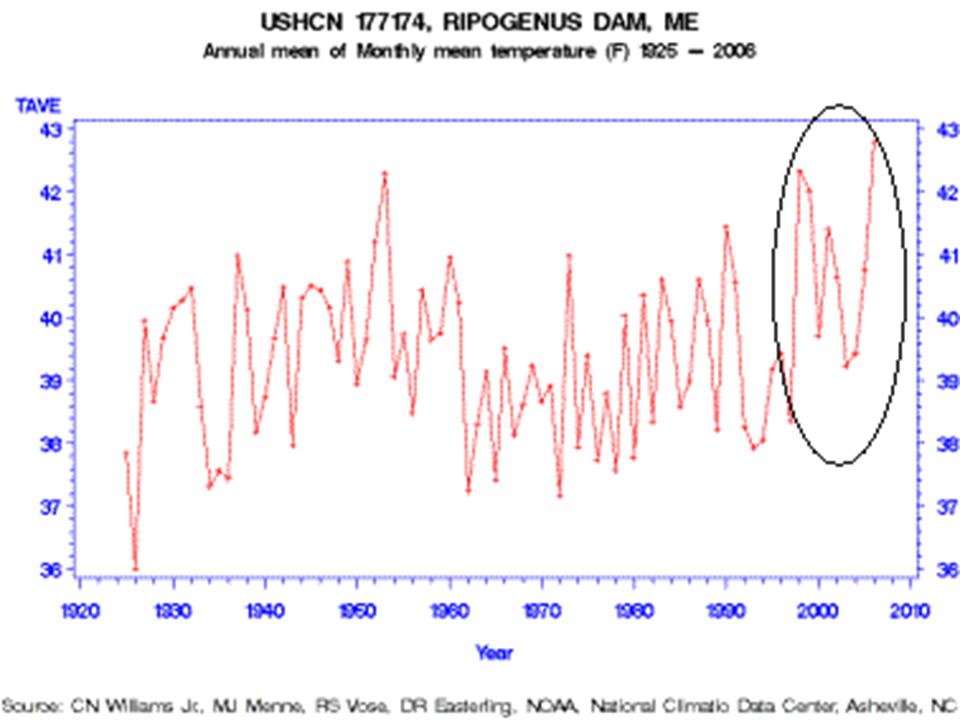
One example of how good or bad this works is from Maine. Volunteers completed surveys of the United States Historic Climate Network (USHCN) temperature stations in Maine for Anthony Watts surface station evaluation project. The survey determined that every one of the stations in Maine was subject to microclimate or urbanization biases. One station especially surprised the surveyors, Ripogenus Dam, a station that was officially closed in 1995.

See larger image here
Despite being closed in 1995, USHCN data for this station is publicly available until 2006! (GISS stopped in 1995)
Part of the USHCN data is created by a computer program called “filnet” which estimates missing values. According to the NOAA, filnet works by using a weighted average of values from neighboring stations. In this example, data was created for a no longer existing station from surrounding stations, which in this case as the same evaluation noted were all subject to microclimate and urban bias, no longer adjusted for. Note the rise in temperatures after this before the best sited truly rural station in Maine was closed. GISS does display this station that did incorporate the “filnet” data input for missing months although as noted they stopped its plot in 1995 which NOAA extended artificially to at least 2006.
How can we trust NOAA/NASA/Hadley assessment of global changes given these and the other data integrity issues? Given that Hadley has destroyed old original data because they were running out of room in their data cabinet, can we ever hope to reconstruct the real truth?
As one of our scientist readers noted: “Well, the 999.9s you showed me today sure opened my eyes…the ramifications are stunning. I knew about the drop-off of stations before but never that existing station reports are so full of gaps or that they’re getting temperature readings from “ghost” stations. This is, as you have said, GARBAGE. See PDF here.
We no longer need an Olympics. we can take statistical data. Too bad my daughter is trying out for the olympics and the heptathlon. On one event last year, she had personal bests every week for a couple of months.
We can “smooth” readings. How about changing weights of sources?
There is so much subjective influence, that it seems some of these studies must be declared invalid and inconclusive.
on the “number of stations” over time and by category graph – what is the y axis? just curious on the actual numbers.
Lots of questions running through my mind, but I will not ask, I am sure you guys have the answers and I will keep an eye on the thread.
But:
Did the IPCC use this in any of their reports? Was it used in isolation of other data or was it bundled with some other source?
And if this was used is the data they (actually) used, available for scrutiny?
Thanks for your patience.
Is there a detectable drop in variance caused by the averaging process?
Nick
They took 18 years off the back end of the record for my rural station. Many of the -999’s are to be found in the newspapers. The data is missing from GISS, not that it was not taken.
This record cannot be trusted, and is essentially worthless.
I suspect that many rural stations that are currently still in use have had the many years of record trimmed off the back end. An entire US reporting system was set in place in 1894 to provide a consistent data set. Many of the Western stations had records going back 10-50 years earlier than that, but have been ‘sanitized’ and the data lost or destroyed.
Sick puppies.
First time I’ve done this so if I get something wrong/miss something obvious feel free to flame.
Right, had a look at my patch, the south of England. As far as I can see, there is just ONE station still operating in the southern half of the country (south of Lincoln.)
Now this station is named ‘Bournemouth A’ and looking at the co-ordinates given on the map, it looks like it is in Bournemouth Airport. So the only data station still in the set (that I can see), in the entire southern half of England (on the edge of the Gulfstream) is in an airport (possibly).
Despite this, the last full temp reading (2008), was just 0.01 degree C above the first reading at this station (1961).
Now I know you’re doing an audit of these stations, so a couple of questions:
1) How do I find out *exactly* where it is to do an audit (unless it has already been done).
2) If I do go and have a look, what exactly am I looking for.
Apols for the rambling post.
“To measure is to know.”
Lord Kelvin
Well why do we need so many stations anyway. We can tell the climate for 800,000 years just from one ice core drilled at Vostok Station (maybe with extrapolations), so who need all those other readings anyway.
Why not make just one more good climate station, and put it on The White House lawn; and have the President decide what the climate is; after all he’s a nobel prize winner. That would save a lot of money taking care of all those other stations.
Well they don’t hang on to the data anyway; they just annualize it, and then five year running average it, and then just average it in with all those other annualized five yearized numbers toi get the world climate anyway. Let Obama decide.
Do any of these “Climatology or Climate Science” courses at any of the Major Universities ever mention the Nyquist Sampling Theorem; or teach a class in basic sampled data sytem theory?
Would that be an idea insteaqd of just teaching Stat maths.
You can’t generate meaningful statistics if you have data containing no information.
Excellent synopsis. Kudos to Joe D’Aleo.
The emperor has no clothes. Despite tens of $billions spent on global warming “science,” the data on which the “crisis” is based are sparse and tainted. AGW alarmists cannot even establish that global temperatures are rising, in large part because temp change has been flat or negative for 10 years (or more — the data have been systematically biased and rebiased upwards for 20 years).
AGW alarmists are crying wolf. Their “crisis” is manufactured and illusory.
Based on UAH data I calculate that the Hadcrut data has a warming bias of about .07 degrees per decade over the period that the two records overlap. I suspect that this grows smaller as you go further back but it is quite large. The main cause, I think, is the lack of data in Africa, where there has been little warming. I note that Christy et al., studying East Africa, found that the data from Hadley in the study area greatly exaggerates the trend- and that there is evidence for landuse effects there.
Within the US, GISS’s Al-Gore-Rhythm seems to work OK, but in the ROW it’s not clear anyone has a method that doesn’t suck.
Which reminds me. Joe, do you know what kind of seasonality UHI etc. would have? I’m trying to figure out why there seems to be so much winter warming in many data sets and very little summer warming.
I was shocked at the number of stations that have been dropped. It seems that the goal is not to measure temperature but to stop measuring temperature.
I believe Steve McItyre has posted about this problem several times even pointing out that in many cases the “missing” data are available for download on the public Internet. For example, a site might not for some reason report a value for a month to NOAA but a quick search shows the value for that station from another source. The bottom line is that the amount of QA that goes into this data set is something close to zero.
This article highlights the very reason that data such as GISS simply isn’t believed by many people. Many of the numbers are little more than rectal extractions.
Hi all, what’s happening with the gulf stream? Is it slowing down? Look at the map in this site!
http://polar.ncep.noaa.gov/ofs/viewer.shtml?-natl-cur-0-small-rundate=latest
Is NOAA having issues with the model or has the gulf stream really stopped?
“For many, many stations, you will see the data set in a monthly tabular form has many missing data months mostly after 1990”
The post cold war peace dividend
I agree with George Smith .Let Obama decide.Obama said we must stop climate change .Now some people think Obama is god but I know there is only one GOD ,Jesus Chrsist,and that ain’t Obama.One last thought is Obama talkes about reversing climate change so how does he plan on doing that ??We can’t control the weather and I know weather isn’t climate change , or so we are told ,but if thats the case then when we have heat waves in California the first thing we here is global warming oops i’m sorry climate change??????
The “missing” temperatures are, in many cases, due to a single missing day’s entry!
Ran across a fellow who’s disentangling the GISS data & Fortran programs, and odd as it may seem, GISS drops the entire month’s data if any daily entry is missing.
http://chiefio.wordpress.com/gistemp/
Why, would any sane scientist drop 27 to 30 valid data points because 1 is missing? Simple interpolation would make far more sense than filling in the month from neighboring stations (up to 1000km away). Here in the Central US, the temperature often varies by 10 F within 100 mile radius.
Andrew (09:52:02) : Within the US, GISS’s Al-Gore-Rhythm seems to work OK, but in the ROW it’s not clear anyone has a method that doesn’t suck.
Um, IMHO, the GIStemp method is very sucky too:
http://chiefio.wordpress.com/2009/08/30/gistemp-a-slice-of-pisa/
Which reminds me. Joe, do you know what kind of seasonality UHI etc. would have? I’m trying to figure out why there seems to be so much winter warming in many data sets and very little summer warming.
I think I have the answer here:
http://chiefio.wordpress.com/2009/08/13/gistemp-quartiles-of-age-bolus-of-heat/
http://chiefio.wordpress.com/2009/08/17/thermometer-years-by-latitude-warm-globe/
And a bit more, including some source code to play with the data yourself:
http://chiefio.wordpress.com/2009/08/09/co2-takes-summers-off/
RE:Gulf Stream
Yeah, there have been many articles posted recently that it has slowed. It isn’t the first time. There were in 1907 about the same thing.
Only the fact that there is significant doubt about the quality of the basic temperature data should halt any attempt to control CO2 emissions.
“Mike D. (09:46:59) :
Excellent synopsis. Kudos to Joe D’Aleo.
“The emperor has no clothes.”
If I may suggest a major modifcation to your comment:
The “CLOTHES” have no “EMPEROR”.
crosspatch (09:57:20) :
That and this…
http://i44.tinypic.com/29dwsj7.gif
Which either you or Smokey originally posted IIRC
DaveE.
Was it Leif’s paper here about the solar magnetic stuff, with a black and a red graph that showed quite good correlation; and as I recall, it said somewhere there that a year wasn’t plotted if they had a missing month of data.
That makes no sense to me. If you have 11 months of data; which you are homogenising into a single annual number, it would seem to me that some interpolation from the 11 existing points; or even as simple as the average of the two adjacent points would give a better representation of what happened that year; than simply no value whatsoever; that is the ultimate in data distortion to have one year’s value be infinitely indeterminate.
As hokey as I believe this whole “science” is (climatology; not meteorology) I see no validity to just discarding a whole bunch of data for a single missing value that is going to get homogenised anyway; specially after a five year running average.
“In this recent post, we discussed the problems with recent data that showed the argument presented by the EDF’s millionaire lawyer playing clueless environmentalist on Lou Dobbs Tonight that this will be the warmest decade is nonsense. This claim was well refuted and Al Gore’s credibility disassembled by Phelim McAleer, of the new documentary Not Evil, Just Wrong that challenges the lies and exaggerations (totalling 35) in Al Gore scifi horror comedy film, An Inconvenient Truth. 9 were serious enough for a UK judge to require a disclaimer itemizing them be read whenever, the movie was shown in the schools.”
Climate Depot posted my videos of this Lou Dobbs CNN Story.
http://www.climatedepot.com/a/3306/CNNs-Lou-Dobbs-Hosts-Rare-Global-Warming-Debate-Over-Gores-Errors–Mocks-claim-that-capandtrade-is-market-based-plan-Video
“Hi all, what’s happening with the gulf stream? Is it slowing down? Look at the map in this site!
http://polar.ncep.noaa.gov/ofs/viewer.shtml?-natl-cur-0-small-rundate=latest
Is NOAA having issues with the model or has the gulf stream really stopped?”
Yeah, that looks really strange indeed. Something happened September 18 on all maps.
E.M.Smith (10:29:21) : The GISS corrections in Pisa would be ROW (ie not US) where they us a completely different UHI correction method that pretty clearly sucks. But I was refering specifically to the US.
You also didn’t answer my question as to the seasonality of UHI or landuse effects, but rather commented on it having something to do with the GISS method. But the winter warming I have seen occurs in many different data sets. GISS unfortunately does not seem to have monthly anomalies for the US, so I can’t compare them with NOAA’s, which show a strong winter effect. I’m trying to figure out how real that might be, given the indications that the USHCN used by NOAA still has spurious warming in it (GISS warms considerably less).