
We’ve been lectured time and again about the importance of having climate science work come from peer reviewed papers, saying that the work of dedicated amateurs has no place in climate science unless the work rises to publication/peer review level.
Yet that doesn’t seem to apply for United Nations science publications. Of course just one look at the front cover at left tells you its more about selling than science.
The cover image pulls at heartstrings, making the world appear as if it is running out of time before turning entirely into an inhospitable desert. That is an extreme view in my opinion.
Steve McIntyre’s blog discovery of UNEP’s folly bears repeating, because it shows the sort of sloppy science that is going into “official” publications.
This is much like the NCDC CCSP report just over a year ago where they used a photoshopped image of a “flooded” house.

In this case, the United Nations simply grabbed an image from Wikipedia that supported the view they wanted to sell. The problem with the graph in the upper right of page 5 of the UNEP report is that it itself has not been peer reviewed nor has it originated from a peer reviewed publication, having its inception at Wikipedia.
And then there’s the problem of “Hanno” who is an anonymous contributor. This is simply his/her artwork and interpretation. We don’t have any idea who “Hanno” is, nor apparently does UNEP.
Yet UNEP cites the graph as if it was a published and peer reviewed work as “Hanno 2009”. Yet UNEP doesn’t even get the year right as the graph was created in 2005:

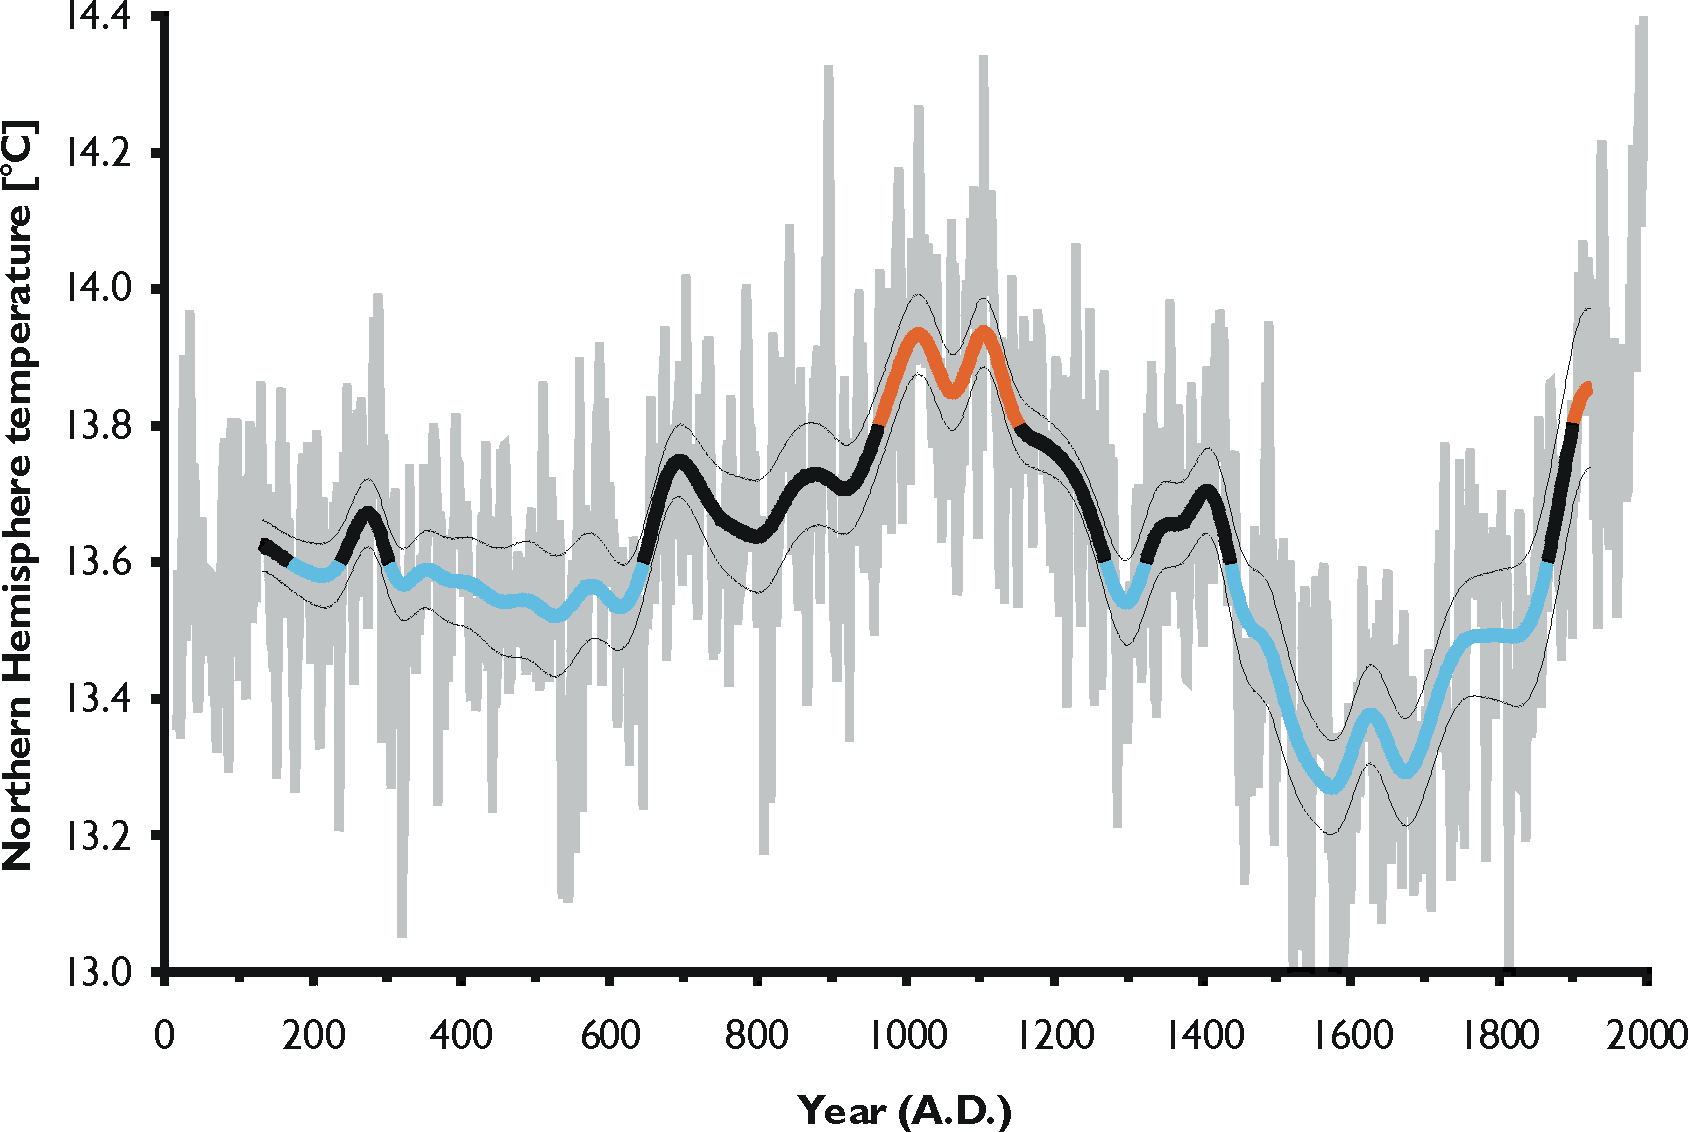
But as Steve McIntyre shows us, this graph from “Hanno” is just another variation of Mann’s discredited Hockey Stick based on questionable mathematics, outright errors such as data inversions, and dubious or excluded proxies that may not reflect temperature change at all.
From Climate Audit:
The UNEP CLIMATE CHANGE SCIENCE COMPENDIUM 2009 on page 5 uses the following graph from Wikipedia (not the IPCC Fourth Assessment Report):

CO2 concentration and mean global temperature during the past millennium. CO2 levels (blue line, lefthand axis) are given in parts per million, temperatures (red line, right-hand axis) in degrees Celsius. Source: Hanno 2009 Page 5
Hanno is the pseudonym for a Wikipedia contributor. The graphic itself compares CO2 levels from Mauna Loa and Law Dome ice core to a splice of the HAdCRU temperature index and the Jones and Mann 2004 reconstruction (dominated by Graybill bristlecone chronology).
The latter splice is, of course, the splice that Mann has informed us is never done by responsible climate scientists, further informing us that the allegation that such splices are done is disinformation by fossil fuel companies.
No researchers in this field have ever, to our knowledge, “grafted the thermometer record onto” any reconstrution. It is somewhat disappointing to find this specious claim (which we usually find originating from industry-funded climate disinformation websites) appearing in this forum.
========
I’ve done some additional review and here is what I’ve found about “Hanno”
First here is the Wikipedia source for the image:
http://commons.wikimedia.org/wiki/File:CO2-Temp.png
The following 4 pages on Wikimedia Commons link to this file. UNEP likely got it from the first page during a Google search.
UPDATE: From a Climate Audit commenter “Feedback”: Hanno is also the author of a non-hockey stick graph that can be found in the Norwegian Wikipedia article about the Migration Period (Norwegian: Folkevandringstiden) that shows a more Lamb-like relationship between the MWP and the current warm period:
Source is said to be:
Source: graph drawn by Hanno using data published by A. Moberg, D.M. Sonechkin, K. Holmgren, N.M. Datsenko, W. Karlén, and S.-E. Lauritzen (2005, Highly variable Northern Hemisphere temperatures reconstructed from low- and high-resolution proxy data. Nature (London), 433, 613–617). Temperatures for the last three decades of the 20th Century were taken from P.D. Jones, D.E. Parker, T.J. Osborn & K.R. Briffa (2005, Global and hemispheric temperature anomalies – land and marine instrumental records. In Trends: A Compendium of Data on Global Change. Carbon Dioxide Information Analysis Center, Oak Ridge National Laboratory, U.S.
http://no.wikipedia.org/wiki/Fil:NH_temperature_2ka.png
So apparently “Hanno” contradicts himself with his own set of artwork.
UPDATE2: The Wiki “Hanno” user page is interesting. Thanks to commenter “Dr. Spock”.
Discover more from Watts Up With That?
Subscribe to get the latest posts sent to your email.
Hanno has fabricated one of the most ginned up charts I’ve seen in a long time: click.
It has all the credibility of this chart: click.
Magnus A (14:31:11) : Icarus.
One thing needed for more than one degree heat from by human added CO2 is reinforcement, i.e. total positive feedback. Positive feedback would mean that climate is quite instable, which it isn’t. Also many measures of the response on Earth’s temperature from e.g. volcanoes and changes in clouds has showed negative feedback, which reduces impact from CO2.
There may very well be negative feedback mechanisms but that doesn’t mean there is a net negative feedback. For example, a warmer atmosphere and warmer ocean inevitably means an increase in atmospheric water vapour, which is of course a greenhouse gas – this is a positive feedback.
Let’s suppose that there is in fact a net negative feedback from forcings. In that case, the effect of the ~11-year solar cycle should be less than that predicted by straightforward radiative equilibrium calculations. This paper suggests the opposite:
http://arxiv.org/ftp/physics/papers/0411/0411002.pdf
The authors suggest that the effect of the solar cycle is actually twice as large as would be expected, which they attribute to net positive feedback.
Also, if you’re arguing that the Earth’s climate is very stable due to negative feedback mechanisms then it’s difficult to see how comparatively small changes in solar irradiance (Milankovitch cycles) have made such large changes in palaeoclimate – i.e. ice ages and interglacials. Don’t those changes suggest that the climate is actually quite sensitive to quite small forcings?
Icarus
Thank you for considering these things. Several points I should like to make:
1 When I talk about the AGW ‘scam’ I am referring to the alarmist rant we are continually subjected to in the MSM. Not to the many dedicated scientists an others who spend their lives collecting and interpreting dat.
2 Your long speech about forests, resources, fuel and the environment reflect my views entirely. Why wrap it all up in some specious and politically motivated clap trap? In the end the fallout will so degrade the credibility of science and the environmental movement that the problems in your list will be even more difficult to solve.
3 Icarus is a great pseudonym for someone who thinks that CO2 rather than the sun drives our climate. Please give me the actual data as you understand it that makes you think this.
Rather, call it “Summary Judgement” after having studied and reviewed the arguments, the basis and the ‘merits’ presented by both sides …
An aside, I cannot but help but see “Iscariot” (as in Judas ___) when cursorily inspecting your screen name … an intentional choice of same?
.
.
Robert E. Phelan (14:40:35) : Icarus (13:45:12) : And, Icarus, even if you, Hansen, Gore, Mann and Schmidt, the IPCC and the One himself are all right about AGW, the cost in human lives, freedom and dignity are too much to pay to make the futile attempt to keep the climate at some “optimum” agreed upon by a grasping, selfish, greedy elite.
It seems to me that at the moment at least, the ‘grasping, selfish, greedy elite’ are trying very hard to carry on with ‘business as usual’ and not spend anything at all on mitigation… but that aside, that ‘optimum’ climate you’re talking about isn’t just some arbitrary state, but the one that has supported all of human civilisation for the last 10,000 years or so. Don’t we at least have a responsibility to try to avoid causing dramatic changes which will have to be dealt with by future generations?
No-one disputes that there are billions of tons of greenhouse gases in the atmosphere which are the sole result of human activities in the last 250 years or so. We’re effectively conducting a substantial experiment on the planet we live on, without knowing for sure what the result will be. Is that responsible behaviour? Even it were true that this CO2 would have no detrimental effect at all, we don’t know that now, so considering the risk, shouldn’t we just not do the experiment?
Icarus:
Again fraught with hidden assumptions.
Let me rephrase. Simply spend trillions, condemning untold hundreds of millions of people to disease, premature death, and suffering, because there might be a problem. In case you don’t realize it, costs have costs.
Icarus (19:06:17) :
“… that ‘optimum’ climate you’re talking about isn’t just some arbitrary state, but the one that has supported all of human civilisation for the last 10,000 years or so…”
I may be offering a cultural anthropology class next semester; maybe you’d like to sign up for it and learn something real.
The same UNEP report has Figure 1.2 credited to two, the second being Rhode 2009. Who? Looks like it’s Wikipedia image http://commons.wikimedia.org/wiki/File:Mauna_Loa_Carbon_Dioxide.png with some background removed.
The report also uses illustrations from the other scientific sources “National Geographic” and “WWF”.
What is the U.N. position on copyrights and licensing?
Oops. Typo in Robert A. Rohde’s name.
Stuart Huggett (18:53:01) : Icarus
Thank you for considering these things. Several points I should like to make:
1 When I talk about the AGW ’scam’ I am referring to the alarmist rant we are continually subjected to in the MSM. Not to the many dedicated scientists an others who spend their lives collecting and interpreting dat.
Fair point. The ‘MSM’ as you call it are in the business of making money and that is all they care about – they will sensationalise, distort and invent information freely if they think it will make an extra quid. They will be controversial and contrary purely for the sake of it, regardless of the merit of any particular argument. Nevertheless, that doesn’t mean that any particular argument you see in the MSM is wrong or exaggerated. They could just happen to be right.
2 Your long speech about forests, resources, fuel and the environment reflect my views entirely. Why wrap it all up in some specious and politically motivated clap trap? In the end the fallout will so degrade the credibility of science and the environmental movement that the problems in your list will be even more difficult to solve.
I don’t know what ‘claptrap’ you’re referring to. I’m only interested in the science.
3 Icarus is a great pseudonym for someone who thinks that CO2 rather than the sun drives our climate. Please give me the actual data as you understand it that makes you think this.
I don’t think that at all – in fact I think the sun has quite a substantial effect on the climate with relatively small changes in solar irradiance, which makes it all the more alarming that we’re ‘twiddling the knobs’ by making substantial changes to atmospheric greenhouse gases when it appears that the climate is really quite sensitive to relatively small forcings, including greenhouse gases.
For example: The last glaciation is thought to have resulted from a forcing of around 7 W/m2 (causing about a 5°C change in global temperature), but that includes long-term feedbacks from ice sheets, vegetation changes etc. – the actual change in solar irradiance was maybe half that, or a 2% change in solar forcing.
The radiative forcing for a doubling of CO2 is estimated at 3.7±0.4 W/m2 – not much different from that 2% change in solar irradiance… and that is before the long-term feedbacks are taken into account. So, doubling CO2 is likely to have the same magnitude of effect (in the long term) as the difference between an ice age and an interglacial – perhaps a 5°C change in global average temperature. That’s pretty significant, isn’t it?
The “WWF”? The World Wrestling Federation has a dog in this fight?
Oops, sorry, name change – the WWF I refer to is now former, and now known as World Wrestlng Entertainment, http://www.wwe.com
.
.
.
Well, Icarus, with the planet cooling while CO2 rises you are at least in less danger of the sun melting your feather wax and causing your gross weight to exceed your coefficient of lift.
Icarus (19:57:35) :
The radiative forcing for a doubling of CO2 is estimated at 3.7±0.4 W/m2 – not much different from that 2% change in solar irradiance…
Estimated by whom?
What I have seen is it is the number needed so that the models could fit the temperature data ( they cannot fit anything else after all). It is in actuality a parameter coming out of a fit after innumerable assumptions, the main one being that “we want CO2 to be the culprit”.
Had they changed in the input to the models “cloud cover”, for example, which their output fits badly if you go and look in the IPCC reports, they could fit the temperature data by that “forcing” without needing CO2 at all. It would be hard though to create a chicken little syndrome in the general public by advising reducing water use.
It is all a huge video game based on General Circulation Models’ which are based on taking a linear approximations to solutions of fluidity equations at the boundaries of boxes that make a grid of 200km by 200km by 20km height of the globe, and anything they cannot compute entered as a parameter by hand.
With four parameters you can fit any function and with five an elephant. There are many more than that in the GCMs and the only thing they fitted successfully was the temperature ( check the AR4 chapter 8) and the data in this century does not follow their “predictions” as has been clearly documented in many places ( check Lucia’s the blackboard).
These GCM cannot predict the weather for ten days well: due to the highly non linear form of the solutions of the fluidity equations, after a number of time steps non linearity kicks in.
The same models with a change of time scale are supposed to work for climate, but the defect is the same: after a number of time steps non linearity, reality, steps in and diverges from the proposed extrapolations of fits to previous data.
Maybe here I should answer a question I was asked in another thread : maybe the models cannot predict the four seasons weather either ! But that even astrologists can predict: you will meet a handsome stranger and have a great date
And I will also enter in my diatribe about propagation of errors. There is no propagation of errors in the GCM outputs of the IPCC, and this is acknowledged in chapter 8 of the AR4, search for “likelihood”. The errors are estimated by the experience of the modelers!!!
If normal error propagation were used, i.e. the input parameters varied within their errors and a chisquare per degree of freedom error were given, I am guessing the solutions, and therefore predictions, would have at least 2C degrees error bars (otherwise they would have shown error bars).
What they show, i.e. the spaghetti graphs that fool the average scientist’s eye that they are error bands, are proposed to be a simulation of the chaotic nature of climate. I should love to see an engineer proposing a bridge with such methods.
The only effort at truly simulating the chaotic nature of climate that I have seen has been discussed here in the Tsonis et al paper thread, where they use the air and ocean currents to project future behavior. Imo that is the way modeling should go if we are to have any sense in this climate prediction mess ( they predict cooling the next 20 years or so).
Icarus. Anna V has put it far better than I could. We are expected to make major changes to our civilisation on the basis of highly disputed ‘estimates’ and ‘predictions’. We need better reasons and much less hysteria if this to be done effectively
ChrisM (11:30:31) : My son has been told he must not use wikipedia for school work as it is unreliable.
Too bad a video couldn’t be made of people’s reaction when they find that the UN uses material from a Wikipedia author.
jeez (15:37:52) : Oh and by the way they’ve also noted you’re a fanatic socialist ecofreak with delusions of ecotopia. Want to come by and comment on it?
Thanks for the good laugh!!
Icarus (19:57:35) : The last glaciation is thought to have resulted from a forcing of around 7 W/m2 (causing about a 5°C change in global temperature), but that includes long-term feedbacks from ice sheets, vegetation changes etc. – the actual change in solar irradiance was maybe half that, or a 2% change in solar forcing.
The radiative forcing for a doubling of CO2 is estimated at 3.7±0.4 W/m2 – not much different from that 2% change in solar irradiance… and that is before the long-term feedbacks are taken into account. So, doubling CO2 is likely to have the same magnitude of effect
You sound like quite an expert.
Say, have you done the math in this video to see if the man is right; that there can be no runaway warming from increasing amounts of co2 ? There has been an open challenge for 2 years for someone to show that he is wrong. Until now no one has done it.
Can you?
If you can’t then you shouldn’t speak with such certainty about what co2 does to the environment.
Miskolczi`s New Greenhouse Law
Here’s an insight into what’s going on at British science institutions. Apply it to alarmist nonsense for a clear picture of how scientists have become pimps and advertisers for 3rd parties
http://news.bbc.co.uk/1/hi/magazine/8270688.stm
“Steve McIntyre’s discovery of a UNEP’s folly bears repeating” –
shouldn’t have an “a” before “UNEP’s”.
>>>the cost in human lives, freedom and dignity are too much
>>>to pay to make the futile attempt to keep the climate at some
>>> “optimum” agreed upon by a grasping,
This has nothing to do with climate – they all know the science is false.
It is all about setting up a One World government. To do so, you need One World (Global) issues for this Global government to tackle. Which is why we now have Global Warming, Global Carbon Credits, Global pandemics (that never happen), Global financial crashes, Global depressions, Global terrorism, and recently we have Russia and China pushing for a Global currency.
It is all about politics, not science or climate.
.
An outstanding summary here:
http://www.americanthinker.com/2009/09/global_warming_science.html
Gene Nemetz (23:50:23) : Say, have you done the math in this video to see if the man is right; that there can be no runaway warming from increasing amounts of co2 ? There has been an open challenge for 2 years for someone to show that he is wrong. Until now no one has done it. Can you?
The argument states that the optical depth of the atmosphere is a constant. It isn’t. The addition of one kind of greenhouse gas isn’t magically and automatically counterbalanced by an equivalent removal of a different kind. There is no mechanism by which (for example) increasing atmospheric CO2 by 40%, as we have done, causes just the right amount of water vapour to drop out of the atmosphere to result in no change in the greenhouse effect. Indeed, the opposite is true – increasing atmospheric CO2 causes warming which in turn causes an increase in atmospheric water vapour (warmer oceans cause more evaporation and a warmer atmosphere holds more water), hence there is a positive feedback.
So, the argument is clearly nonsense.
If Icarus is so sure about CO2 causing positive feedback through increased atmospheric water vapor, perhaps he can expalin why we continue to have an equable climate even though past CO2 levels were as much as 100 times greater than today. What happened to the positive feedback back then?
Icarus
“that ‘optimum’ climate you’re talking about isn’t just some arbitrary state, but the one that has supported all of human civilisation for the last 10,000 years or so. Don’t we at least have a responsibility to try to avoid causing dramatic changes which will have to be dealt with by future generations?”
And just what optimum climate are *you* speaking about? The postglacial climate optimum? or the Preboreal cold event? or the 8,2 Kyr cold event? or the 4.2 Kyr cooling? or the Roman Warm Period? or the MWP? or the LIA? or….
For your information climate has changed a quite a bit during those 10,000 (actually 11,700) years since the last ice age ended. Generally speaking human civilizations have flourished best when it was warm.
Icarus,
This water vapour feedback argument is quite strange on three counts. The IPCC say that if the temperature increases by about 1.2C (the acknowledged temperature sensitivity to doubling CO2 without feedbacks) then the warming will lead to increased water vapour that will drive temperatures up by 3.5C. However, the first problem with this is that the global average temperature varies by 4C during a year. Could you explain why this does not invoke the water vapour feedback as described?
The second point about warmer air holding higher absolute amounts of water vapour is true as far as the train of thought goes, but it does not follow this to its conclusion. It ignores the fact that this water vapour eventually comes out as precipitation as warm fronts rise over cold air masses. This is basic meteorology. If this was not the case then there would indeed be a positive feedback that forces water to evapourate in ever higher absolute amounts, causing ever higher temperatures until the whole of the earth’s oceans will end up suspended above our heads. Such a thing has never been observed.
Thirdly, if CO2 has such a violent affect on climate, then can you explain why CO2 levels averaged around 2000ppm during the Mesozoic without the catastrophic effects you imply should happen? This is not 1 but 3 doublings. By your numbers this should have led to a temperature increase of 10C, utterly catastrophic!
Icarus,
When you highlight positive feedbacks in solar TSI, as you did when you cited the excellent paper by Douglass et al, and use that to make general extrapolations to conclude that positive feedbacks dominate the Earths climate, you are committing an error of logic.
Solar cycles may well cause temperature amplification by positive feedback. Indeed, this has been claimed by Svensmark’s GCR hypothesis. In that scenario, the higher solar activity would result in a reduction in cloud cover that allows more insolation of the Earths surface and subsequent warming.
Now, consider that the effect of this warming would lead to increased evaporation, formation of Cu Nimb clouds raising sensible heat to the tropopause, and consequent precipitation. The clouds increase albedo AND lift sensible heat where it can radiate into space. This would be a net negative feedback.
Of course, the two feedbacks do not happen contemporaneously. First there is the positive feedback as described by Douglass and there is a time lag before the oceans can warm sufficiently. Then the negative feedbacks increase and overwhelm the positive. Therefore it is perfectly possible to envisage positive feedbacks operating on particular forcing mechanisms while still having a net negative feedback operating on the climate at a later point in time.
There should be nothing strange or difficult to understand about this.