Minus 13 degrees – the coldest it’s been in April
From Weatherzone – Brett Dutschke,
Wednesday April 29, 2009 – 14:58 EST
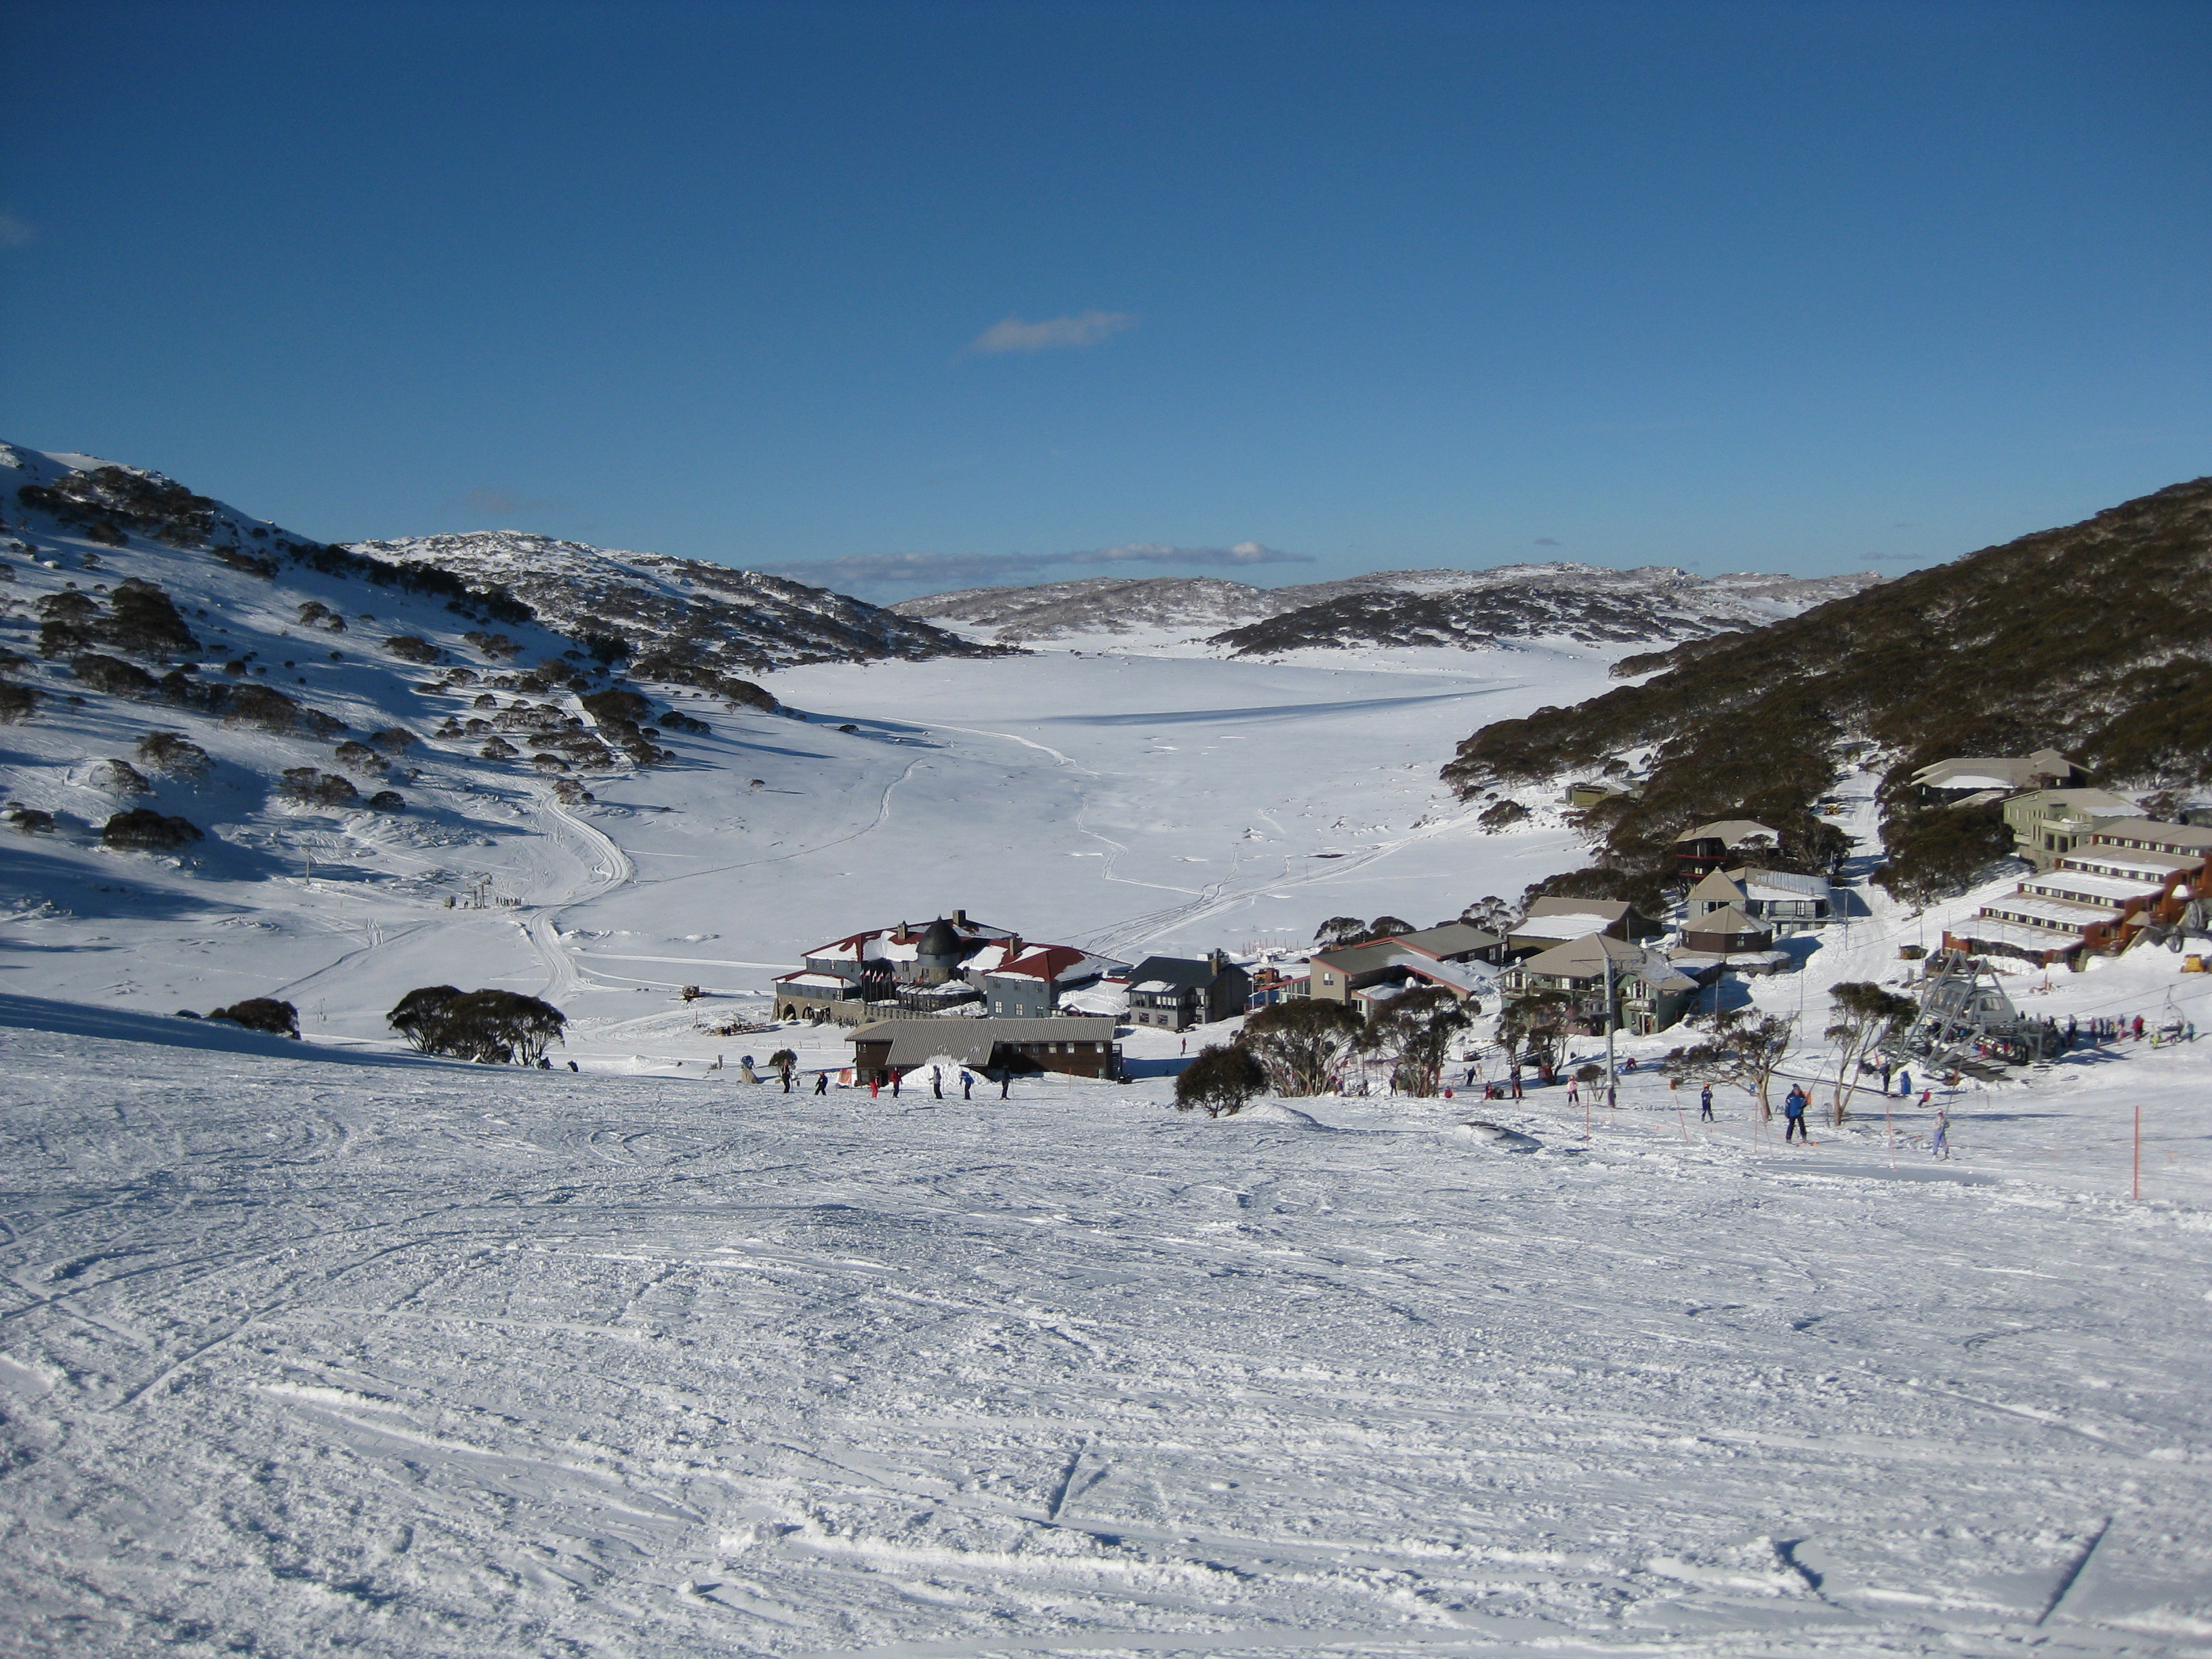
A new Australian record was set early this morning, a temperature of minus 13 degrees, at Charlotte Pass on the Snowy Mountains.
This is the lowest temperature recorded anywhere in Australia in April and is 13 below the average. Nearby at Perisher it dipped to minus 11 degrees and at the top of Thredbo it dipped to minus 10.
Across the border, on the Victorian Alps April records were broken at Mt Hotham where it chilled to minus eight degrees and Mt Buller and Falls Creek where it got as low as minus seven.
 A few other locations set April low temperature records also. In Tasmania Lake Leake was as cold as minus six, Sheffield and Dover both reached minus one and Flinders island got to zero. Hobart had its coldest April night in 46 years, recording a low of 1.7 degrees, seven below average.
While much of inland NSW and Victoria will be colder tomorrow morning than it was this morning under clearer skies, the Alps should be a little warmer due to a rise in humidity.
Note, all temperatures in the story above are in Centigrade. Photo and map added by Anthony.
Here are the all-time highs and lows for the continent of Australia (source Perth Weather Center)
HIGHEST RECORDED TEMPERATURE:
- Oodnadatta, South Australia 50.7 C (123.3 F) on the 2nd January, 1960
LOWEST RECORDED TEMPERATURE:
- Charlotte Pass, New South Wales -23.0 C (-9.4 F) on the 29th June, 1994
While this is certainly a significant new cold record this early in Australia’s fall going on winter, one must always remember that weather is not climate. – Anthony
(h/t to WUWT reader “Chuck”)
O/T Remember that sun speck fro a couple of days ago, it is still trying and trying. Spaceweather has now declared it a sun spot. You’ve gotta look hard to see it. It is more visible on the magnetogram; it is a cycle 23 Sun Speck that’ll probably fade before the day is out.
Pretty chilly “Down Under”. Maybe the sunspecks (Cycle 23?) forming today will blast a heat wave your way. 🙂
From Google earth: South magnetic pole is at 63° 29′ south latitude and 138° longitude (off Antarctica)….going up to Australia! 🙂
As for Australia, now I know why they’re called the Snowy Mountains. I never really associate snow and Australia.
“The D Man (07:17:35) :
Pat,
The Australian BOM claimed that we will have a mild winter. We will have to wait and see.”
Been a cool “summer”, cool “spring” and certainly cool into autum(n). Dooner out last night mate, that’s early for NSW.
Perth, Western Australia where I live has recorded the second warmest April on record. That is not to say it will not be a cold winter though. I also hope it will rain more because it has been a bit dry so far. But that’s weather!
“Ian (07:27:23) :
I live in Fremantle Western Australia and I have to say that it certainly has not been a cool autumn here. We re now well into Autumn have had very little rain and temperaures are still aroun 26 Celsius. Please don’t forget WA in the “Australia widew stories” as many of us who live here who are very supportive of this blog’s ethos.”
WA? It’s always hot there! The other issue is, WA is a 1/3 of the land mass of Aus, and only 10 people live there!!
PS. OK! Sorry, I forgot Perth!
All I ever see in the mainstream media are examples of unusually warm weather, so it is a good corrective to see examples of unusually cold weather.
In keeping with the topic:
Frost on my rooftop in the San Francisco East Bay this morning !!
Does anyone have a friend in the MSM that could tell them why this hoax is continuing ?? Is it orchestrated from above, irresponsible journalism, selling ads, or just plain shoddy, “meet-a-deadline” work ??
In fairness to the local media here, during the heatwave several days ago, I did not see one polar bear on the news, so maybe they’re beginning to see that something’s up.
I recently received an e-mail from and old, but not particularly close friend who works for Reuters. I took the opportunity to ask him, but got no response.
Flanagan,
You know your mentioning “weather is not climate” wouldn’t be so lame if it hadn’t been already echoed 10,000 times by warmers.
But worse and more lame is that warmers have used every conceivable weather observation themselves to show AGW is happening. There is nothing they won’t throw on the pile they build. All while ignoring the weakened and collapsing foundation their AGW movement sits upon.
Hurricane Katrina, heat waves in France, fires in Australia, evapoarting ice caps, ocean dead zones, climate refugees, disappearing islands, species extinction, vanishing snow packs, loss of fresh water supplies, crop loss, more poverty, famine and wars, on and on and on. All of which have been linked to human fossil fuel use and CO2 emissions with little or no scientific basis at all.
So while you suggest there is some problem with a discussion about record cold, the AGW movement churns out a tsunami of absurdity and dishonesty that far exceeds, 100 fold, whatever you perceive happening in the skeptics camp.
saltator said:
It is not unusual for one side of a continent to experience different conditions than the other.
The East of Australia is affected by conditions in the Pacific, while the West is affected by Indian Ocean conditions, and so forth.
Sonicfrog (07:01:54) : “After a very hot news-making week here in California, where many records were broken, we are now experiencing colder than normal temps, which do not make the news. To be fair, the lows aren’t as low as the highs were high..”
True, but what is important in these weather events is that the three-day hot spell was due to an anomalous high pressure that sat over the state, compressing the air mass and heating it up. (CO2 was not involved.) The 7-11°F cooler-than-normal temps we’re experiencing now are part of a normal April/May weather pattern, only substantially cooler. Do you understand the subtile difference—anomalously hot vs normal, but cooler?
Also, the Central California sea temp is 5°C cooler than is typical this time of year because the wind/coriolis effect is bringing up cold benthic waters to the surface. Plankton swarms are being seen now in Monterey Bay which portends a good rorqual summer (blue and humpback whales in our neighborhood) and strong sea bird breeding on the Farallon Islands. These are conditions more similar to the late 1970s than the 1990s or earlier this century.
BTW: the cooler temps are not leading the news, but every weather cast I’ve seen these past few days has mentioned the unusually cooler temps.
OT NEWS: Gavin (RC) seems to admit, for the moment and until he gathers aditional information, that the Wilkins Ice Shelf collapse may not cause any significant sea level rise. See comments 601 and 602 on the “Wilkins Ice Shelf Collapse” topic, at Real Climate (no link provided to avoid spam filters, but the topic is the 6th most recent one, from April the 6th).
BRUCE HALL
Yousaid
FACT: While different pockets of the country have experienced some cold winters here and there, the overall trend is warmer winters.
Your first mistake is to rely on Enviornmental Defence Fund for climate data. Seek out various reliable original sources and do your own research on what is happening to global temperatures . No one disputes a gradual warming of the planet over the last century. What is being debated is what has been happened during the last 30 years and what is behind this latest warming period which only lasted 1994-2008 and is not indicative of long term climate patterns at all . The globe has been cooling since 2002 and you can find plenty of evidence of this cooling across the globe including global oceans and atmosphere. The graph below illustrates this cooling as documented by three organizations that monitor temperatures.
http://www.woodfortrees.org/plot/uah/from:2003/plot/rss/from:2003/plot/gistemp/from:2003/plot/uah/from:2003/trend/plot/rss/from:2003/trend/plot/gistemp/from:2003/trend
Adolfo Giurfa (06:09:07) :
vukcevic (05:17:27) In my 1st.post where antarctica, read Artic.
Señor Guirfa
Erroneous writing is also one of my privileges. I too had recently some good Spanish wine. As good Doc Leif knows, I am man of outrages ideas.
Land of Oz is freezing due to the global warming. I am being serious ‘onest!
If the Antarctica ice is melting, all that extra cold water pouring in, causes the Antarctic Circumpolar Current to spread out, blocking circulation of warm water from Indian and Pacific Oceans between Ozy and Kiwi lands.
http://sealevel2.jpl.nasa.gov/jr_oceanographer/images/o-zlotncki-oceancir.jpg
If I was Ozy, I would start believing in the global worming.
Loss of the Christmas merriment on the Bondai beach would be a great national tragedy.
ski report
“it’s snowing all over the world”
http://www.ifyouski.com/news/newsarticle/?ObjectID=8721516
There’s a treasure trove of information about western Australia at http://www.waclimate.net/
For example:
Perth
(capital city population 2008 – 1.6 million / population history)
1897-1910 at Perth Regional
(elevation 19m, 14 years)
Average mean minimum 12.8
Average mean maximum 22.8
1921-1950 (30 years) / min 13.0 / max 23.2
1931-1960 (30 years) / min 13.0 / max 23.3
1941-1970 (30 years) / min 13.1 / max 23.3
1951-1980 (30 years) / min 13.5 / max 23.6
1961-1990 (30 years) / min 14.0 / max 23.9
1971-1992 (21 years) / min 14.2 / max 24.1
Relocation to Perth Metro
(elevation 25m, 4km distance)
1994-2008 (15 years)
Average mean minimum 12.6
Average mean maximum 24.5
AGW or UHI? UHI apparently. Some of the inland small towns show much less:
Kellerberrin [Not very far from Perth]
(elevation 250m, shire population 2006 – 866)
1911-1930 (21 years surveyed)
Average mean minimum 10.5
Average mean maximum 25.1
1921-1950 (30 years) / min 10.8 / max 25.2
1931-1960 (30 years) / min 10.9 / max 25.0
1941-1970 (30 years) / min 11.1 / max 24.8
1951-1980 (30 years) / min 11.2 / max 24.9
1961-1990 (27 years) / min 11.2 / max 25.0
1971-2000 (28 years)
Average mean minimum 11.1
Average mean maximum 25.1
—————-
Marble Bar
(elevation 182m, shire population 2006 – 194)
Historically the hottest town in Australia, possibly the world
1901-1930 (30 years surveyed)
Average mean minimum 19.7
Average mean maximum 35.6
1921-1950 (30 years) / min 19.6 / max 35.5
1931-1960 (30 years) / min 19.7 / max 35.4
1941-1970 (30 years) / min 19.6 / max 35.2
1951-1980 (30 years) / min 19.9 / max 35.1
1961-1990 (30 years) / min 20.1 / max 35.0
1971-2000 (30 years)
Average mean minimum 20.4
Average mean maximum 35.1
Sorry, OT – but the Catlin site reported this morning that the team is spending its 6th day in the tents, waiting to be resupplied and living on low calorie rations. Their position this morning is given as ~7 km NW of yesterday’s, however. Hmmmm…isn’t that a long way to drift overnight? Perhaps somebody can confirm this possibility.
Flanagan (05:25:37) :
If it gets any warmer…..
“…hot records that were broken in Australia at several locations were not reported here at all…”
“…If this were 13 degrees above average and a new warm record for Australia it would be…” ignored by this blog…
I think you guys are intentionally misunderstanding the point. You know very well that we can turn on the TV or go to a hundred different weather websites and find headlines proclaiming the latest heat record. Here’s a few headlines you might enjoy more:
http://www.usatoday.com/weather/news/2009-04-20-california-record-heat_N.htm
http://www.time.com/time/world/article/0,8599,1876299,00.html
So do you plan to take issue with them also? If not, why not? What they’re doing is exactly the same thing WattsUp is doing, i.e. presenting evidence to support a point of view about a current issue.
The difference is, this is a personal blog in which viewpoints are presented that are interesting to the author; USA Today and Time Magazine are mainstream news outlets pretending to report stories without interjecting any point of view.
It is their headlines that you should be complaining about. Although personally I kind of liked this one. WHAT were they blaming both droughts and floods on??? 😉
http://www.time.com/time/magazine/article/0,9171,944914,00.html
O/T
Yep, that’s a pretty solid SC23 sunspeck all right; southern hemisphere, low latitude, right magnetic signature. Or, as solarcycle24.com puts it, “Like a bad ex-lover… Cycle 23 will just not let go.”
It’s also been picked up by Catania, so it’s sure to get counted by SIDC. Not yet picked up by SWPC as of 1718 UTC, but that could change.
Paul James (08:10:46) :
Given the chaotic and multifaceted nature of the Earth’s Climate inluencing one variable, CO2, and expecting a result is analagous to expecting to alter the trajectory of an aircraft in flight by moving the tray table in front of your seat up and down.
Probably true, but this analogy lacks the fear factor. Try this one: … is analogous to expecting to alter the trajectory of an aircraft in flight by using your cell phone or iPod.
When fear is involved you can get the majority to go along with just about anything by using the Precautionary Principle.
vukcevic (09:34:01) : You surely are the one culprit for the state of the Sun, you have the Sun kind of dizzy because of your wavy equation..:)