A guest post by Steven Goddard
One of the most widely discussed climate feedbacks is the albedo effect of polar sea ice loss. Ice has a relatively high albedo (reflectance) so a reduction in polar ice area has the effect of causing more shortwave radiation (sunlight) to be absorbed by the oceans, warming the water. Likewise, an increase in polar sea ice area causes more sunlight to be reflected, decreasing the warming of the ocean. The earths radiative balance is shown in the image below. It is believed that about 30% of the sunlight reaching the earth’s atmosphere is directly reflected – 20% by clouds, 6% by other components of the atmosphere, and 4% by the earth’s surface.

We all have heard many times that summer sea ice minimums have declined in the northern hemisphere over the last 30 years. As mentioned above, this causes more sunlight to reach the dark ocean water, and results in a warming of the water. What is not so widely discussed is that southern hemisphere sea ice has been increasing, causing a net cooling effect. This article explains why the cooling effect of excess Antarctic ice is significantly greater than the warming effect of missing Arctic ice.
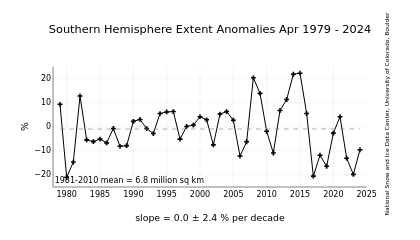
Over the last 30 years Antarctic sea ice has been steadily increasing, as shown below.

December is the month when the Antarctic sun is highest in the sky, and when the most sunlight reaches the surface. Thus an excess of ice in December has the maximum impact on the southern hemisphere’s radiative balance. In the Antarctic, the most important months are mid-October through mid-February, because those are months when the sun is closest to the zenith. The rest of the year there is almost no shortwave radiation to reflect, so the excess ice has little effect on the shortwave radiative (SW) balance.
This has been discussed in detail by Roger Pielke Sr. and others in several papers.
So how does this work? Below are the details of this article’s thesis.


1. As mentioned above, the Antarctic ice excess occurs near the December solstice when the sun is highest above the horizon. By contrast, the Arctic ice deficiency appears near the equinox – when the sun is low above the horizon. Note in the graph below, that Arctic ice reaches it’s minimum in mid-September – just when the sun is setting for the winter at the North Pole. While the September, 2008 ice minimum maps were dramatic, what they did not show is that there was little sunlight reaching the water that time of year. The deviation from normal did not begin in earnest until mid-August, so there were only a couple of weeks where the northern hemisphere SW radiative balance was significantly impacted. Thus the water in most of the ice-deficient areas did not warm significantly, allowing for the fast freeze-up we saw during the autumn.
The 2008 peak Arctic ice anomaly occurred near the equinox, when it had the minimum heating effect on the ocean.
By contrast, the peak Antarctic ice anomaly occurred at the December solstice, when it had a maximum cooling effect, as shown below.
2. The next factor to consider is the latitude of the ice, which has a strong effect on the amount of solar insolation received. Arctic sea ice is closer to the pole than Antarctic sea ice. This is because of the geography of the two regions, and can be seen in the NSIDC images below.
Antarctic sea ice forms at latitudes of about 55-75 degrees, whereas most Arctic ice forms closer to the pole at latitudes of 70-90 degrees. Because Antarctic ice is closer to the tropics than Arctic ice, and the sun there reaches a higher angle above the horizon, Antarctic sea ice receives significantly more solar radiation in summer than Arctic sea ice does in its’ summer. Thus the presence or absence of Antarctic ice has a larger impact on the SW radiative balance than does the presence or absence of Arctic ice.
At a latitude of -65 degrees, the sun is about 40 degrees below the zenith on the day of the solstice. Compare that to early September negative anomaly peak in the Arctic at a latitude of 80 degrees, when the sun is more than 70 degrees below the zenith. The amount of solar radiation hitting the ice surface at those maxima is approximately 2.2 times greater in the the Antarctic than it is in the Arctic = cos(70) / cos(40) .
The point being again, that due to the latitude and date, areas of excess Antarctic ice reflect a lot of SW radiation back out into space, whereas deficient Arctic ice areas allow a much smaller quantity of SW radiation to reach the dark surface of water. Furthermore, in September the angle of incidence of the sun above the water is below the critical angle, so little sunlight penetrates the surface, further compounding the effect. Thus the Antarctic positive anomaly has a significantly larger effect on the earth’s SW balance than does the Arctic negative anomaly.
3. The next point is an extension of 2. By definition, excess ice is further from the pole than missing ice. Thus a 10% positive anomaly has more impact on the earth’s SW balance than does a 10% negative anomaly.
4. Due to eccentricity of the earth’s orbit, the earth is 3% closer to the sun near the December solstice, than it is during the June solstice. This further compounds the importance of Antarctic ice excess relative to Arctic ice deficiency.
All of these points work together to support the idea that so far, polar ice albedo feedback has been opposite of what the models have predicted. To date, the effect of polar albedo change has most likely been negative, whereas all the models predicted it to be positive. There appears to be a tendency in the climate community to discount the importance of the Antarctic sea ice increase, and this may not be appropriate.
Allan M R MacRae (08:50:37) :
SOME GLOBAL COOLING PREDICTIONS (UP TO 2007 – SINCE 2008 THESE HAVE BECOME TOO NUMEROUS TO INCLUDE)
I have heard this blog being referred to as “The cold weather and astrology blog”.
Leif’s admitted the connection, the truth at last.
Leif said “I have heard this blog being referred to as “The cold weather and astrology blog”
Lighten up, Ed.
Pierre Gosselin,
Your not alone. Don’t give in, Ed.
Leif if you are referring to WUWT (couldn’t be sure) then that’s one of the more tame labels.
My all time favorite is an RC commenter who recently called us “Watts Up Your A**”, see Steve McIntyre’s take on it here:
http://www.climateaudit.org/?p=4814
I get a chuckle out of such angry labels coming from RC. – Anthony
Terry S says:
That is not correct. They did not assume each year’s temperature is independent of the last. They tried various different autocorrelations. See here for more discussion: http://tamino.wordpress.com/2009/01/10/taint-likely/
Steven Goddard: Great post! So straightforward and clear!
Art, #1: The study says:
“Between 1880 and 2006 the average global annual temperature was about 15°C. However, in the years after 1990 the frequency of years when this average value was exceeded increased.”
Duh! I think most folks assume we are still coming out of the Little Ice Age, and wouldn’t that fully explain the interpretation of the statistics provided in that study?
Leif, did you really say:
Sunspot numbers are well on the way down in the next decade. Sunspot numbers will be extremely small, and when the sun crashes, it crashes hard. The upcoming sunspot crash could cause the Earth to cool.
http://www.newscientist.com/unpwlogin.ns
–Leif Svalgaard, Stanford University, 16 September 2006
wattsupwiththat (12:15:40) :
if you are referring to WUWT (couldn’t be sure)
I was.
I get a chuckle out of such angry labels coming from RC.
Yeah, there are many angry folks out there.
Politics and religion and agenda-mongers have found ways of channeling and exploiting that anger. Science has not figured out yet how to do this.
nobwainer (Geoff Sharp) (21:59:08) :
It would be interesting to see if the trend in Antarctic sea ice follows one of the components of the Milankovitch cycles. EG. more / less daylight hours per year at the poles.
If I remember my Milankovitch correctly, the limiting factor leading to a new ice age is the retention of north polar snow & ice during the summer. Antarctic snow & ice is always present, and arctic snow & ice is always present in winter. What varies is the summer snow & ice in the arctic.
Now this thread has the interesting point that the snow & ice accumulation in the summer in the antarctic may also be important. Since this is in phase with Milankovitch cycles, it would reasonably be so. (Both poles are getting less sunshine as the polar tilt becomes less). It may be that the antarctic provides a little ‘kick’ that helps the arctic stay frozen over in summer that leads to glaciation.
What I also find interesting is that the AGW folks are just worried sick over the loss of summer sea ice in the arctic and desperately want the arctic to stay covered all summer long… exactly the conditions that put you into an ice age glaciation… IF we ever have persistent ice cover over the whole arctic through the summer, start looking into that vacation home in Ecuador 😉
I don’t quite get the reason for Zorita’s and von Storch’s study about the lack of randomness of the last most warm years and even less the title of the link in ScienceDaily.
Sceptics usually point out that climate and temperatures were never constant, always changing. And the discussion is about the cause of recent changes, to which the cited study doesn’t add anything new.
About the cold weather – a remark from a recent article about the current gas crisis in Europe. The writer calls the recent European January temperatures (-10 to -25 Celsius) “unseasonally cold”. Well, I was born in 1950 in the heart of Europe and I would definitely not call such temps “unseasonal”. Having -10 to -15 C in January isn’t anything extraordinary (although pretty annoying for me, an old lady). Maybe the writer of the article was born after the chilly 60-70’s…
Ric Werme 11:13:38
LOL! Quite agree. You must have missed the mutant human like creature given birth to by a dog! Me, I’m stocking up on long johns.
Tom in Texas your link is dead it would be good to see this. Ed
Tom in Texas (12:26:52) :
Leif, did you really say:
“The upcoming sunspot crash could cause the Earth to cool.
http://www.newscientist.com/unpwlogin.ns
We have discussed that here before [with Ambler IIRC]. The quote is out of context [twice]. I was talking with Stuart Clark [who wrote the article] and the discussion was about if coming low solar activity would have a climate effect. My answer to him was a response to his hypothetical “If sunspots have a big effect would low solar activity mean cooling”, and the answer is clearly “yes”. The “if” has conveniently been left out [then and in later quotes]. Maybe someone could find the article back.
Hi steve and thanks for nice article!
Theres no doubt that when arctic ice have been on retreat, the new ice in the fall seems to explode in extend, probably due to heat loss from open arctic sea. Also, the nes ice is much whiter, higher albedo, than old ice, so its just no so easy to get rid of that arctic ice.
K.R Frank
Leif Svalgaard (13:05:11) :
Maybe someone could find the article back.
http://www.newscientist.com/article/mg19125691.100-global-warming-will-the-sun-come-to-our-rescue.html?full=true
This is the first time that I have encountered WUWT. After reading 100+ comments, I didn’t see anyone refer to another poster as an idiot, Nazi, etc., or insult their religion, intelligence, race, nationality or (perceived) political leanings. WHAT’S UP WITH THAT?
Is this just good moderation, or have I encountered a community of people that can think and discuss things civilly and rationally with a common goal of seeking to find out what is true?
Nah, I just saw Rod Serling off to the side, smoking a cigarette, and saying something about “For your consideration…”
-Kris
kkstewart
Anthony does not tolerate abusive behavior between posters and the community here accepts that. The team of moderators occasionally has to steer the ship back on course, but by and large, the community that exists here knows both that they should behave respectfully and see it as an advantage as well in forming a better community.
jeez aka charles the moderator
Compressed air?
pumped water hydroelectric?
batteries?
flywheels!?
LOL!
Keep dreaming – these are yet additional energy conversion stages, i.e. which lead to yet more considerable losses, on top of the already inefficient wind technology.
Why don’t you calculate how many elevated ponds, batteries, flywheels, air tanks will be needed to buffer a couple of windless days? There’s a report coming out soon that takes a look at all these systems. Conclusion: ASTRONOMICALLY INEXPENSIVE AND UNRELIABLE. (The report will be out in February, and cannot comment beyond that).
Art,
Re: “http://www.sciencedaily.com/releases/2009/01/090109115047.htm”
Is this peer reviewed? I would think this kind of PEER REVIEWED paper should become the poster child for skeptics whenever anyone throws out peer review as a defense for CAGW. The article is pure nonsense. Others have already shown major flaws that should have been caught in any reasonable peer review.
Pierre Gosselin (09:46:42) :
It just doesn’t get any better. Exxon takes subsidies to build more windmills, so that it can sell more natural gas down the road.
And don’t forget that the mandated CO2 sequestration means that the coal burners (Exxon competition) must collect the CO2 and dispose of it. This means Exxon can be subsidized in enhanced oil extraction via CO2 injection. They get PAID to enhance oil production by their competition. Gotta love it.
Steven Goddard (11:26:12) :
Where does that graph say the trend is statistically significant?
You can plot a best-fit trend line through any data- but that doesn’t mean it’s a statistically significant trend.
The error bar for the slope indicates the real trend could be positive or negative (within whatever confidence level they’re using).
It seems to me that you can’t say whether the trend is positive or negative with any confidence.
Am I missing something? Maybe one of the statistics experts can chime in here. Leif?
kkstewart (13:12:30) :
You’re welcome. 😉
Confidence breeds civility. The opposite doesn’t.
kkstewart,
The nature of the debate cannot be fully brilliant as you describe but it does pretty well. I am only interested in what you are, true scientific discovery which leads for me to positive humanitarian steps. Forewarned is forearmed. RoboMod does step in every now and then but that’s just his programming you can’t blame him for that. Most of this is truth searching, lots of it is on the way there and some of it is bizarre. Enjoy and keep solving. Ed
Pierre Gosselin (13:21:20) :
“Compressed air?
pumped water hydroelectric?
batteries?
flywheels!?
LOL!”
Au contraire, Pierre! You may not be familiar with just how this works, nor the critical importance of energy storage in a renewable (intermittent) energy world.
And yes, as an engineer, I am intimately familiar with the physics of energy conversion. As an attorney, I work with clients to further their goals of commercializing energy storage systems. Cannot comment much more on that, as that information is privileged.
But, what is in the public domain I can speak to. And yes, I would agree with you that no energy storage system can make the wind blow more or the sun shine more, so the total KWH generated will not go up. But, consider this. When the wind does blow, perhaps at night, the power generated can be stored for later use when power demand is high.
Once these systems are installed, with perhaps four or five days of energy production without wind or sun, the economics of renewables improves dramatically. There probably is an optimum number of days storage, but I don’t know anyone who has worked that out.
Energy storage systems allow the renewable generation to become a load-follower, selling power at its highest price.
I look forward to reviewing the report you refer to.
Roger E. Sowell
Marina del Rey, California
Pumped water hydro is already in widespread use.
In 2000 the United States had 19.5 GW of pumped storage capacity, accounting for 2.5% of baseload generating capacity. PHS generated (net) -5.5 GWh of energy[3] because more energy is consumed in pumping than is generated; losses occur due to water evaporation, electric turbine/pump efficiency, and friction.
In 1999 the EU had 32 GW capacity of pumped storage out of a total of 188 GW of hydropower and representing 5.5% of total electrical capacity in the EU.
I went through a simplified calculation and got some weird numbers. Please confirm this independantly before claiming that we’ve disproven Gore/Hansen. Here are the calculations…
According to the map at http://atlas.nrcan.gc.ca/site/english/maps/archives/5thedition/environment/climate/mcr4076 (Anthony, please check that the URL isn’t split) the average daily “global” radiation on a horizontal surface in the Canadian mid-arctic is between 8 and 9 megajoules. let’s call it 8.64 megajoules to make the calculation easier. Given 86,400 seconds per day, that averages out to 100 joules/second = 100 watts.
Compare that with black body heat loss. Assumption… ice and water are, for all intents and purposes, perfect black bodies. Take the Stefan-Boltzmann equation, which gives radiated energy rate in watts per square metre as ( 5.6704 / 10^8 ) * T^4 where T is temperature in degrees K. Open water at 5 C (278.12 K) radiates 339.3 watts per square metre. Ice at -20 C (253.12 K) radiates 232.8 watts per square metre. I.e. the insulating effect of ice at -20 C blocks more energy loss than energy absorbed by open water, even if water has an albedo of zero. At -40 C, which often happens in the Arctic winter, the radiation loss from ice is 167.5 watts per square metre, i.e. less than half the loss from open water at 5 C.
Counter-intuitive as it seems, a large Arctic icecap causes global warming, which will tend to melt the icecap. A reduced, or non-existant Arctic icecap causes global cooling, which tends to create/increase the Arctic icecap. Thus we have a stable system, rather than a Gore/Hansen “tipping point”. This also explains…
1) Why ice ages didn’t result in a permanent “snowball earth”.
2) Why, even when extreme conditions produced a “snowball earth”, the climate recovered and the ice went away
3) Why it was possible for an Arctic icecap to form in the first place, given that there wasn’t one during most of earth’s paleohistory.
Interesting: http://news.yahoo.com/s/afp/scienceclimatewarmingglaciersgreenland_newsmlmmd