From ICECAP
By Joseph D’Aleo CCM, AMS Fellow
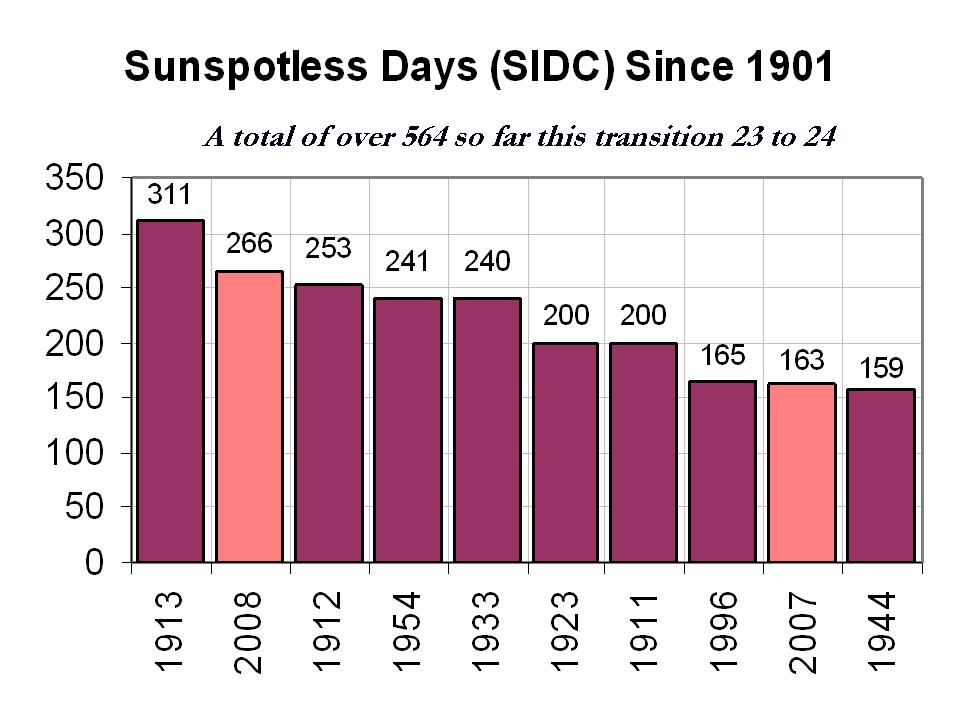
2008 will be coming to a close with yet another spotless days according to the latest solar image.

This will bring the total number of sunspotless days this month to 28 and for the year to 266, clearly enough to make 2008, the second least active solar year since 1900.

See larger image here.
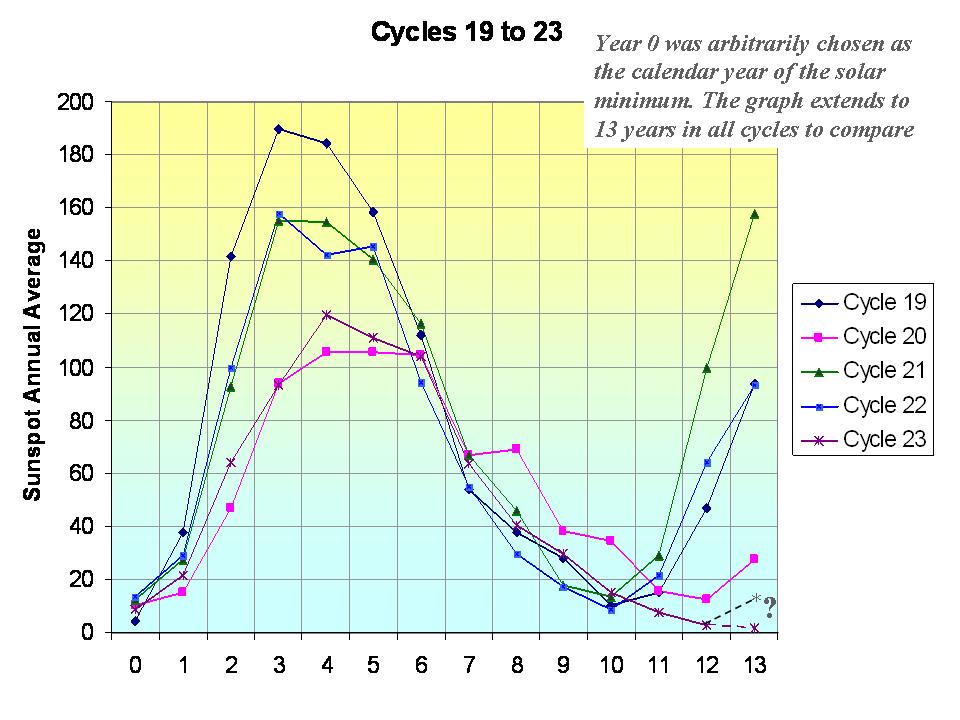
The total number of spotless days this spolar minimum is now at around 510 days since the last maximum. The earliest the minimum of the sunspot cycles can be is July 2008, which would make the cycle length 12 years 3 months, longest since cycle 9 in 1848. If the sun stays quiet for a few more months we will rival the early 1800s, the Dalton Minimum which fits with the 213 year cycle which begin with the solar minimum in the late 1790s.

See larger image here.
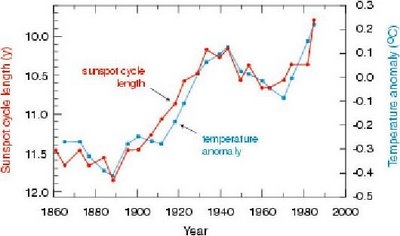
Long cycles are cold and short ones like the ones in the 1980s and 1990s are warm as this analysis by Friis-Christensen in 1991 showed clearly.

See larger image here.
In reply to the arguments made that the temperatures after 1990 no longer agreed with solar length, I point out that it was around 1990 when a major global station dropout (many rural) began which led to an exaggeration of the warming in the global temperature data bases. Also the length from max to max of 21 to 22 was 9.7 years and cycle 22 length min to min 9.8 years, both very short suggesting warm temperatures in the 1990s. The interval of cycle 22 max to cycle 23 max centered in the mid 1990s began to increase at 10.7 years and the min to min length of cycle 23 is now at least 12.3 years.
With the Wigley suggested lag of sun to temperatures of 5 years and Landscheidt suggested 8 years, a leveling of should have been favored around 2000-2003 and cooling should be showing up now. Looking ahead, put that together with the flip of the PDO in the Pacific to cold and you have alarming signals that this cooling of the last 7 years will continue and accelerate.
Phil, I see your make-believe alarmist fabricated graph, and raise with some actual data:
http://www.junkscience.com/MSU_Temps/MSUvsRSS-m.html
You misunderstood. I don’t find your data “unpalatable”, I find it’s BS.
Not surprisingly, the actual data doesn’t even resemble what you exhibited.
Geoff Sharp
“Sounds interesting. I suspect if it showed a trend it would be small, but will look into it. What I have noticed is, that its the positions of only 2 planets at the end of the day. N+U always come together the same (naturally) but its the quality of how J+S are lining up at the time that really matters.”
Yes, that’s what I was getting at but didn’t make it clear enough. I meant N+U not V+U (silly mistake), but also that it’s the J+S alignment with the suns axial tilt that may have a strong effect. See this discussion for why: (it descends into argument after page 1, but the last page is worth a look where Carl contributed some graphs.)
http://www.bautforum.com/against-mainstream/72665-explaining-planetary-alignments-relationship-sunspot-cycle.html
nobwainer (Geoff Sharp) (22:30:57) :
Hadley temp at that timescale, there is a 40 year cool period from around 1790-1830 which no doubt has some influence from eruptions….
As per your own link, there was no 40-year cool period at that time. There is cold generally until ~1920. The cold is punctuated by several pronounced decadal additional coolings. The first one coinciding with two of the largest solar cycles in the record. The second one with the major volcanic eruptions 1809-1815. The 1820s and 1830s were the warmest decades until the 1930s rolled around.
I still think your overplaying the volcano factor.
Lean and Rind [ GEOPHYSICAL RESEARCH LETTERS, VOL. 35, L18701, doi:10.1029/2008GL034864, 2008 ] find that volcanism is the largest ‘natural’ driver of climate. “[16] Natural influences produce as much as 0.2 K warming during major ENSO events, near 0.3 K cooling following large volcanic eruptions and 0.1 K warming near maxima of recent solar cycles”
10Be records are also affected by reduced solar activity.
But much more by volcanic eruptions. The best example is Krakatoa for which we have good solar data.
The Dalton was certainly no badboy in grand minima terms, but was right on schedule with its timing and modulation.
is invalid circular reasoning: it has to be this way because it fits the scheme.
It is interesting to compare the inverse albedo shape
http://www.leif.org/research/albedo.png
with the temperatures either atmoz http://atmoz.org/blog/2008/02/27/4-global-temperature-anomalies-say-the-same-thing/
or junkscience ihttp://www.junkscience.com/MSU_Temps/MSUvsRSS-m.html
I used the toy model at http://junkscience.com/Greenhouse/Earth_temp.html to turn albedo to temperature and got much greater swings in amplitude ( not surprisingly).
Normalizing on the atmoz anomaly of 2005, I get, starting from 1984, (accuracy not so hot, estimated by eye)
-1.3 C 1984
-1.46
-0.80
-0.63
-1.13
-0.47
-1.17
-0.15
-1.13
-0.01
0.44
2.69 1998
0.83
0.83
0.83
0.5
1.15
-0.96 2004
0.35 2005
It would be very interesting to see the values of albedo since 2005.
Why is there no albedo from satellites?
Tallbloke (02:52:46) :
I read that thread the other day…..the moderator needs an attitude adjustment i think, but remember it all looked a bit suss. Some people get way too lost in the detail.
Leif Svalgaard (02:57:20) :
As per your own link, there was no 40-year cool period at that time.
If you want to get pedantic about it it clearly shows a cooling from late 1770’s to late 1820’s…thats more than 40 years. But as usual we end up quibbling over ridiculous stuff. Your evidence of volcanic influence on climate is weak and I think its time for you to leave a small door open that there might be a possibility that the Sun just might influence our weather.
I have had a private email pointing that my equations
http://www.vukcevic.co.uk/combined.gif
do not work prior to 1810. For any other enthusiast before plotting the equations take note of following:
a) In the cycle periodicity equation prior 1810 the COS functions should be changed to SIN functions (see
http://www.vukcevic.co.uk/
LANL link bottom of page 1)
b) For the amplitude equation, unfortunately this was omitted in the article, so here it is: prior 1810 the COS function should be changed to SIN function, for the second factor only.
For those less enthusiastic you can see extrapolation prior to 1810 on:
http://www.vukcevic.co.uk/combined1650.gif
You notice that equations do not show zero values at time of Maunder minimum. According to Carbon14 data it is more than obvious that solar magnetic activity during Maunder minimum was proceeding as normal without large number of sunspots visible i.e. sunspot activity was suppressed to a minimum.
http://www.vukcevic.co.uk/1600-1700.gif
I believe that a regularly appearing Dalton was forced to the Maunder minimum, by a sudden change in the intensity of galactic and intergalactic cosmic rays pressure reaching the heliosphere , drastically altering relationship between strength of the heliosphere and the planetary magnetospheres, thus in turn affecting intensity of the heliospheric feedback.
Leif Svalgaard (02:57:20) :
The cold is punctuated by several pronounced decadal additional coolings. The first one coinciding with two of the largest solar cycles in the record. The second one with the major volcanic eruptions 1809-1815.
You have been around a long time…and know that there is more than one factor that controls climate. Is there PDO, AMO, NAO or ENSO records available for that era?
And you still havent shown how the almighty 10Be spike from Krakatoa affected our temperature records…the evidence is weak.
I have had a private email pointing that my equations
http://www.vukcevic.co.uk/combined.gif
do not work prior to 1810. For any other enthusiast before plotting the equations take note of following:
a) In the cycle periodicity equation prior 1810 the COS functions should be changed to SIN functions (see
http://www.vukcevic.co.uk
LANL link bottom of page 1)
b) For the amplitude equation, unfortunately this was omitted in the article, so here it is: prior 1810 the COS function should be changed to SIN function, for the second factor only.
For those less enthusiastic you can see extrapolation prior to 1810 on:
http://www.vukcevic.co.uk/combined1650.gif
You may notice that equations do not show zero values at time of Maunder minimum. According to Carbon14 data it is more than obvious that solar magnetic activity during Maunder minimum was proceeding as normal without large number of sunspots visible i.e. sunspot activity was suppressed to a minimum.
http://www.vukcevic.co.uk/1600-1700.gif
I believe that a regularly appearing Dalton minimum was forced to the Maunder minimum by sudden change in the intensity of the galactic rays pressure reaching the heliosphere , drastically altering relationship between strength of the heliosphere and the planetary magnetospheres, thus in turn affecting effectivness of the heliospheric feedback.
I came across this paper from Paul D Jose “Sun’s motions and Sunspots” from 1965 and when I googled it I got the following link:
http://www.scribd.com/doc/8684342/Jose-PD1965Suns-Motion-Sunspots-8-p
If Livingston and Penn are right and 2015 is a key date then a 180 year cycle (~8x Hale or ~2x Gleissberg) would give us the following historical dates:
2015
1835
1655
1475
1295
1115
which compare with
Dalton 1790-1830
Maunder 1645-1710
Spoerer 1420-1530
Wolf 1280-1340
Oort 1010-1050
Reasonable correlation except for Oort but then ‘Oort – Wolf’ was the time of the Medieval Max so maybe things got distorted a bit.
I know things move ahead at a pace and no doubt Leif will tell me why this cycle is irrelevant (notwithstanding the astronomy link) – but it caught my interest at least. I see nobwainer (Geoff Sharp) mentioned the cycle 179 yrs earlier as well.
Geoff and Leif
Hadley does tend to oversmooth. This is raw data and unadjusted from 1660.
http://cadenzapress.co.uk/download/mencken_hobgoblin.xls
http://cadenzapress.co.uk/download/menken_hobgoblin.jpg
The first link includes all the Hadley data and is clickable, the second is a jpeg (some people have trouble opening excel) the temperature was up and down like a yo yo in Britain during that time but from the period 1790 onwards we had our second warmest summer ever in 1826 and our eigth ever warmest in 1781-our third warmest winter was in 1833. THere was a notable cold spike around that time howecver as wqell-our coldest ever winter was 2.3 and third coldest in 1807 so you are both right!
Manyt of the years from 1770’s onwards were generally pretty warm and culimated in many whalers from our fishing villages (incluiding mine) reporting ‘unprecedented’ melting of the Arctic which after three promptings over 30 years finally caused the president of the Royal society to take notice and agree to mount an expedition to go look in 1817. Ironically that was just after the year without a summer when soot from the volcano may have caused additional warming. This phenomenen was also reported in the 1850’s and as you know some say causes arctic melt even now as brown soot blows over from China.
Volcanoes are fascinating but how much influence they have on the climate I’m not expert enough to say so I follow your debates with interest. I’m prepared to be persuaded either way!
TonyB
nobwainer (Geoff Sharp) (05:15:24) :
“As per your own link, there was no 40-year cool period at that time.”
If you want to get pedantic about it it clearly shows a cooling from late 1770’s to late 1820’s…thats more than 40 years.
The CET average for 1750-1777 [late 1770s] was 9.036C, for 1778-1828 [late 1820s] it was 9.101C, and for 1829-1860 is was 9.071C. Pedantry clearly shows that your 40-year period was warmer than the intervals before and after it. One can argue that the errors may be larger than the differences, but that cuts both ways: From the CET there is no evidence of a 40-year cooling. The same conclusion can be drawn from the Central Europe Temps at http://home.casema.nl/errenwijlens/co2/europe.htm in fact, a warming is indicated.
But as usual we end up quibbling over ridiculous stuff.
Taken the above into account, who is quibbling and how ridiculous is it? I think it is time for you to leave the quibbling behind and accept the data: The Dalton ‘minimum’ was not a time of cooling, and whatever severe cooling there was [“the year without a summer”] was largely due to volcanic eruptions.
Your evidence of volcanic influence on climate is weak and I think its time for you to leave a small door open that there might be a possibility that the Sun just might influence our weather.
The very careful analysis by Lean and Rind that I referred to summarizes the best of modern data and analysis technique and concludes:
“[16] Natural influences produce as much as 0.2 K warming during major ENSO events, near 0.3 K cooling following large volcanic eruptions and 0.1 K warming near maxima of recent solar cycles”
marking volcanoes as the largest of the natural influences.
the possibility that the Sun just might influence our weather
As I have always said, there is decent evidence at and below the 0.1K level of solar influence.
nobwainer (Geoff Sharp) (05:46:01) :
And you still havent shown how the almighty 10Be spike from Krakatoa affected our temperature records…the evidence is weak
The key to the puzzle is that the 10Be data shows that the effect lasts several years, not just one. This graph of CET and 10Be derived HMF shows this clearly: http://www.leif.org/research/CET%20and%2010Be.png
For more on volcanic forcing see pages 16-20 of http://lasp.colorado.edu/sorce/news/2008ScienceMeeting/doc/Session4/S4_03_Crowley.pdf [ignore some of the CO2 nonsense before and after the volcanism pages]. Let me repeat: Volcanic forcing is the strongest climate driver on time scales up to a decade or two. You can avoid a lot of ridiculous quibbling by acknowledging this fact right now.
I believe that we are looking at minor perturbations in the Earth’s temperature over the past century and only need to find minor perturbations in the souce – the Sun’s radiated energy.
TSI does not fluctuate more than 0.1% according to the “experts”. However, without the Sun, Earth would cool precipitously and then more gradually until all the energy in the core is radiated into space. Earth’s temperature would approach absolute zero, or -273 Kelvin (-273C). We would be a frozen cinder adrift in space.
Since Earth’s mean temp is about +14C, the Sun (with a contribution from the heat in the core) warms the Earth by 277C. A +/- 0.1% flutuation in total energy input should result in +/- .28C or about 0.5C.
So why do the “experts” consider TSI variance insignificant?
One reader pointed out that my equations for graph
http://www.vukcevic.co.uk/combined.gif
do not work prior to 1810. For any other enthusiast before plotting the equations take note of following:
a) In the cycle periodicity equation prior 1810 the COS functions should be changed to SIN functions (see http://www.vukcevic.co.uk/ LANL link bottom of page 1)
b) For the amplitude equation, unfortunately this was omitted in the article, so here it is: prior 1810 the COS function should be changed to SIN function, for the second factor only.
For those less enthusiastic you can see extrapolation prior to 1810 on:
http://www.vukcevic.co.uk/combined1650.gif
You may notice that equations do not show zero values at time of the Maunder minimum. According to Carbon14 data it is more than obvious that solar magnetic activity during Maunder minimum was proceeding as normal without large number of sunspots visible i.e. sunspot activity was suppressed to a minimum.
http://www.vukcevic.co.uk/1600-1700.gif
I believe that a regularly appearing Dalton minimum was forced into the Maunder minimum by sudden change in the intensity of galactic cosmic rays pressure reaching the heliosphere , drastically altering relationship between strength of the heliosphere and the planetary magnetospheres, thus in turn affecting effectiveness of the heliospheric feedback.
For more details on the heliospheric feedback hypothesis see: http://www.vukcevic.co.uk/
Solar Current link.
Bill Yarber (10:19:54) :
A +/- 0.1% flutuation in total energy input should result in +/- .28C or about 0.5C.
So why do the “experts” consider TSI variance insignificant?
Because of Stefan-Boltzmann’s law that says that the energy goes with the fourth power of temperature, or inversely: the temperature goes to the one-fourth power, i.e 0.1% energy gives 0.1/4 = 0.025% temperature. And 0.025% of 277K is 0.07C. And you can safely remove the quotation marks on “experts”.
nobwainer (Geoff Sharp) (05:00:41) ::
http://www.bautforum.com/against-mainstream/72665-explaining-planetary-alignments-relationship-sunspot-cycle.html
I read that thread the other day…..the moderator needs an attitude adjustment i think, but remember it all looked a bit suss. Some people get way too lost in the detail.
Sure, but I think Ray Tomes is onto something important all the same. Worth picking through his posts in that thread, and taking note of the tables of relative weightings of the planet’s, and the Fourier transformation showing the periodicities of planet pairs and their relationship to sunspot count magnitudes.
CodeTech (01:40:41) :
Phil, I see your make-believe alarmist fabricated graph, and raise with some actual data:
http://www.junkscience.com/MSU_Temps/MSUvsRSS-m.html
You misunderstood. I don’t find your data “unpalatable”, I find it’s BS.
Not surprisingly, the actual data doesn’t even resemble what you exhibited.
And of course you lose! No fabrication at all, the same data used in each case.
Try looking at the direct comparison of the two graphs below, time for you to visit the opthalmologist I think.
http://i302.photobucket.com/albums/nn107/Sprintstar400/CompT.jpg
REPLY: Those graphs don’t have the same vertical scale, so the “opthamologist” (eyeball) comparison is invalid due to the scale difference, which makes one appear to have a steeper rate of trend with time than the other. Magnification effects of scale can be misleading. But that happens on both sides of the debate.- Anthony
“Natural influences produce as much as 0.2 K warming during major ENSO events, near 0.3 K cooling following large volcanic eruptions and 0.1 K warming near maxima of recent solar cycles”
marking volcanoes as the largest of the natural influences.”
Leif, I tried to post this for you on your CA solar blog but had an image problem. This graph appears to show a roughly 0.2K solar signal in the temperature data. Please would you comment?
http://www.woodfortrees.org/plot/hadsst2gl/from:1950/mean:43/detrend:0.5/offset:0.6/plot/sidc-ssn/from:1950/scale:0.0015/mean:12
PaulHClark (06:34:59) :
It is a 210 year cycle that is pronounced.
there is a 100 year also. plus the normal 11,22,33,55- LOL oh ya and to add pdo 60-66?
I say it is some kind of magnetic or cosmic ray influence
these are not what you might like to be “exact” but 11-55 year cycles can be added or subtracted and it gets very close to a match.
1790+210 2000
1835
1655 1645+210 1855
1475 1420+210 1630
1295
1115
which compare with
Dalton 1790-1830
Maunder 1645-1710
Spoerer 1420-1530
Wolf 1280-1340
Oort 1010-1050
the thing is that there is so much interference (noise)
let’s make a list: AO,AMO,PDO,geological ,meteorite dust, planet wobble, deforestation, reforestation, Albeitrio , H2O GHG, oceanic flywheel.
This list is why AGW peps will never find a consensus.
What realy is a worry is the 11000 year cycle that we are at the limit right now.
we have at most a 3000year leeway.
vukcevic (10:31:57) :
I believe that a regularly appearing Dalton minimum was forced into the Maunder minimum by sudden change in the intensity of galactic cosmic rays pressure reaching the heliosphere
The 10Be record [see Figure on page 2 of http://www.leif.org/research/TSI%20From%20McCracken%20HMF.pdf shows that the galactic ray intensity during the Maunder minimum [1645-1690] was not substantially different from, say, 1900-1940. The sharp change in the 10Be precipitation around 1700 was most likely largely due to strong volcanism at that time. You may counter that McCracken’s reconstruction is faulty [and it is, but in a way that does not affect the conclusion] and that you believe in your speculation so strongly that that trumps what meager and uncertain data we have. If so, you are not alone.
Opps 110,000 +/- 11,000 LOL
http://www.warwickhughes.com/agri/Solar_Arch_NY_Mar2_08.pdf
do not read this unless you have a strong constitution LOL
uhm pg. 7
anna v (13:53:52) :
had this link up first.
David Archibald’s paper.
Tallbloke (11:49:06) :
This graph appears to show a roughly 0.2K solar signal in the temperature data. Please would you comment?
You don’t do this by eyeballing. One does this by detrending [if you like – it makes the correlation better 🙂 ], then making a scatter plot of dT versus SSN, then fitting a least squares line to the points. the slope of the line times the average sunspot maximum will be the approximate response to solar activity. Try it. Lean and Rind did essentially that but at the same time also took into account all the other known factors and used a much longer time base. Why did you start only in 1950, the data goes back a century before that?
“You don’t do this by eyeballing. One does this by detrending [if you like – it makes the correlation better 🙂 ], then making a scatter plot of dT versus SSN, then fitting a least squares line to the points. the slope of the line times the average sunspot maximum will be the approximate response to solar activity. Try it. Lean and Rind did essentially that but at the same time also took into account all the other known factors and used a much longer time base. Why did you start only in 1950, the data goes back a century before that?”
Thanks Leif, I knew there would be a proper way to do it. 🙂
I started in 1950 because the detrending facility on the woodfortrees site won’t cope with compound curves too well. It’s just an example, but I’ve tried other periods where the dT trend goes one way with similar results.
When you say Lean and Rind ‘took into account all known factors’ do you mean they removed known feedbacks to try to isolate the resultant temperature change due solely to TSI fluctuation over the solar cycle? If so, what are the other factors they were able to quantify?
Tim L (11:57:39) :
PaulHClark (06:34:59) :
It is a 210 year cycle that is pronounced.
I say it is some kind of magnetic or cosmic ray influence
Dalton 1790-1830
Maunder 1645-1710
Spoerer 1420-1530
Wolf 1280-1340
Oort 1010-1050
If look at
http://www.vukcevic.co.uk/GrandMinima.gif
you can see that the periodicity equation ( with 3 phase change of 90 degrees each, as mentioned in my previous post, at 1810, 1560, 1310 i.e. every 250 years) extrapolated for period 1000 – 2100, it does correctly indentifies beginning of all of the grand minima.
for more details see:http://www.vukcevic.co.uk solar current link
Svalgaard (12:12:11) :
The 10Be record [see Figure on page 2 of http://www.leif.org/research/TSI%20From%20McCracken%20HMF.pdf shows that the galactic ray intensity during the Maunder minimum [1645-1690] was not substantially different from, say, 1900-1940.
Dr. Svalgaard
In my conception of heliosphere (which may be wrong) that is not possible to prove. If heliosphere is exposed to greater GCR pressure it will contract, the gradient of intensity of the internal heliospheric magnetic field will increase proportionaly; hence greater resistance to the GCR penetration: result no change in the count.
By the way thanks for looking at the website. I hope it is a bit warmer in Petaluma than in London, just now we could do with a bit of global warming.
Ellie in Belfast, TonyB: Reconstructed SST data is available from 1850 to present. For many portions of the globe, the data becomes questionable as you go back in time due the minimal number of samples. Example: Areas such as the equatorial Pacific weren’t traveled regularly before the opening of the Panama Canal in the early 1910s. So how reliable is the NINO3.4 data prior to then? I believe they’ve caught the trends and the major events from 1850 to 1910. The accuracy improves afterwards.
People have looked for correlations between solar and SST indices for decades, and they’ll keep looking. But most don’t understand that the ENSO cycle only gives up a portion of its heat during El Nino events; the rest is recycled.
http://bobtisdale.blogspot.com/2008/11/recharging-pacific-warm-pool.html
So how does one isolate and differentiate between new and recycled warm water collecting in the Pacific Warm Pool for the next ENSO event? And how much of an El Nino was suppressed by the volcanic eruption that also occurred then? The example most often cited is the 1982 El Nino and the El Chichon eruption, but the Mount Pinatubo eruption severely dampened a multiyear ENSO event at that time. (And right after the Mount Pinatubo aerosols subside, Arctic temps skyrocket. I’m working on a post on just that subject.)
Tony, PDO data is available from 1900 to present here:
http://jisao.washington.edu/pdo/
Most people don’t understand what the PDO represents. It’s not SST. It’s also not a simple SST residual.
http://bobtisdale.blogspot.com/2008/06/common-misunderstanding-about-pdo.html
Is the PDO an aftereffect of ENSO? The curves of the raw data are very similar. Sometimes the NINO3.4 data leads the PDO and at other times the PDO leads:
http://bobtisdale.blogspot.com/2008/06/chicken-or-egg-pdo-or-enso.html
Check out the link to the paper at the end of that post. It says that the PDO is dependent on ENSO, not vice versa as most people understand.
Long-term (1871-2007) NINO3.4 SST anomaly data is available here:
ftp://ftp.cgd.ucar.edu/pub/CAS/TNI_N34/Nino34.1871.2007.txt
Or you can create your own SST data sets through the NOAA NOMADS system. Instructions:
http://www.ncdc.noaa.gov/oa/climate/research/sst/ERSST-ts.txt
NOMADS website:
http://nomads.ncdc.noaa.gov/#climatencdc
Or, if you want to look at tons of graphs of SST subsets and read my dry interpretation of the data, I’ve done 60+ posts so far:
http://bobtisdale.blogspot.com/2008/06/smith-and-reynolds-sst-posts.html
In most of those posts, not all, I’ve suppressed my AGW skepticism and simply reported what I’ve seen.
Regards