From ICECAP
By Joseph D’Aleo CCM, AMS Fellow
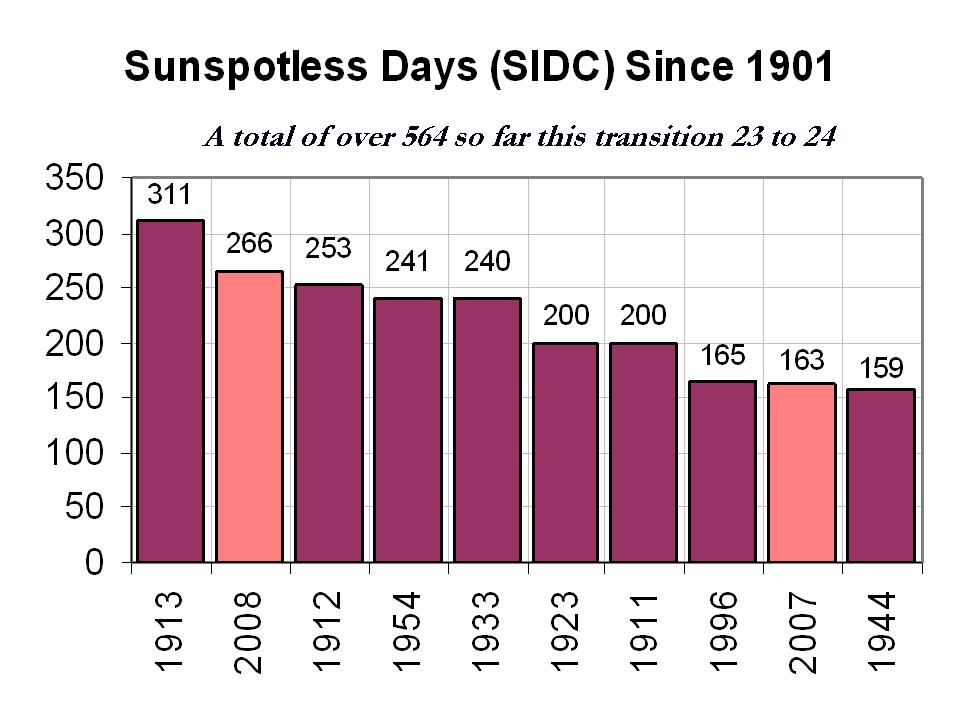
2008 will be coming to a close with yet another spotless days according to the latest solar image.

This will bring the total number of sunspotless days this month to 28 and for the year to 266, clearly enough to make 2008, the second least active solar year since 1900.

See larger image here.
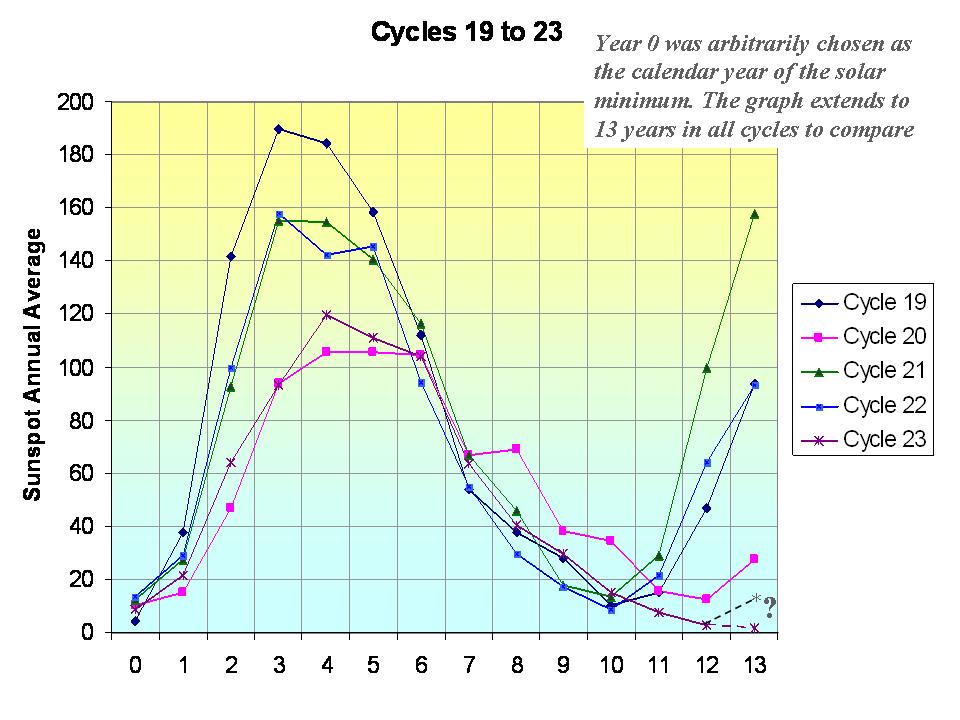
The total number of spotless days this spolar minimum is now at around 510 days since the last maximum. The earliest the minimum of the sunspot cycles can be is July 2008, which would make the cycle length 12 years 3 months, longest since cycle 9 in 1848. If the sun stays quiet for a few more months we will rival the early 1800s, the Dalton Minimum which fits with the 213 year cycle which begin with the solar minimum in the late 1790s.

See larger image here.
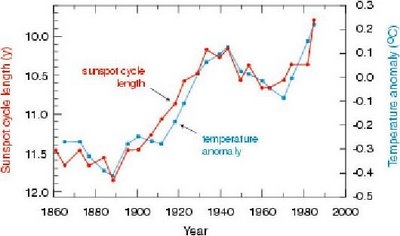
Long cycles are cold and short ones like the ones in the 1980s and 1990s are warm as this analysis by Friis-Christensen in 1991 showed clearly.

See larger image here.
In reply to the arguments made that the temperatures after 1990 no longer agreed with solar length, I point out that it was around 1990 when a major global station dropout (many rural) began which led to an exaggeration of the warming in the global temperature data bases. Also the length from max to max of 21 to 22 was 9.7 years and cycle 22 length min to min 9.8 years, both very short suggesting warm temperatures in the 1990s. The interval of cycle 22 max to cycle 23 max centered in the mid 1990s began to increase at 10.7 years and the min to min length of cycle 23 is now at least 12.3 years.
With the Wigley suggested lag of sun to temperatures of 5 years and Landscheidt suggested 8 years, a leveling of should have been favored around 2000-2003 and cooling should be showing up now. Looking ahead, put that together with the flip of the PDO in the Pacific to cold and you have alarming signals that this cooling of the last 7 years will continue and accelerate.
“what was the response from Friis-Christensen to this questioning of their methodology and conclusions?”
One at least from 2004:
http://www.spacecenter.dk/research/sun-climate/Scientific%20work%20and%20publications/comment%20to%20EOS_28_Sept_04.pdf
DAV:
The name Stephen Schneider sounded familiar. Thanks for jogging my memory with that memorable quote.
Is it the same Steven Schneider, Phil.?
James Hastings-Trew (11:40:06) :
Phil:
I wonder if there are any graphs comparing suns cycle length and “global temperature” (whatever that is) that go past the year 2000? I always find it suspicious when I am being presented with a graph that proves a point one way or another when it conspicuously omits current or recent data.
It’s difficult to write a paper in 2004 including data for the cycle length of the current cycle which had not yet ended!
Jeff Id (11:39:10) :
Phil,
While the original may contain errors, I really don’t have the experience with this yet, the link you reference uses temp curves from Mann98 as well as references to papers by Mann 99.
Which has nothing to do with the point in question, that the graph shown by D’Aleo from 91 had already been corrected by the authors in 95 and even that graph still had errors. I’m sure that Leif could supply a correct curve?
Phil:
I can’t remember the last time I read such a biased and politicised article as that you link to. What the hell is a filtered cycle length?
Question:
Is there a lag between Solar Irradience/spotless days/ other factors and the mean temperature on earth?
Or, to restate the question: Does it take several years or months for the earth to lose the energy that is stored in heat sinks, and once that energy is depleted, would lower mean temperature result because of lower irradience and sunspots?
I am trying to phrase the question well enough for others understand my question, but I feel I may not be successful.
thanks
Mark my words, Al and his buddies will explain this cooling due to the economic slowdown ( ie. factories producing less CO 2 etc. ) in the world over the last couple of months and actually this slowdown started around the beginning of 2007. Thus AGW is alive and well still. Yes , idiots will believe him or should I say the mainstream media.
Brent in Calgary
Dav,
It’s hilarious that Schneider defended what he said by claiming that *all* scientists face the same “dilemma”, or in his words, a “bind”, and morphed his original statement of “need” to “forced to do media clips”. While at the same time being “unusually forthright”, no less:
http://stephenschneider.stanford.edu/Publications/PDF_Papers/DetroitNews.pdf
“On the one hand, as scientists we are ethically bound to the scientific method, in effect promising to tell the truth, the whole truth, and nothing but – which means that we must include all doubts, the caveats,
the ifs, ands and buts. On the other hand, we are not just scientists but human beings as well. And like most people we’d like to see the world a better place, which in this context translates into our working to
reduce the risk of potentially disastrous climate change. To do that we need to get some broad based support, to capture the public’s imagination. That, of course, means getting loads of media coverage. So we have to offer up scary scenarios, make simplified, dramatic statements, and make little mention of any doubts we might have. This “double ethical bind” we frequently find ourselves in cannot be solved by any formula. Each of us has to decide what the right balance is between being effective and being honest. Ihope that means being both.”
“It is strange that The News should accuse me of trying to hide scientific uncertainty through this quote, when by the very nature of explaining the dilemma I am being unusually forthright in trying to show how
all scientists face a bind when forced to communicate in short sound bites in the media what the essence of a controversial complex problem is.”
I’d like to hear Leif’s comments on this paper…
The best part of all of this is the sun is cooperating on testing solar cycle hypothesis. We have an anomalously long cycle which should lead to cooling according to the hypothesis (potentially quantifiable – Hathway I believe is calling for a 2.1 deg C decrease, if I recall correctly). We need testable hypotheses to move climate science ahead. Of course, those with purely political agendas will never acknowledge this, but the public will recognize what’s going on (via observable changes in the weather) & those with purely scientific agendas will be shown to the credible sources of information.
“It’s so cold that Al Gore is burning tires to keep warm”
~Larry The Cable Guy
http://www.cookevilleweatherguy.com
The plot of solar cycle length versus temperature from
Length of the Solar Cycle: An Indicator of Solar Activity Closely Associated with Climate
E. FRIIS-CHRISTENSEN 1 and K. LASSEN 1
is very interesting.
However, how does this correlation plot look up to 2008 inclusive? Is it available?
Logan, Glenn,
Thank you.
Man I love this site. 🙂
Glenn (12:38:09) : *all* scientists face the same “dilemma”, or in his words, a “bind” … While at the same time being “unusually forthright”, no less:
Ah, yes! The old “Honestly, I’m a liar!” trick! The only “bind” is determining when he is and when he is not.
Hastings-Trew
You might read up on Cosmoclimatology developed by Henrik Svensmark.
Roughly, Svensmark’s thesis is that sunspots modulate the earth’s magnetic field which affects the cosmic rays that get through, which change the nucleation rate of clouds which affects the Total Solar Irradiance that is reflected vs absorbed.
Intro:
A brief summary of cosmoclimatology Danish National Space Center
Detailed paper:
‘Cosmoclimatology: a new theory emerges’, Henrik Svensmark, Astronomy & Geophysics, Vol. 48, Issue 1, pages 1.18-1.24, February 2007
Phil,
You said
“Which has nothing to do with the point in question,”
You are right, but if these people who found the math error can’t see the simple rubbish in Mann how can I trust them. BTW, I don’t disagree with your link as I don’t know the data. I just was hoping for a better source.
Diatribe guy
You have great web page. You have obviously done a lot of excellent research.
I found the ENSO INEX also useful http://www.cpc.ncep.noaa.gov/products/analysis_monitoring/ensostuff/ensoyears.shtml
You will note that 18 of the last 33 years had an El Nino of at least 2 months or more . 15 had an El nino of 3 months or more . Record temperatures can clearly be seen with prominent El Ninos and cooling during La Ninas.
Glad to be reminded of that quote from Schneider. Lovely!
Have we got any logicians around the place that can deconstruct that for us? If I read it right: We are scientists and therefore we have to be honest and include all the doubts in what we publish but even if we have doubts global warming is so important that we don’t need to include them on this subject.
But if you have doubts surely there is a possibility that global warming is less important than you are trying to claim and therefore you ought to include your doubts in the published literature.
Or am I being naive, here?
Phil
When citing critics, recommend that you also include the reply of those criticized. Following up on Glen’s post, see:
Comments on the Forum article : ”Patterns of Strange Errors Plagues Solar Activity an Terrestrial Climate Data, by P. E. Damon and P. Laut E. Friis-Christensen and Henrik Svensmark
Danish Space Research Institute, Juliane Maries Vej 30, DK-2100 Copenhagen Ø, Denmark
Comments on Peter Laut’s paper: Solar Activity and terrestrial climate: an analysis of some purported correlations, Journal of Atmospheric and Solar-Terrestrial Physics 65 (2003) 801-812
Phil: “It’s difficult to write a paper in 2004 including data for the cycle length of the current cycle which had not yet ended!”
What *data* did they include of the then current cycle? Explain this statement of yours. Did you read the original? Do you consider the results of techniques such as “filtering”, “smoothing”, “adjusting” as “data”?
http://www.friendsofscience.org/assets/files/documents/Solar%20Cycle%20-%20Friis-Chr_Lassen-.pdf
This is a NASA meeting from earlier this month. What amazes me in this is that Hathaway’s TSI number is a change from max to min of 2W/m2(page 5). And if you look at the overall trend in sun spotpage 25) number it trends are very similar (overall) to GISS trends from 1880, if you look since the MM it fits proxy trends well too. I am not saying that it matches GISS bump for bump just the trend. Then match this trend to CO2 and again it is close but CO2 lags. I think what we see is that the oceans act like a battery and charge up over time from the sun, after all the sun is the input of energy into the system and the argument is how much it varies. Then release the energy into the system as climate. Oscillation will occur and you get the PDO and AMO, while simplistic it does make you think. Many parts of the atmosphere are related and there has been an observed link between the ionosphere and the troposphere, the upper troposphere and lower stratosphere. The sun does effect the upper to layers and varies with the solar cycle.
NASA Meeting
http://sprg.ssl.berkeley.edu/RHESSI/napa2008/talks/MonI_Hathaway.pdf
Ionosphere
http://www-star.stanford.edu/~vlf/palmer/palmer.htm
http://www.pnas.org/content/94/20/10512.full
http://www.berkeley.edu/news/media/releases/2006/09/14_weather.shtml
Further to Friis-Christensen 1991 paper see:
The cause-and-effect relationship of solar cycle length and the Northern Hemisphere air surface temperature
The cause-and-effect relationship of solar cycle length and the Northern Hemisphere air surface temperature Richard Reichel, Peter Thejll, Knud Lassen
apparently the Church of England has invested 250 million quid in the AGW Al Gore rhythm, Is Al Bore the next Benny Madoff?
For variety, here is a 2007 paper claiming the opposite:
Recent oppositely directed trends in solar climate forcings and the global mean surface air temperature
MIKE LOCKWOOD, CLAUS FROHLICH
However, they make no mention of the Pacific Decadal Oscillations etc. which may invalidate their conclusions.
‘And like most people we’d like to see the world a better place…’
So did Lenin.
Getting back to the C of E, a once noble institution which is now on its deathbed–death by anemia– if they sign on to something, it’s the Titanic redivivue.