From ICECAP
By Joseph D’Aleo CCM, AMS Fellow
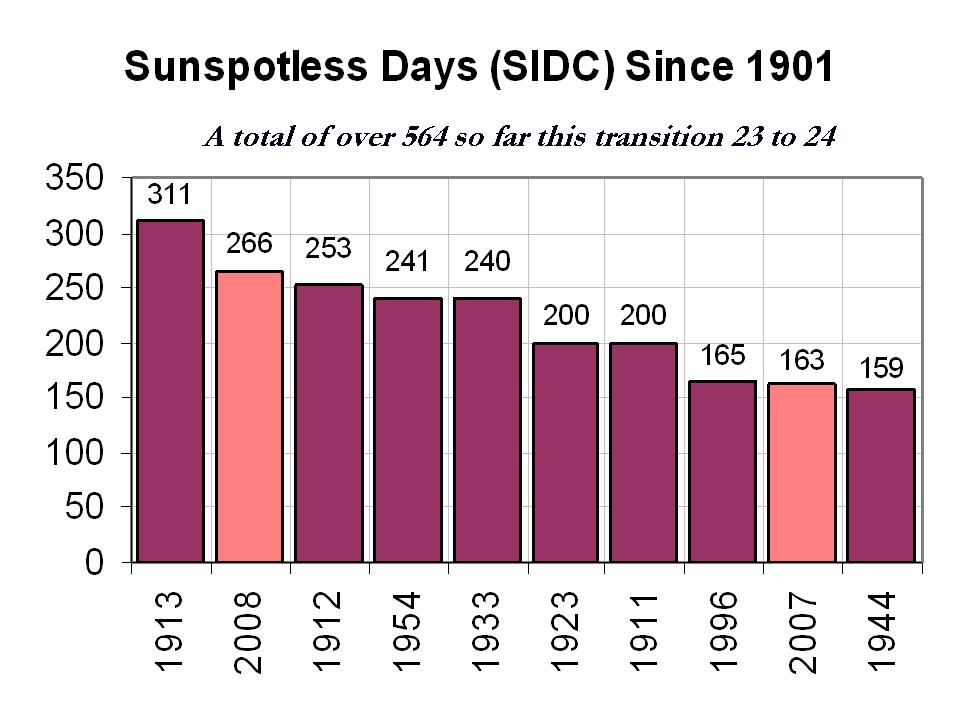
2008 will be coming to a close with yet another spotless days according to the latest solar image.

This will bring the total number of sunspotless days this month to 28 and for the year to 266, clearly enough to make 2008, the second least active solar year since 1900.

See larger image here.
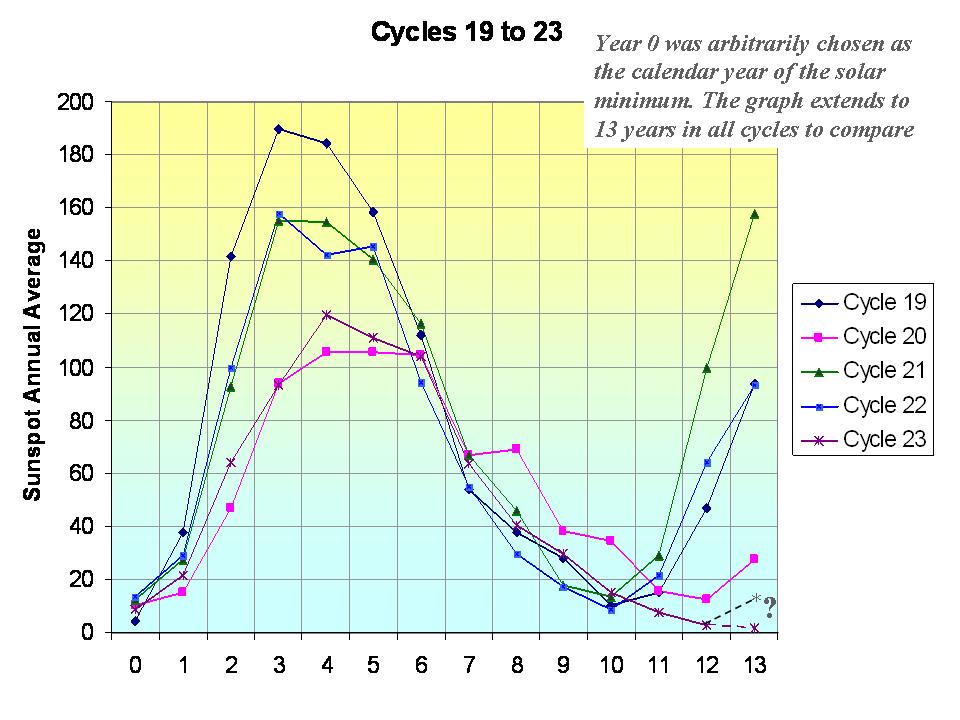
The total number of spotless days this spolar minimum is now at around 510 days since the last maximum. The earliest the minimum of the sunspot cycles can be is July 2008, which would make the cycle length 12 years 3 months, longest since cycle 9 in 1848. If the sun stays quiet for a few more months we will rival the early 1800s, the Dalton Minimum which fits with the 213 year cycle which begin with the solar minimum in the late 1790s.

See larger image here.
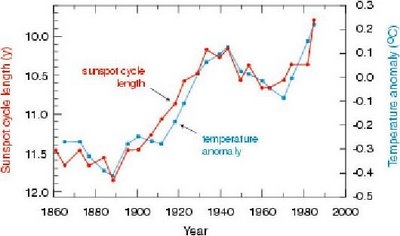
Long cycles are cold and short ones like the ones in the 1980s and 1990s are warm as this analysis by Friis-Christensen in 1991 showed clearly.

See larger image here.
In reply to the arguments made that the temperatures after 1990 no longer agreed with solar length, I point out that it was around 1990 when a major global station dropout (many rural) began which led to an exaggeration of the warming in the global temperature data bases. Also the length from max to max of 21 to 22 was 9.7 years and cycle 22 length min to min 9.8 years, both very short suggesting warm temperatures in the 1990s. The interval of cycle 22 max to cycle 23 max centered in the mid 1990s began to increase at 10.7 years and the min to min length of cycle 23 is now at least 12.3 years.
With the Wigley suggested lag of sun to temperatures of 5 years and Landscheidt suggested 8 years, a leveling of should have been favored around 2000-2003 and cooling should be showing up now. Looking ahead, put that together with the flip of the PDO in the Pacific to cold and you have alarming signals that this cooling of the last 7 years will continue and accelerate.
Tallbloke (13:24:55) :
When you say Lean and Rind ‘took into account all known factors’ do you mean they removed known feedbacks to try to isolate the resultant temperature change due solely to TSI fluctuation over the solar cycle? If so, what are the other factors they were able to quantify?
The works. Read it for yourself here: http://www.leif.org/research/LeanRindCauses.pdf
vukcevic (13:42:26) :
In my conception of heliosphere (which may be wrong) that is not possible to prove. If heliosphere is exposed to greater GCR pressure it will contract, the gradient of intensity of the internal heliospheric magnetic field will increase proportionaly; hence greater resistance to the GCR penetration: result no change in the count.
Because the solar wind is supersonic, magnetic changes cannot propagate upstream [as we have discussed many times]. The modulation of cosmic rays does not depend on the ‘gradient’ [which by the way falls off at a fixed power of solar distance (second for radial component, first for azimuthal component), independent of the size of the heliosphere] and but on the number of interaction regions and CMEs. The former increases as the size of the heliosphere increases [a new one added for each rotation of the Sun], so a larger GCR pressure will mean fewer interaction regions and a higher GCR count.
Leif Svalgaard (12:12:11)
The modulation of cosmic rays does not depend on the ‘gradient’ [which by the way falls off at a fixed power of solar distance (second for radial component, first for azimuthal component), independent of the size of the heliosphere] and but on the number of interaction regions and CMEs.
I have to think a bit about that one. For the moment I think of the heliosphere as a balloon where internal pressure (with a falling away gradient) which is maintained by solar wind, against outside pressure of GCR. Possibly wrong, but it suits my way of seeing larger picture.
I wonder what you make of :
http://www.vukcevic.co.uk/GrandMinima.gif
……….and that you believe in your speculation so strongly that that trumps what meager and uncertain data we have. If so, you are not alone.
My confidence in my hypothetical speculations is inferior to the strength of scepticism of others. It is only a diversion from a daily routine and a quasi-intellectual exercise, sort of ‘brain aerobics’.
People have looked for correlations between solar and SST indices for decades, and they’ll keep looking. But most don’t understand that the ENSO cycle only gives up a portion of its heat during El Nino events; the rest is recycled.
Bob, Im sure you are right, I had to detrend the graph below by a factor of 0.5 to get a match between solar cycles and SST’s by a factor of 0.5.
http://www.woodfortrees.org/plot/hadsst2gl/from:1950/mean:43/detrend:0.5/offset:0.6/plot/sidc-ssn/from:1950/scale:0.0015/mean:12
My question to you is whether you believe the ocean managed to store more heat over the strong cycles postwar than in previous warming decades, and whether this fully accounts for the increased anomaly and the ’98 0.2K ‘step change’ following the El Nino. I have a feeling that the step change marks something else coming into the equation, like loss of ionospheric mass, or some electromagnetic factor we don’t know about yet.
Thoughts?
Leif Svalgaard (10:14:59) :
The very careful analysis by Lean and Rind that I referred to summarizes the best of modern data and analysis technique and concludes:
“[16] Natural influences produce as much as 0.2 K warming during major ENSO events, near 0.3 K cooling following large volcanic eruptions and 0.1 K warming near maxima of recent solar cycles”
marking volcanoes as the largest of the natural influences.
This is where your argument falls down. The outcomes of this reort are not repeated in any volcanic eruption after 1880. Here is a GISS graph blown up so we can see the effects clearly showing temp change straight after Krakatoa which had a very large sulfur dioxide content. No .3K reduction, in fact it would be hard to prove Krakatoa had any effect at all and if that small (less than .1K) dip is Krakatoa it didnt last longer than a couple of years and the temp rises quickly in 1885-6….the evidence remains weak.
http://users.beagle.com.au/geoffsharp/krakgiss.jpg
I am re-posting this from earlier because I am interested in why Hathaway shows a 2W/m2 difference in TSI from max to min on SC23? And the trends do fit fairly well but nothing is perfect.
This is a NASA meeting from earlier this month. What amazes me in this is that Hathaway’s TSI number is a change from max to min of 2W/m2(page 5). And if you look at the overall trend in sun spot(page 25) number it trends are very similar (overall) to GISS trends from 1880, if you look since the MM it fits proxy trends well too. I am not saying that it matches GISS bump for bump just the trend. Then match this trend to CO2 and again it is close but CO2 lags. I think what we see is that the oceans act like a battery and charge up over time from the sun, after all the sun is the input of energy into the system and the argument is how much it varies. Then release the energy into the system as climate. Oscillation will occur and you get the PDO and AMO, while simplistic it does make you think. Many parts of the atmosphere are related and there has been an observed link between the ionosphere and the troposphere, the upper troposphere and lower stratosphere. The sun does effect the upper to layers and varies with the solar cycle.
NASA Meeting
http://sprg.ssl.berkeley.edu/RHESSI/napa2008/talks/MonI_Hathaway.pdf
Ionosphere
http://www-star.stanford.edu/~vlf/palmer/palmer.htm
http://www.pnas.org/content/94/20/10512.full
http://www.berkeley.edu/news/media/releases/2006/09/14_weather.shtml
PaulHClark (06:34:59) :
I know things move ahead at a pace and no doubt Leif will tell me why this cycle is irrelevant (notwithstanding the astronomy link) – but it caught my interest at least. I see nobwainer (Geoff Sharp) mentioned the cycle 179 yrs earlier as well.
The 179 year cycle is just a guide, according to my theory there is a window of opportunity every 179 yrs but Jupiter and Saturn alignment control the intensity at the time. The J+S alignment strength lines up perfectly (timing and modulation) with every minima after the MWP. During the MWP J+S go thru a transition stage (very weak alignments). The Oort Min was caused by another pattern (N+U with J+S op). Its a bit hard to get across here…full report here if your interested.
http://landscheidt.auditblogs.com/archives/58
Svalgaard (12:12:11) :
the galactic ray intensity during the Maunder minimum [1645-1690] was not substantially different from, say, 1900-1940.
I was about to give it up for the day, when I remember your old country compatriot Tycho Brahe (my secondary geography teacher use to go on about him) in 1572 observed supernova explosion, and we know now that it is 7500 light-years from Earth. Since it is believed that most galactic cosmic rays derive their energy from supernova explosions, and if I assume high energy GCR travel at 99% of speed of light, it will take another 75 years (around 1650 start of Maunder) to reach the heliosphere.
TonyB (09:16:33) ;
Thanks for the data links – useful . Glad you mentioned it is raw CET.
I tried uploading my excel files on personal space in google.com (my first forray into any public file sharing) but graphs were not supported, nor MS2007. I have pasted the significant graphs (so far) into a webpage (link below). It has a sort of running explanation of what I was trying to do.
http://docs.google.com/Doc?id=dgxfh8sf_0fgg6rjqz
I usually manage to make silly mistakes when posting here (late by the time I get peace to get on to WUWT), so don’t expect too much. I did get what I hoped for that in there was no significant cooling – in fact UK temperatures warmed slightly during the Dalton Minimum. This is good for me scoring a point locally pro scepticism, but I am now hooked on further analysis.
Leif, Tambora shows up well (1816 – the year without a summer), but I’ll look for other volcanic influences.
Bob Tisdale (14:31:47) : I have looked at several of your posts, also in the last few months. Very interesting; doing my best to understand it better.
Bob Tisdale
Thanks for your great info which I will work my way through.
TonyB
Phil. (11:26:02) :
CodeTech (01:40:41) :
Phil, I see your make-believe alarmist fabricated graph, and raise with some actual data:
http://www.junkscience.com/MSU_Temps/MSUvsRSS-m.html
You misunderstood. I don’t find your data “unpalatable”, I find it’s BS.
Not surprisingly, the actual data doesn’t even resemble what you exhibited.
And of course you lose! No fabrication at all, the same data used in each case.
Try looking at the direct comparison of the two graphs below, time for you to visit the opthalmologist I think.
http://i302.photobucket.com/albums/nn107/Sprintstar400/CompT.jpg
REPLY: Those graphs don’t have the same vertical scale, so the “opthamologist” (eyeball) comparison is invalid due to the scale difference, which makes one appear to have a steeper rate of trend with time than the other. Magnification effects of scale can be misleading. But that happens on both sides of the debate.- Anthony
I disagree, my posting was to counter the accusation that the data I posted was fabricated, even with the small change in vertical scale it should be apparent to all but the most optically challenged that the MSU data in each graph is the same. For those I’ve rescaled the graph!
http://i302.photobucket.com/albums/nn107/Sprintstar400/CompT-1.jpg
nobwainer (Geoff Sharp) (15:56:57) :
No .3K reduction, in fact it would be hard to prove Krakatoa had any effect at all
The effect of Krakatoa lasted a full decade after 1883 as shown so nicely in your graph, and also in my graph and the 10Be data: http://www.leif.org/research/CET%20and%2010Be.png
vukcevic (16:17:11) :
If I assume high energy GCR travel at 99% of speed of light, it will take another 75 years (around 1650 start of Maunder) to reach the heliosphere.
Cosmic rays do not travel in straight lines, they are bend and twisted by the galactic magnetic field to the extent that we cannot see where they are coming from. It may be a million years before we see any from Tyge Brahe’s supernova.
Tallbloke: The oceans should have stored more energy with the increase in TSI since SC20 and, going back further in time, since SC14, but I can’t answer your question if it can account for ALL of the increases in SST anomalies. Changes in cloud cover would have an impact, as would the variations in volcanic aerosols.
I did post a video recently about the change in global SST and global temperature since the 1997/98 El Nino. It uses a JPL SSH animation in addition to graphs. It’s about 5 minutes long.
http://bobtisdale.blogspot.com/2008/12/lingering-effects-of-199798-el-nino.html
What I’m looking for is a high-resolution animation of Global SST or SSH since the 1970s. JPL has them as far back as 1992. With everything else I’ve found or created using the NOAA websites in earlier times, the resolution doesn’t work out.
Give me a day or two for a post that might help answer the rest of your question. I’ve segmented high latitude Northern Hemisphere TLT data (MSU AHU) and compared it to NINO3.4 and Sato Index data. ENSO and volcanic aerosols are known to cause changes in global and Arctic temperature and the correlations are quite good. The impacts on high latitude North America and North Atlantic are much greater than on Europe and Asia for example. Things you might expect. The preliminary graphs are done, but as I write a post, there’s always something that I think of that would help illustrate an effect better or emphasize a point.
Regards
Jim Arndt (16:02:02) :
I am re-posting this from earlier because I am interested in why Hathaway shows a 2W/m2 difference in TSI from max to min on SC23? And the trends do fit fairly well but nothing is perfect.
This is a NASA meeting from earlier this month. What amazes me in this is that Hathaway’s TSI number is a change from max to min of 2W/m2(page 5).
I was at that meeting [gave the talk just after Hathaway’s]. The change from min to max is about 1.3 W/m2 or 0.1%. The very low recent minimum values are likely due to a drift of the calibration of the instruments used for the PMOD composite. Here is the difference between PMD and the better calibrated SORCE [TIM] TSI series: http://www.leif.org/research/Diff-PMOD-SORCE.png . You can see it is steadily dropping. This is not a solar effect.
Many parts of the atmosphere are related and there has been an observed link between the ionosphere and the troposphere, the upper troposphere and lower stratosphere. The sun does effect the upper to layers and varies with the solar cycle.
The effects you link to [and many others] go in the other direction: the weather [thunderstorms etc] influencing the ionosphere.
Fred from Canuckistan . . . (14:37:29) :
Maybe we should start a contest to come up with a name for the expected deep freeze . . . . a la the Maunder Minimum.
The solar state gets one name, while the cold climate gets another, so…
The solar minimum ought to be the Landscheidt Minimum since he first predicted it… however the cold period I think ought to be:
The AlGore Cold Period to remind the world for all time about folly…
(Though I could be talked into the Hansen Cold Period…)
I have enjoyed reading the many thoughts on this thread. Tim L, GSharp, Vukcevic thanks for the pointers.
I was doing a little more to develop my understanding of the Gleissberg Cycle and came across this interesting paper which has some predictions that look to be coming to fruition.
http://virtualacademia.com/pdf/cli267_293.pdf
Bob Tisdale – I always enjoy reading your posts but I need to catch up on all you produce – the paper above seems to indicate a strong correlation to SST with the Gleissberg cycle – I think you have hinted at such a connection yourself – I thought you might be interested.
Interestingly we are at a minimum of the Gleissberg cycle now.
Michael S (17:21:31) :
To the solar experts –
I’m not an expert, but I can point you at some information on one of the wavelengths. UV. It creates (therefor modulates) the ozone in the upper atmosphere. It also drops more during sun cool periods. Why does ozone matter? Look under the ‘resources’ tab up top and look for ozone in the comments.
The short form is that O3 blocks the 9-10 micron IR band. Knock out ozone and you open an IR window, so heat leaves in a hurry.
Right now, ozone is down…
The second issue is that the magnetosphere becomes weaker. This lets more cosmic rays hit the air and makes more clouds. More clouds make us cooler by reflecting more sunshine away.
Put these two together: Less heat gets in as light, more leaves as IR, we get colder.
Nobwainer (Geoff Sharp): Why doesn’t Krakatoa show in your graph where you’ve marked?
http://users.beagle.com.au/geoffsharp/krakgiss.jpg
The green error bar might have something to do with it. And in my opinion, GISS is optimistic with their confidence.
Nobwainer (Geoff Sharp): A second thought, the reason why the El Chichon and Mount Pinatubo eruptions don’t have higher global temperature reactions is they were counteracted by El Nino events that occurred at or near the same time.
PaulHClark: Thanks for the linked paper. I’ll take a more detailed look after I’m done with the post I’m preparing, but at first glance, it appears in that 2000 paper Yousef is using a version of TSI that’s obsolete.
Bob Tisdale (07:02:43) :
t appears in that 2000 paper Yousef is using a version of TSI that’s obsolete.
I agree.
Leif: Happy and Healthy New Year to you and yours.
Bob Tisdale (05:35:42) :
Nobwainer (Geoff Sharp): Why doesn’t Krakatoa show in your graph where you’ve marked?
http://users.beagle.com.au/geoffsharp/krakgiss.jpg
The green error bar might have something to do with it. And in my opinion, GISS is optimistic with their confidence.
Thanks Bob, but I am still not convinced. The Hadley spreadsheet supplied by TonyB earlier allows accurately that the temps rose from 1883 and 1884 before falling back to the same level 1885 and if we look at the ice core details thru the Dalton the “unknown” and Tambora eruptions only show elevated sulfur dioxide readings for approx 3 yrs each. I am not denying there is an impact, but suspect its a lot lower than Leif suggests.
http://cadenzapress.co.uk/download/mencken_hobgoblin.xls
http://en.wikipedia.org/wiki/File:Greenland_sulfate.png
Bob Tisdale (17:39:15) :
Tallbloke: The oceans should have stored more energy with the increase in TSI since SC20 and, going back further in time, since SC14, but I can’t answer your question if it can account for ALL of the increases in SST anomalies. Changes in cloud cover would have an impact, as would the variations in volcanic aerosols.
I did post a video recently about the change in global SST and global temperature since the 1997/98 El Nino. It uses a JPL SSH animation in addition to graphs. It’s about 5 minutes long.
http://bobtisdale.blogspot.com/2008/12/lingering-effects-of-199798-el-nino.html
Many thanks Bob, great site, and brilliant animation video, really gives an insight into the dynamics of the world’s ocean circulation and climate. Look forward to your new article.
nobwainer (Geoff Sharp) (13:54:57) :
Laki (Iceland) 1783-84 shows up well in TonyB’s data. It had a major effect on the NH winter temperatures in 1784 in Europe and N America.
Also there’s a link below to a 2005 paper where Laki and Tambora affected growth of the Irish Oak.
http://star.arm.ac.uk/preprints/437.pdf
This site is comparable to the Pastafarians sarcastic t-shirt which shows global warming as a function of number of active pirates. It is what I will call bullshit.
As for the “global temperature database” you refer to; satelite data for global temperature variations has been available as well as ground data. You can see the latest measurements here: earthobservatory.nasa.gov