Are they driven primarily by global climate change?
by E. Calvin Beisner
Want to know whether this summer’s heat waves in the United States are extraordinary—nay, even unprecedented—due to manmade global warming?
Where should you go for solid, objective data?
Obviously, to the authoritative source, the Environmental Protection Agency. So you go to its page titled “Climate Change Indicators: Heat Waves.” Immediately when the page opens up, this is what you see:

There you have it: decade by decade, everything goes up. Frequency? Tripled over the six decades. Length of heat-wave season? Also tripled. Average length of individual heat wave? Up by about a third. Average heat-wave intensity? Up by about a fourth.
Case closed. U.S. heat waves are a clear indicator of “climate change,” and what they indicate is that things are getting worse—much worse.
More than First Meets the Eye
Many visitors, perhaps most, won’t read the text on the page—that graphic by itself tells the whole story, everything they need to know. And few will notice that it’s labeled “Figure 1.” They’ll just look at the pictures, the first pictures to appear before them, and conclude, “I don’t need to see anything more.” Because that’s what our image-driven society has been trained to do. Never mind “In the beginning was the Word.” Nope, images are all we need.
But some will read the discussion below the image. Not the mere caption, but the “Key Points.” Here’s what they’ll learn from the first five:
- “Heat waves are occurring more often than they used to ….”
- “In recent years, the average heat wave … has been about … a day longer than the average heat wave in the 1960s.”
- “The average heat wave season … is 47 days longer ….”
- “Heat waves have become more intense over time.”
- “Heat wave duration has increased significantly ….”
Because America’s educational system has so failed to teach true critical thinking—not just getting offended by something but digging into the underlying evidence and reasoning—that’s about all that will really come across.
I confess that when I first read through this page, that’s about all I really retained.
But then I slowed down and read more carefully and noticed some significant qualifiers, point by point:
- “Heat waves are occurring more often than they used to in major cities ….”
- “In recent years, the average heat wave in major U.S. urban areas ….”
- “The average heat wave season across the 50 cities ….”
- “During the 1960s, the average heat wave across the 50 cities ….”
- “Of the 50 metropolitan areas in this indicator, 46 experienced a statistically significant increase in heat wave frequency between the 1960s and 2010s. Heat wave duration has increased significantly in 26 of these locations, the length of the heat wave season in 44, and intensity in 16 ….”
Huh. The labels in the graphs didn’t say anything about “major cities,” “urban areas,” “metropolitan areas.” They appeared to depict what happened for the whole United States. What gives?
And then I came to point 6, which partially but only by implication, not explicitly, revealed the deception:
- Longer-term records show that heat waves in the 1930s remain the most severe in recorded U.S. history (see Figure 3). The spike in Figure 3 [Figure 3? What’s that?] reflects extreme, persistent heat waves in the Great Plains region during a period known as the “Dust Bowl.” Poor land use practices and many years of intense drought contributed to these heat waves by depleting soil moisture and reducing the moderating effects of evaporation.
The Great Rural-to-Urban Migration
Question: How many of America’s “major urban areas” were, in the 1930s, in the “Great Plains region”? I haven’t been able to answer that question for the top 50, but I have for the top 10, enough from which to draw some strong lessons. Of them, none were in the Great Plains region. By the way, only one, Baltimore.—in the northernmost of “Southern” states—was in the “Southern region,” none was in the Desert Southwest region, and only one in the entire Southwest. But the South and Southwest are the hottest regions of the country.
What about the 1960s? Only 1 of our 10 largest cities was in the “Great Plains region,” in its southernmost state, and 1 was in the Southwest, specifically, southern California. The rest, not.
How about the 2010s? Because the Great Plains region includes Texas, 3 of our top 10 cities were in that region. One was in the Desert Southwest, but 3 were in southern California—which, apart from irrigation, is also desert, and it’s definitely in the southwest, so it ought to be included in the “Desert Southwest.” So 7 of our 10 largest cities were in the southern Great Plains region, the Desert Southwest, or the desert of southern California.
So by the 2010s, clearly, the average location of our 10 largest cities had shifted heavily from the Northeast to the south and southwest. Might that have anything to do with average temperature readings in our major urban areas?
Ponder this for a minute: in the 1930s, almost no home, office, or factory had air conditioning; by the 2010s, almost every home, office, and factory did—at least outside of our northernmost, coolest states. Might that have contributed to the shift in population?
So, how much of the apparent increase in heat-wave frequency, heat-wave duration, length of heat-wave season, and heat-wave intensity from the 1960s could be attributed to where our most populous cities were? I can’t give you a specific quantity, but I guarantee it’s not zero.
Urban Heat Island Effect
But the location of these cities isn’t the only relevant factor. The very fact that they’re cities matters—as does their size. That’s because of the “urban heat island effect” (UHI).
According to the EPA, this “results in daytime temperatures in urban areas about 1–7°F higher than temperatures in outlying areas and nighttime temperatures about 2–5°F higher.” Further, “Humid regions (primarily in the eastern United States) and cities with larger and denser populations experience the greatest temperature differences.”
In the 1930s and 1960s, only 5 of our top 10 cities had populations over 1 million; in the 2010s, 9 did. In those first two decades, average population of our top 10 cities was 1.90 and 2.18 and million respectively; in the 2010s, 2.45 million. Average size in the 2010s was 13% higher than in the 1960s and 29% higher than in the 1930s. Take New York, with more than double the population of the second largest city in each decade, out of the picture to eliminate its skew, and the averages are 1.35, 1.55, and 1.81 million respectively, and the average size in the 2010s was 17% higher than the 1960s and 35% higher than the 1930s.
In short, our cities have grown in population. No surprise about that. In 1930, 56% of Americans lived in urban areas; in 1960, 70%; in 2010, 81%. But granted what EPA says about UHI, that it can result in temperatures 1–7°F higher than outlying areas, it is simply stunning that it relies on heat-wave data for urban areas for its first five “key points.”
If you’re really curious about how the UHI works and just how much it can affect a city’s temperature, read John Christy’s Is It Getting Hotter in Fresno … or Not? Christy demonstrates, through intricate data analysis comparing temperature readings inside, near, and remote from Fresno over more than a century, that the vast majority, perhaps all, of the upward trend in temperature in Fresno was driven by UHI, while the surrounding non-urban region experienced little or no warming. And Fresno is a relatively small city; larger cities experience even greater UHI effect.
So, as America’s most populous cities have (a) grown in population and (b) shifted in location to hotter and more humid areas, we should expect them to have experienced more frequent, intense, and long-lasting heat waves and longer heat-wave seasons—utterly independent of any global-scale warming.
All of this should make us highly suspicious that the EPA’s Figure 1 on its page “Climate Change Indicators: Heat Waves,” shown above, could be grossly misleading.
What Was America’s Hottest Decade?
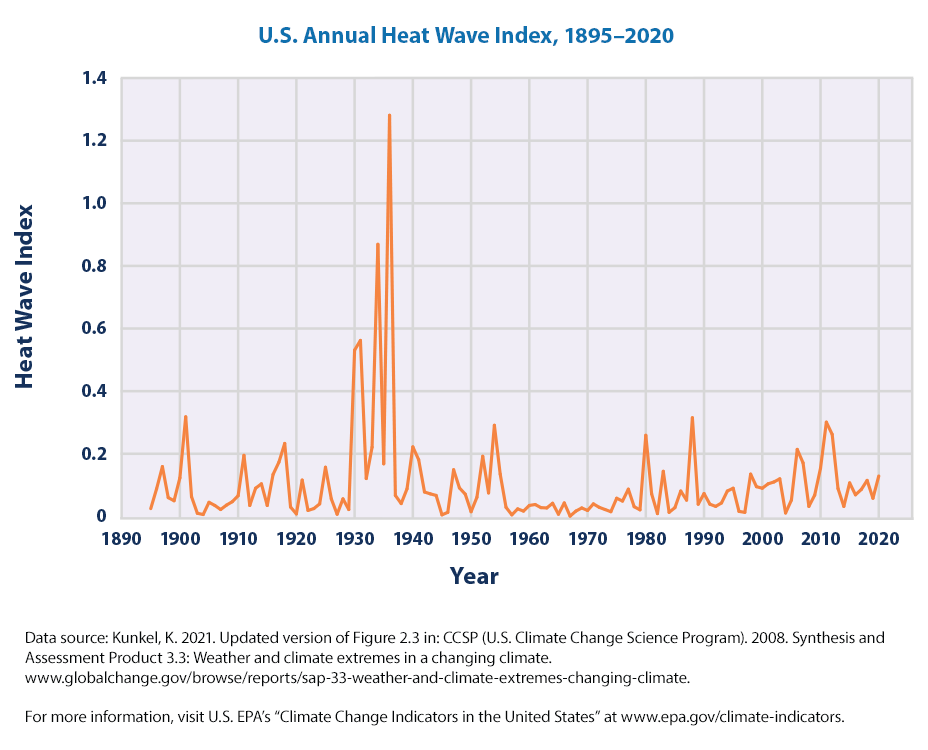
One more consideration drives the nail in Figure 1’s coffin. Recall the start of EPA’s sixth “Key Point”: “Longer-term records show that heat waves in the 1930s remain the most severe in recorded U.S. history (see Figure 3).” Well, there’s a small, faint image on the page that links to Figure 3, but most readers will likely miss it (as I did at first) or ignore it. If they click on it, though, this is what they’ll see:

So, the EPA had the data shown here in Figure 3. Why then did it truncate the data in Figure 1, starting with the 1960s instead of the 1890s or 1900s? The answer veritably shouts at us: Because the 1960s heat-wave index was the lowest of the entire 125-year period, and while the index rose in fits and starts afterward, it never came close to what it was in the 1930s.
There are two terms for the EPA’s tactic: cherry-picking data (to include only those consistent with your theory) and its more precise subset, end-point fallacy (starting or ending your data at dates that exclude data that would conflict with your theory). Both are scientific no-noes.
Now, back to our opening question: Are this summer’s heat waves in the United States extraordinary—nay, even unprecedented—due to manmade global warming? And one other question: Can we trust the EPA’s communications about global warming/climate change to be transparent and objective?
What do you think?
E. Calvin Beisner, Ph.D., is President of the Cornwall Alliance for the Stewardship of Creation.
Has Griff succumbed to heat wave effects?
OMG, could Climate Catastrophe have finally done in the Grifter? So sad if true…RIP dear old Grifter, if only we had listened…
Very touching. I can imagine you standing by the bier, clutching a small onion.
I’m enjoying the war weather! (Except when it hits 40C)
Visited Bletchley Park UK over the weekend… the extraordinary place where German codes cracked in WW2. Amazing museum – highly recommended if visiting UK
If you ever get to Virginia, visit the Vint Hill Farm Station – birthplace of the U.S. National Security Agency. My wife and I went there a few weekends ago, curious about the Cold War Museum. It’s amazing – the equivalent of a small family house, it contains the rich history of Vint Hill. The farmer who owned it in the 1930s was quite interested in radio. He invited a neighbor, an Army Lt. Colonel, for lunch one day, and during the conversation after lunch remarked on his interest in radio. In particular, he noted that he could pick up taxi cab radio dispatches…from Berlin! The farm was located atop a rare geophysical formation which made it a super antenna. The Army bought the farmer’s land, and set up an enormous omni-directional antenna array which allowed them to monitor worldwide radio traffic. We had our own version of Bletchley Park there, and it was also home to SIG-SALY, the very first secure telephone communication system used to link the U.S. and U.K. command structures. One of these days, my wife and I will make it to Bletchley.
The Poles cracked the Enigma Code first Todd Huffman …Sadly after Polish pilots helped defend Britain fighting the Luftwaffe in the skies with valorous distinction and superlative skill , the Polish aces were prevented by their grateful British hosts from marching in the Victory Day parades to appease Stalin …….Are there any plaques or portraits of Polish heroes gracing the halls of Bletchley Park or are they still ‘unpersoned ‘ after all these years.? …..Well I suppose the gay code-breaker whiz Alan Turing is a redeemed Woke icon after Britains disgraced secret police turned on him too
There is a Polish memorial at Bletchley Park which honors the contribution of Rejewski, Zygalski and Różycki. The Polish pilots who fought in the Battle of Britain were invited to parade as a result of the protests of Churchill and others, however they refused to participate because the other branches of the Polish military in exile had not been invited.
Maybe griff can tell us how 7 out of the top 11 highest temperatures recorded in the UK during the heatwave just happened to be at airports/aerodromes? Obviously these are places where meteorological stations are going to be sited, but 7 out of 11 is statistically significant compared to the overall number of weather stations in the UK. In simple terms this means their results are must be down to something different.
Well, griff, what might it be that differentiates airports and aerodromes from other weather stations? It’s unbelievable that the Met Office and BBC can talk about such records while completely ignoring what is very clearly happening here. Propaganda and fraud come to mind, not honesty or transparency.
We can only hope.
Whoops, looks like you woke Griff up.
Thanks to Dr Beisner.
With the recent heat wave in Ireland and the UK, the mention of the UHI effect was conspicuous by its absence in all discussions and news reports. I measured the temperature outside in Dublin North which was several degrees lower than the highest temperature taken from a park adjoining the center of the city.
The Met office in the UK fanned the alarmism by warning of thousands of expected deaths. In both countries the Met offices and newspapers spread the alarmism in advance. In Ireland we did not reach the predicted temperatures in a number of areas.
Met office predictions included some of 43C.
Never made it, of course.
All the locations I checked in the top 20 that weren’t obviously airports could be preceded with the word RAF. Either a current or former RAF base.
Perhaps the warnings enabled people to avoid the ill effects?
5 places in the UK showed over 40C, 39 others broke the record set 3 years before.
It is unlikely in the extreme that UHI accounted for those 44 new record sand the rest of the UK between them was cooler.
No, it was of short duration and that is a big key to minimizing heat or cold injuries/deaths. What you got was a blast of Sahara air that passed from France to Britain over the narrowest part of the channel so spent little time over water. It had nothing to do with climate change.
The real heatwave of 1976 when it stayed at or above 38 C for 16 consecutive days was a more dangerous situation. That of course happened during the global cooling scare and nobody blamed it on “climate change”.
Do you really believe that the 0.7C warming that has occurred since 1850 caused temperatures is the sole cause of London being 5C above average for a day or two last week?
Anyone not using all the data is commonly intending to lie.
In the law this is called lying by omission. That is why the famous US trial witness perjury oath is: “The truth, the WHOLE truth, and nothing but the truth.”
In other words tell the truth, do not lie by omission, and do not outright lie. The later two are both criminal perjury when under oath in a courtroom.
In law, tampering with evidence or witnesses is forbidden and illegal.
In climate science, tampering with data (the evidence and the witness) is ordinary and normal.
It would be nice if the whole truth rule applied to judges, too. I am minded of a 2nd degree murder case (defendant was over the legal alcohol limit) here where the judge allowed the suppression of the truth that the motorcycle victim was high as a kite on marijuana and going more than 100 mph when he collided head on with the defendant. Oh, and also that the State accident investigator had broken up a sexual relationship with the defendant quite nastily.
One reason they don’t want me on a jury – I would always be quite suspicious of what <i>relevant</i> evidence has been suppressed (by prosecutor, defense attorney, or both).
Been there done that, watched plod unable to remember anything, lie under oath, judge obliged by believing everything lying sod said under oath.
British Justice it’s the biggest con-job out there, built on ,myths and legends and maintained by Oxbridge snotty nosed entitled hyopcrites.
Any attempt to reform it or make changes hits the power of those elites to keep their own nice little cartel world comfortable.
More common in goobermint climate “science”
is lying by prediction.
50+ years of always wrong predictions of
rapid dangerous global warming that never shows up.
In fact, CAGW is nothing more than a prediction.
Leftists lie or deceive on every subject.
Why would climate change be different?
Oops, should have read Rud’s answer first
Good post. BUT it’s actually worse than depicted.
It is not only the EPA on heat waves.
The USFS did the exact same trick with annual forest fire severity (acreage burnt)—except they then also disappeared from their website the pre 1960 historical data that they are by law responsible for keeping, thankfully still retrievable using the Wayback Machine.
And 14 US government agencies used the same trick in their chapter 1 of the Congressionally mandated 2014 National Climate Assessment. I historically deconstructed that in essay ‘Credibility Conundrums’ in ebook Blowing Smoke.
The ONLY way the US government shows ‘observational’ climate alarm is by cherry picking then erasing the quantitative and qualitative past before about 1960 (or in the case of Arctic ice, 1979). Or by ‘homogenizing’ surface stations and ignoring USCRN results. Or by SLR satellites not fit for purpose, having accuracy of >3 cm when <2mm is required to match tide gauges. Essay PseudoPrecision in ebook Blowing Smoke. All willfully dishonestly fraudulent.
The 1960s was a recognised cool period with fears of a new ice age all over the media which is why that start point is so egregiously dishonest.
Only a minority of scientists predicted a coming global cooling crisis.
the attention they got was far out of proportion to their small numbers.
Why was that, do you think?
What percentage of scientists have to agree on something for it to be correct?
Concerning wildfire acres burned, the data truncation is just one problem with the data. There are two other problems, one minor and one serious.
The fact that data are truncated, which is obvious to us, is disturbing because government climate bureaucrats DON’T CARE that we know.
The two other problems with wildfire acres burned:
(1) The 1930’s acres burned are higher from prescribed fires in Southeastern states by the Civilian Conservation Corp. — the shape of the curve in the 1930s without the prescribed fires fire district would be similar but not be so radical without the prescribed fires, and
(2) There is no logical connection between
forest fire acres burned and small increases
of the global temperature.
Up to 90% of fires are “manmade”.
Do people have more accidents because the weather is slightly warmer?
Do people commit more arson because the temperature is slightly higher?
Do more electric wires get taken down by tree branches because of a few tenths of a degree C. of global warming?
There could be a connection between rainfall and acres burned.
But precipitation has been increasing with global warming, not decreasing.
Think of California:
Every year during fire season the brush is dry and good fuel for a fire.
Especially with the lack of forest management.
If the temperature goes up even one degree,
how can already dry brush become any drier?
The increase of population in CA means there are
more people in the state to cause accidental fires.
There are more people living near the forests than ever before too.
Good work.
Now watch the media ignore it.
We need more people who can observe the temperatures away from the ‘official’ weather stations that are based in urban areas, or next to runways etc.
Properly sited Stevenson screens set up according to proper protocol could give a comparison with the ‘official’ figures.
In particular it would be useful to have a comparison between a standard max/min thermometer and an electronic thermometer that takes readings every few seconds. Temporary spikes due to various causes could/should be ignored.
It is a bit like the blast of hot air from when an over door is opened. It wouldn’t be said that the average temperature of the kitchen should include that figure.
Since there’s no cell phone videos of the ’30s, they didn’t happen and/or they don’t effect me NOW!
(Sorry. I’d say more but I need to plug in my cell phone. The battery is low. I can’t think or remember without it.)
Let me introduce you to Dorothea Lange…
https://rarehistoricalphotos.com/dust-bowl-dorothea-lange/
C b
Thanks – I’d not seen those before.
Brings home how desperate a time those years were.
My fear is that – with the ‘war on oil’ and gas – we may return to times like those for so many people.
The insanity – or Globalists’ Plot [I’m still undecided] – needs to end soon.
I have very modest hopes of Liz Truss, and none of Rishi Sunak here in the UK – in that regard.
Auto
Thank you Dr. Beisner!
The EPA has either reincarnated Josef Goebbels and Edward Bernays or they’ve hired pretty good imitations of those two liars.
Good review exposing this EPA propaganda. Clearly intentional and greatly dishonest. The simplicity of this fraud suggests that the dishonest purveyors have little fear of appropriate consequences.
The implications are very frightening to those who expect a government of the people, for the people, and by the people. We are in big trouble.
More government administrative and bureaucratic lying and cheating. Those monsters don’t deserve to be taken seriously by anyone. They are devils.
But they drive policies that do not drive humanity forward 🙁
Windmills and solar panels are a step backwards wasting resources.
That last graph showing the US Annual Heat Wave Index should also show a spike for 1957. This puzzles the heck out of me. This was a West Coast heat wave that struck in the summer of 1957. It coincided with a major forest fire that destroyed beautiful Clear Lake, Ca, and a large forest area in Lake and Mendocino counties. These areas had healthy stands of second growth timber, and it was all destroyed by the fire. Fifteen years later when I moved north out of the city loggers were still working the burned trees from 1957.
If I remember correctly the agency that collected temp data was located at Clearlake. This may well explain why there is no data from1957/58. I was on a family fishing trip in that year. We had driven north to the Trinity River to fish on the Hoopa reservation. Temps soared into high triple digits. Hoopa temps reached around 115 degrees F. People were saying that Willow Creek to the south of us had hit 120 F. Trinity county temps were also said to be close to 120F. Those were the highest temps I had ever felt in my life. I now live in Trinity county. We just went through a week long heat wave. The hottest day was 108 F, but that would be around 12 degrees F cooler than the highs of 1957.
The 1950’s was a hot decade in the United States.
New York City had two heat waves in 1953, the second lasted 12 days with temperatures over 90. We arrived from England on July 1 and spent the 2nd touring around the city. It hit 92 that day and we had never experienced anything like that.
and 1957/58 saw a solar max
Pure fraud. There’s no other word for it.
The devil is in the details.
The Urban Heat Island effect is irrelevant when discussing heat waves. By definition a heat wave is a period of time with a significantly higher temperature than is usual for that location. So the UHI raises the average temperature and thus raises the threshold for a heat wave.
Can you re read what you wrote and have a think about it
Lol…I am not sure he gets it.
He wrote it but doesn’t understand a word of it. Wonder if he just copied and pasted from somewhere else without reading it?
Which part didn’t you get?
Try reading it again 🙂
Remember he is using Griff’s brain this week.
Izaak’s disconnect from reality. It’s been mentioned before that the weather station’s are contaminated with UHI and yet he persists in the false narrative that UHI is somehow different and separate from these temperature readings. UHI makes heatwaves far more likely in urban areas, which has been confirmed by scientific studies done in recent years.
Which part did you not get?
Simple Simon, the magnitude of the UHI effect is greater now than before. More blacktop, more heat emitting devices such as A/C units and cars, fewer cooling trees and grass. That’s why high temperature records should be corrected for UHI effect but aren’t. Without corrections people will think that a new urban record (almost all new records are set in urban areas) is solely due to global warming when it isn’t. In fact, without UHI there might not have been a new record at all. So why are alarmists like you (fecklessly) trying to mislead by discounting UHI effects on high temperature records? Heavens knows but you sure are dishonest.
Me-Abnormal
“Without corrections people will think that a new urban record” Are you suggesting they should “tamper” with the data?
It became harder to achieve a heatwave in parts of the UK this year because the MET Office changed the criterion to be based on the 1991-2020 averaging period rather than the previous 1981-2010. Previously only Central London had a threshold temperature of 28ºC, now a much larger area of 8 counties has that threshold.
I’ll see your heat wave and raise you a recession. It’s no use defining anything for leftards. When it suits them, they can deny the accepted definition. And a one second “period of time” can be a heat wave according to Izzy’s sloppy definition.
The same can be said of global warming. It just raises the average, so it can’t be the cause of heat waves.
It’s why I prefer the term “climate change,” because it is not just the temperature that changes.
The real dishonesty is the use of data related to the number of days above a certain value, both maximum and minimum temperatures. As if 99 °F is balmy and 100°F is unbearable like 120°C. A degree higher on average and the same weather pattern as happened before can look like 20% worse in the data when the difference is barely perceptible.
I find it strange that it seems more sensible than an index with some sort of weighting for how high above a certain value, like the mean, the temperature is, even if subjective.
I looked at the data for summer maximum temperatures of two Australian cities where I squared the difference between the maximum and mean for those above the mean. My choice was purely based on I feel that 10 degrees above the mean is 100 times worse than 1. Dodgy as it sounds, more sensible than what they do.
Despite the UHI, when I plotted this for 100 years of data, there was a zero trend.
Heatwave like flood and drought are made up concepts that are defined differently for different locations.
They are only usefull for information purposes at each location.
The should not be averaged across regions with totally different climates.
I have calculated heatwave properties for major Australian cities for the last 20 years. Today, I finished an update so data are from the start of the official BOM record to July 2022. Also, I have added Darwin and Alice Springs because of their geography, to better fill the map of stations.
There are now eight stations in the summary.
http://www.geoffstuff.com/eightheatwave2022.xlsx
I have linked separately to one of these stations, Darwin with an Excel file to show the calculation methods, which are extremely simple. It is a big file, so give it time to download.
http://www.geoffstuff.com/drwheat2022.xlsx
………………………
The bottom line.
This is the start point, the original temperature data sorted for visual demonstration.
Mostly, it show no significant evidence for the claim that heatwaves are becoming hotter, longer ot more frequent.
If the most basic data do not contain these signals, why torture it?
If you manage to tweak some kind of signal – as the graphs from EPS pretend to show – the you still have to explain how you got an “advanced” signal out of a basic set of data that had no signal, or maybe a very weak one.
I shall answer that.
You redefine in terms that suit your purpose, what a heatwave is. You then cherry pick. You pick favorable start and finish dates. You choose obscure variations of the raw data that suit, like choosing a particular suburb in a large city to work your magic. (Here I have selected the main station for my work, though one can argue that other stations might be better. That is why I also showed the official ‘adjusted’ ACORN-SAT data for Australia. You cherry pick your data set to suit your story, so EPA chose to show only a few cities (I did also, but the represent about 70% of the total Australian population). You fail to add uncertainty boundaries to your data. You choose not to stress factors that might weaken your story, like choosing not to properly account for UHI influences. You then use ‘appeal to authority’ by pretending that the EPA logo makes it 100% credible for public consumption.
That is not science, that is advertising.
……………………
Readers, please do the exercise that I have done, for your own country.
It is not hard, just boring if you have only an old PC like I do.
It needs to be done because you can’t really argue against the raw data.
This is game, set, match type material.
Good luck Geoff S
Geoff, you said,
I have previously looked at global data and reached the same conclusion:
https://wattsupwiththat.com/2019/09/06/the-gestalt-of-heat-waves/
Yes Clyde,
There are so many undefined parameters like agreed start and end dates for the input data that we have a convenient set to fiddle ‘with authority’.
There is a wrong impression that because the country has warmed 1.X degrees C over the last century or so, hetwave maxima will also warm by 1.X C. I cannot find evidence for this.
I am reminded of Ric Willoughby’s excellent work that shows a cap of about 30C on the maximum T that open oceans can reach. Maybe there is a feedback over land, possibly cloud-related, that also caps land maxima. Cheers Geoff
The climatistas’ deceptions are on purpose. They are waging a war, a war against freedom and capitalism, and the first casualty in war is always the truth.
So many of them are True Believers in The Cause, no matter how the cause is disguised – save Mother Earth! Civilization is evil! No amount of truth, logic or reason can ever sway them. Like all good leftists, they believe the end justifies the means.
The only way to fight them is through education. Thanks to sites like this people have access to information and not just propaganda.
The article hints at it but it would be interesting to explore the correlation of ground water depletion to the ups and downs of figure 3. With rising population in most cities one would expect ground water depletion may play a significant part in the heat waves we are seeing on the news.
Heat waves play a major part in ground water depletion.
The data po page 1 looked so dramatic that I tried looking at the original source. Footnote 8 appears to link to the source, so I clicked the 8 which was hotlinked. It led to a link at the end of the paper that was not a hotlink. It was dead, “source not found”.
Being suspicious, I looked at the map of the cities to see if they were the same ones for all decades. That would be REALLY a trick, akin to Mikey’s. It appears from the map that the same 50 were used for all decades.
BUT, some major metropolitan areas are missing. Houston, Denver, Minneapolis/St. Paul, Memphis, and likely more are completely missing.
Would they have changed the narrative?
And why is it within the purview of the EPA to track heat wave data, especially after the SCOTUS has ruled they have no jurisdiction over CO2? Pure propaganda.
This article is exactly right on the money! Almost half of the all time hottest temperatures in each state of the USA were set in the 1930’s and still stand today!
U.S. state and territory temperature extremes
https://en.wikipedia.org/wiki/U.S._state_and_territory_temperature_extremes
From Cliff Mass:
The Golden Rule of Climate Extremes
“The more extreme a climate or weather record is, the greater the contribution of natural variability.”
“Or to put it a different way, the larger or more unusual an extreme, the higher proportion of the extreme is due to natural variability.”
https://cliffmass.blogspot.com/2016/03/the-golden-rule-of-climate-extremes.html
Increasing greenhouse gases should mainly affect TMIN, not TMAX,
and that has been true in the Northern Hemisphere since the 1970s.
Also, more effect in the six coldest months of the year, and mainly affecting the Arctic, and not much in the tropics. That has also been the warming pattern of the Northern Hemisphere since the 1970s.
Hidden by the use of a one number global average temperature.
The Southern hemisphere is a much weaker example.
Agreed Richard!
Previous to this current slight, mostly beneficial warming, every other time in history that the planet warmed up similar to the current warming (coldest places at the coldest time of year-the most), they called it a climate OPTIMUM, not a climate CRISIS.
That includes the Medieval, Roman and Minoan WARM periods/Optimums and the Holocene Climate Optimum that was 2 deg. C warmer than this for much of the time in the high latitudes of the Northern Hemisphere. There was less Arctic ice then, for a couple thousand years………and somehow the polar bears survived.
Holocene Climate Optimum:
https://en.wikipedia.org/wiki/Holocene_climatic_optimum
For the Medieval Warm Period compared to today below, here are the scientific studies
On the map at this link and displayed with this post, red balloons showed it was warmer(more reds than any color and it was GLOBAL warming, not regional warming)
Blue was colder than today(in that study)
Green was wetter/more precip
Yellow was drier
https://wattsupwiththat.com/2017/01/03/documenting-the-global-extent-of-the-medieval-warm-period/
If you go to the link below, you can hit those individual balloons and get each individual study:
https://www.google.com/maps/d/viewer?mid=1akI_yGSUlO_qEvrmrIYv9kHknq4&hl=en_US&ll=16.104045987509945%2C1.8272485000001097&z=2
You can get more at this link below, and also by scrolling up and down to see additional data pages.
https://www.marketforum.com/forum/topic/87294/#87335
The urban heat island (UHI) has a significant affect on TMIN, little difference on TMAX.
Therefore even the assumption greenhouse gases mainly affecting TMIN is competing with UHI and more SWR. Decreasing cloud albedo causing more SWR during the day increases TMIN during night in urban areas because it is slowly released from man-made structures and environments during the night.
The difference can be several degrees C for TMIN, but only about 1c or 2c for TMAX.
The difference can be a little more for TMAX – it’s estimated that 1.5-3C is not unusual and may be higher. The increase in TMIN, of course, means that overnight temperatures are higher, cooling off is less and this has a knock-on effect with daytime TMAX readings. Given that urban areas are set to become larger and with more heat sources, it’s absolutely essential that we study and understand the UHI processes in detail.
Something that is not ever mentioned. If climate ”change” (global warming) is responsible for today’s heat waves, then it MUST by definition be responsible for mild weather, cold, rain, drought, wind, no wind, fine weather, perfect weather days and every other kind of weather that we experience every single day everywhere around the world with no exceptions because the effects of co2 don’t take a break. So, at every weather forecast it should be pointed out what climate change will bring us on that day.
In other words, blaming heat waves on CC is the most contemptible claim in the history of human kind.
Climate in the usual sense of the word cannot change anything ever. Climate can be known only as the average of what has already happened. The arrow of time moves in one direction.
But it is slowly dawning on me that the word “climate” in the mouth of almost everyone who speaks of “climate change causing something” means something different that they never define. From context my guess is they think of climate as akin to aether or karma or deviltry.
About which, science has nothing to say.
I’ve been on about this for a few years now. “Climate change” can’t cause anything because true climate change is the result of changing weather over at least a 30 year period. To say that “climate change” caused something is like saying wet sidewalks caused the rain.
Exactly! Can anyone name a weather event not related?
All weather events are affected by “climate change” — for good or bad.
So, the georgeous (hot: 104 F) weather I am experiencing in central Arizona today
is completely consistent with “climate change”.
From the article: “Now, back to our opening question: Are this summer’s heat waves in the United States extraordinary—nay, even unprecedented—due to manmade global warming?
No, they are not extraordinary. And as of today, no detection of manmade global warming has occurred, so the cause of the heatwaves, whether ordinary or extraordinary, is the result of Mother Nature, until proven otherwise, and nobody has proven otherwise.
“And one other question: Can we trust the EPA’s communications about global warming/climate change to be transparent and objective?”
Of course we cannot trust the EPA. Your article demonstrates why. When it comes to human-caused climate change, the bureaucracy is prepared to tell any lie and distort any fact in their efforts to promote their Green New Deal, like the EPA has done here. They don’t present the evidence, they hide the evidence showing they are wrong.
“What do you think?”
I think we have a bunch of dishonest people running our government who are lying about human-caused climate change and are doing their best to demonize CO2 for political ends. The truth is not in them.
I was looking at the last few decades of average annual temperatures in my hometown in Colorado. Prior to 2015, just seven years ago, it was pretty rare for our average yearly temperature to be above 50⁰F (10⁰C). Six of the last seven years (2015-2021) have been above 50⁰/10⁰C. What suddenly happened over just the last 7 years? I haven’t looked at any possible station changes, buildings at our airport, and so on, but it’s pretty suspicious.
Up until the last couple of years it looks like Colorado has been experiencing a rapid increase in population. More population = more urban growth = more UHI warming in urban areas. If you don’t want to experience those warmer temperatures then move away from urban areas.
The thing is, I haven’t noticed it being unusually warm except during La Niña years. There seems to be an increasing disconnect between what I see on my home thermometer and what the airport “reports”…and I live downtown!
I missed the reference to the airport in your original post – is that the only local temperature station? If so, ignore it or automatically knock off a few degrees from reported readings – they’re an artefact of airport activity and hot aircraft not reliable temperature readings.
What if you compared the 1930’s heat waves to the USCRN? Then what has happened? Obviously the USCRN did not exist in the 1930’s. But the cities of today and the amount of pavement keeps increasing. I went back to Indiana, and the gravel roads I remembered fifty years ago are asphalt today.
Observing the global climate is not the EPA’s job. Are there no sites in the US that could not stand a cleanup? What a bunch of creeps.
Compared to last century? Yes, extraordinary.
For this century? Increasingly not.
See also exceptional rain events and flooding…
”Compared to last century? Yes, extraordinary.”
No. And not for the one before that either.
Towns and Cities are bigger than last century, how extraordinary!
Indeed, the Grifter doesn’t like historic meteorological facts.
1868 is like garlic to a vampire.
The Times (UK) in July 1868. “The incessant heat, the breathless air, and more than all, the extreme exhaustion attending every labour has proved beyond question that it is possible to have tropical weather even in our misty climate.”
No he does not ….Griff is a memory holer . I can just picture him in blue overalls incinerating newspaper clippings and conjuring up Comrade Ogilvy’s in the Ministry of Truth …….Hey Griff – ” Choco rations up “! ……………Here is another series of archival and paleo-climatic facts pertaining to the searing heat and drought of 1540 far worse than 1808 , 1911 1976 2003 and three hot England days in July 2022 courtesy of Swiss historian Christian Pfister : ” For eleven months there was practically no rain , temperatures were 5-7C above the normal values for the 20th century , in many places summer temperatures would have exceeded 40C [ 104F ] …..forests in Europe went up in flames ,choking smoke darkened the sun ….Water was already scarce in May , wells and springs dried up , mills stood still , people starved ,animals were slaughtered. Estimates are that in 1540 half a million people died ………….Everthing began in northern Italy with a winter that felt like a July …..July brought such ember like heat that churches made prayers while the Rhine Elbe and Seine could be crossed on a dry foot …Where there was still water the warm broth acquired a green color …..Water levels in Lake Constance sunk to record levels . Lindau actually became connected to the mainland .Soon the surface water had completely evaporated ,soils broke up , some dry crack were so wide that a foot could fill into them ……..In Alsace fruit trees bloomed twice , in Lindau it was actually enough for a second cherry harvest ” …………..So entertain us Griff : were any rivers in the United Kingdom and Europe passable on foot this year ? …Any secondary stone fruit harvests ? ….. All that happened in July this year over England was a brief spell of hot Saharan air wafting over the English channel – a stretch of water so narrow it did not cool the hot air currents ….. Spain , Sicily and Naples closer to the Sahara have sweltered under these hot summer sirocco breezes for centuries .
Maybe griff can tell us how 7 out of the top 11 highest temperatures recorded in the UK during the heatwave just happened to be at airports/aerodromes? Obviously these are places where meteorological stations are going to be sited, but 7 out of 11 is statistically significant compared to the overall number of weather stations in the UK. In simple terms this means their results are must be down to something different.
Well, griff, what might it be that differentiates airports and aerodromes from other weather stations? It’s unbelievable that the Met Office and BBC can talk about such records while completely ignoring what is very clearly happening here. Propaganda and fraud come to mind, not honesty or transparency.
And yet that wasn’t the case when the previous record was set, yet all those weather stations were in the same locations. As demonstrated by Nick if the temperatures recorded at the airport sites are reduced by 0.1º then their distribution within the record list becomes more uniform. So maybe siting at an airport makes a difference of 0.1º, frankly when you’re talking about temperatures exceeding 40º that’s not really relevant. When you exceed the previous record at about 40 locations something very unusual has happened.
“When you exceed the previous record at about 40 locations something very unusual has happened.”
There’s nothing unusual about a high-pressure system warming things up.
The National Weather Service is likewise complicit. Few people realize that record temps are usually at the airport. Where I live some ten miles away from SLC International the temperature is about 5 degrees cooler, and it is still relatively urbanized here.
Great points, which I often make to friends who accuse me of confusing weather with climate change. Live in Regina Saskatchewan, this summer has been hot, like most summers, but we have not broken any records which were all set in the 1930s
Our wonderful Federal government has pulled the same trick with forest fire data by simply eliminating all data prior to 1983 because the pre-1983 data was not gathered by the modern methods as the post-1983 data. All forest fire data is and was gathered by the same “scientific” method – an eyeball or two, a pen and paper and a yardstick or mile-stick of some kind. When all data is considered, forest fires during the first half or so of the 20th century were manifold times greater than recent forest fires.
One wonders when crap like this will end.
Thank-you for the clarification. Our government is corrupt.
The US EPA needs to be abolished. It may have done some good in its first decade or two, but clearly it has done more harm than good since then.
Northern California has endured a week long heatwave. Today it is raining, and temps are in the low 80s F which is 20 degrees cooler than the heatwave produced just several days ago. CO2 be damned.
Another example of solving the “divergence” problem by “hiding the decline.”
The U.S. balloon data sets are reliable considering that the surface record is contaminated by urbanization effects, GHCN especially. Even the USHCN suffers from contamination (more suburban sites than rural). Higher positive trend in TMIN is evidence of urbanization effects. Just a small change in land use (forest to agriculture) is enough to disrupt decoupling of the nocturnal boundary layer.
The USCRN is a step in the correct direction. Balloon data and USCRN represent the best available observational evidence. Derived products from UAH have been carefully constructed and represent another reliable source for ground truth. Otherwise the surface record is highly questionable.
The legacy media asserted the the current drought in the Southwestern U.S. is the worst in 1200 years (see Journal of Nature Climate Change). I posted a link on Facebook for a NOAA site that contains a complete monthly archive of the Palmer Drought Severity Index, January 1900 – June 2022. Clearly in the U.S., 1934 and 1954 were the most extreme droughts.
https://www.ncei.noaa.gov/access/monitoring/historical-palmers/
The Monsoon Season is beginning to put a dent in the current “megadrought.” The alarmists will be disappointed. Go figure.
BTW, When I clicked on the link I posted on Facebook it came back with 404, page not found.
I downloaded the EPA 1895-2021 Heatwave index from their site. I then looked for the 30 year average index trends (you know, climate vs. weather). The results:
· Highest 30 year average period was 1925 – 1955 with an average index value of .200. There was a 138% increase in heatwave index over that period.
· The lowest 30 year average period was 1957 – 1987 with an average index value of .043. There was a 78% decline in heatwave index over that period.
· The last 30 year average index was .100. There was a 76% increase in the 30 year average index over the period.
These trends don’t align well with CO2 increases. Hmmmmm!
The next 30-year cycle (2017-2047) could be lower again. Solar cycle 24 was the weakest in 100 years and Cycle 25 looks weak too (the double dynamo theory, 180 degrees out-of-phase). Well done on the data analysis.