Thanks to Bob Tisdale, we’ve covered the evolution, peak, and demise of the sea surface temperature phenomenon labeled as “The Blob” in the North Pacific for awhile now. According to Wikipedia:
The Blob is the name given to a large mass of relatively warm water in the Pacific Ocean off the coast of North America. It was first detected in late 2013 and continued to spread throughout 2014 and 2015.[1][2]
Sea surface temperature indicates the blob persists into 2016.[3] This warm water mass is unusual in ocean conditions and is considered to have a role in the formation of the unusual weather conditions felt in the Pacific Coast.
The Blob was first detected in the autumn of 2013 and the early months of 2014 by Nicholas Bond of the Joint Institute for the Study of the Atmosphere and Ocean of the University of Washington, and his colleagues, when a large circular body of sea-water did not cool as expected and remained much warmer than the average normal temperatures for that location and season.[5]
Bond, who is the State Climatologist for Washington, coined the term “The Blob”, with the term first appearing in an article in the monthly newsletter of the Office of the Washington State Climatologist for June 2014.[6]
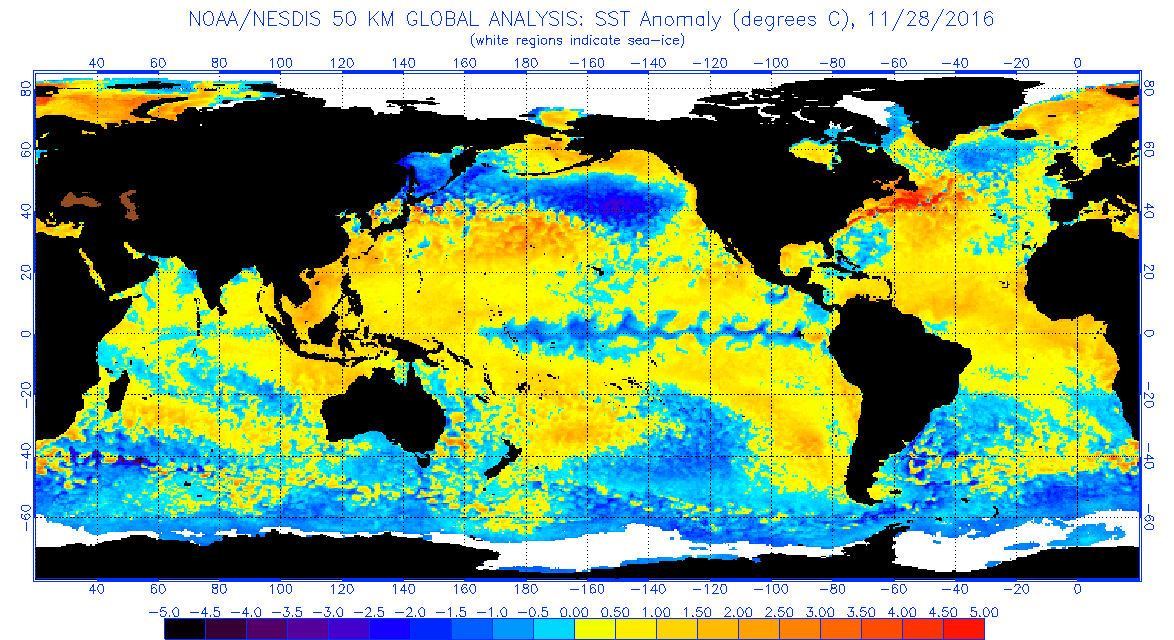
Well, “The Blob” as warmists knew it, is no more. Compare these two panels of sea-surface temperature:

Top panel: November 28th, 2016 Source here
Bottom Panel July 13th, 2015 Source here
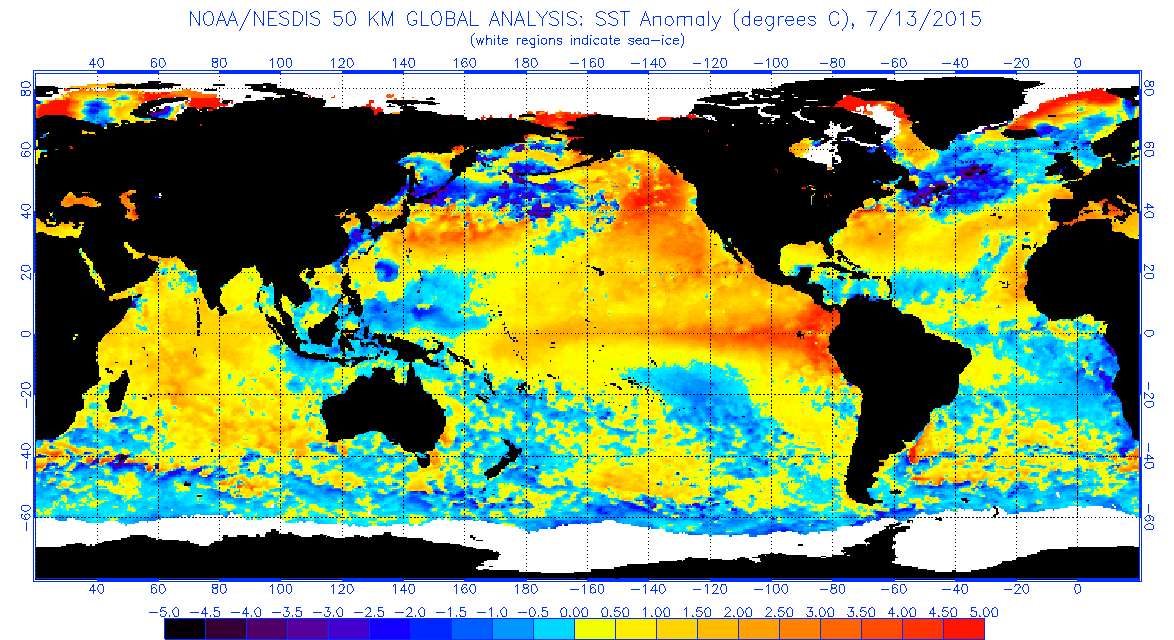
Also note the strong La Niña pattern in blue across the Pacific equatorial region in the top panel, along with the many other areas of below normal SST. Since SST tends to drive global air temperatures, it looks like 2017 might be a colder year globally if this keeps up.
Come on Monckton – we are all looking forward to your “The Pause is back and it’s now 25 years” (or similar) article on WUWT.
Ian, you will have to wait until that actually happens, but it doesn’t look it will be any time soon. Temperatures will have to be quite a bit colder for quite a long time to counteract the recent El Nino. That is simply an artefact of the way the pause is calculated.
I think the pause is currently about 6 months.
I do understand that seaice1 (and I repeat earlier blogs that you obviously don’t exist any more…), but, at some point (hopefully in 2017) there will be a huge statistical leap back to much earlier times. I really look forward to that day.
I’m keeping a close eye on global temperatures in case the Pause returns, but there will need to be a reasonably profound or prolonged la Nina before that happens. So far, land surface temperatures have fallen back to Nino-neutral values, and, in five months’ time, sea surface temperatures will also have fallen back. But we shall need la Nina conditions to re-establish the long Pause, and they seem to happen a little more than half the time following el Ninos, so we must wait and see.
However, when I updated all five of the principal datasets earlier this week and determined the warming rates since January 1990, the year of the IPCC’s first predictions, I found that on all five datasets the rate of global warming was below the lower bound of the IPCC’s interval of predictions in 1990.
I now know why the models have been over-predicting, but cannot say more till our paper on the subject – now out for review – is published. Watch this space!
I will assume that you mean that the natural cycles showing their effects is what you look forward to, as do all skeptics of anthropogenic climate forcing, Ian. The reality of that will not be very pretty if we return to 1816’s weather. It will not bother me to keep arguing (now that we have a national forum developing where it is allowed to be discussed) while the next El Nino brings us the latest record warm year by .001C. I hope to live out my life in a world that is warm and productive like right now. As far as the “trend” is going, the trend is more food produced/ less energy consumed for every warm or short winter we’ve seen here at the prairie’s edge.
Monckton of Brenchley
November 30, 2016 at 10:56 am
“I am keeping a close eye on global temperatures in case the Pause returns, but there will need to be a reasonably profound or prolonged la Nina before that happens. So far, land surface temperatures have fallen back to Nino-neutral values…………”
————————
Lord Monckton
Please allow me to ask a question in regard to the above selected statement of yours:
If the drop of temps nullifies the El Nino impact in the 2016 temps without a La Nina in the cards officially, or if the most of the temp drop effects mostly the temps towards the Pause before the La Nina, while still in a Nino neutral, will that consist as an acceptable return path to the Pause, in your opinion……Just asking, in a way as to cover all possibilities…?!
Cheers
The stop in warmING is since at least as far back as 1997, farther, per Phil “Cheers” Jones. There has been no warming of any statistical significance since at least the 1997/98 El Nino step-up in temps..
The temporary, El Nino generated, uptick in surface temps in 2015 did not cause a resumption of a warming trend.
A plateau with a bump on it remains a plateau.
It’s easy enough to experiment with endless different scenarios to see under what circumstances the Pause (and I mean the one which started in 1997) could rise like a phoenix from the ashes of el Nino.
For the UAH dataset:
If the anomaly should dramatically drop to zero, and remain there, then the Pause will be back in September 2018, and be over 20 years in length.
A slightly more modest drop to 0.02 degrees, and it would still not be back by the beginning of 2019.
You can judge for yourself how likely these possibilities are, but casting an eye back over the last decade or so, I think I’d rather bet on a white Christmas in London.
“””””….. This warm water mass is unusual in ocean conditions and is considered to have a role in the formation of the unusual weather conditions felt in the Pacific Coast. …..”””””
Actually it is involved in the formation of the usual weather conditions felt in the Pacific Coast.
When the blob comes and goes and heats and cools, we getr the weather that usually goes a long with that.
Move along now; nothing to see here !
G
Exactly, George E!
.40 year tempest in a tea pot!
Yes, george, can’t help but wonder if the blob isn’t just a mirror image of el nino/ la nina patterns. But, instead of hadley/walker trades doing the trick (in the western pacific), it’s the westerlies doing it in the eastern pacific. Just a wild guess on my part… (thought i’d put it out there to get some input from one or more of the many fabulous peops here at wuwt) i’s born in honolulu. So what many people find boring, that is ocean circulation patterns, i find natural to be fascinated by. (many, many thanx, too, for Tisdale and all the wonderful things that he does)…
Hello Mr Monckton,
What is often missing are the IPCC PER DECADE predictions/Projections,when talking about temperature trends since at least 1979. The ones that are way above actual trends we experience.
If you could show just how far off they are on decadal trends,you can make clear how poor the predictive capacity based on the AGW conjecture really are.
This way you can show that the short warming periods we get are nothing alarming at all.
I really think it needs to be called the super, giant, unprecedented cold blog or something like that.
Blob! haha
It’s about time Boston, New York, Chicago, and Minneapolis stepped up to declare they don’t need Federal snow removal funds because of global warming.
the social cost of carbon. all the snow removal jobs in the USA lost to China and Mexico. We need to end global warming today so those jobs will return! Think of the billions we stand to lose if cities aren’t snowed in every winter.
Mr. berple is correct about the snow removal jobs moving to China.
Are you saying they should declare themselves as sanctuary cities for snowflakes?
Bigly!
Trump threatens to ditch climate science, and global warming ends. Maybe politics really does play a part after all.
+1
+2
+10
And teh oceans will calm.
Or is it politics that is following true science of climate change?
” The Blob as warmists knew it is no more.”
Isn’t that how everyone knew it?
Steve McQueen knew what would stom the BLOB back in 1958
“It’s CO2!, It can’t stand the cold”
The North Atlantic was much colder in the lower (2015) picture. That cold blob in the north Atlantic in the 2015 picture looks comparable to the cold blob in the north Pacific in the 2016 picture. Overall the 2016 picture looks slightly colder. Is it the overall sea surface temperature that is the primary climate driver or are there key locations, like the north pacific, that have more of an impact?
Both…
If the Atlantic current moves a AMO blob into the Arctic….that’s a major impact
…that cold blob was heading south and down
Also, the two maps are comparing late-Fall with mid-Summer in the northern hemisphere. Too bad we couldn’t have had comparisons between comparable time periods.
http://www.ospo.noaa.gov/data/sst/anomaly/2014/anomnight.11.27.2014.gif
The entirety of the map looks far colder now than it did in Aug 2015—Antarctic Ocean and the far southern Pacific and Atlantic Oceans are all colder, the Indian Ocean is colder, and the extent across the majority of the northern Pacific and Niño 3-4 areas are all colder. Yet, I am positive we will hear how November was hotter than October and how December will be warmer still. At the very least we will hear about how 2016 was the warmest year ever recorded, all while making no mention of the El Niño event for the better portion of the year.
When you think of heat content driving both ocean currents and atmospheric conditions, then the Pacific—as a whole, with it’s much greater depths—is far more important to the discussion than other basins. The North Atlantic is important for the Arctic Oscillation and sea ice growth, while the Indian Ocean is important to cyclonic development and the monsoon for that region of the world.
My curiosity is centered on what drives the anomalies of the Gulf Stream off the eastern US seaboard. Heat must be transported from somewhere, and to me it looks like there isn’t much of a pool of warm water from which to be drawing upon to sustain that plume to the NE. Or it might be like the Rossby waves evidenced in the appearance of the La Niña in the eastern Pacific, and showing the slow NE progression of the higher-than-average SST’s in the Caribbean during 2015. If the latter is true, that would potentially indicate that a colder Gulf Stream will become apparent in a few months, which, when combined with the NH winter and cooler North Atlantic, spells a downward trend for the NAO.
Watch Joe Bastardi’s free weather videos (right panel) on weatherbell.com/premium. Today’s is good to explain what you’re asking. The Daily vid will change by tomorrow morning. Doesn’t seen to be an archive for them.
As this cold blob develops and impacts NA weather, I predict a pronounced migration of former political leaders to Hawaii in place of Chicago.
Will there be a recount on the north Pacific numbers as well?
Come on people…we’ve got two oceans here!….LOL
Let’s look at the other blob…
The one in the top right corner…that continues in the top left corner
That’s the AMO blob…..
“Arctic sea ice below normal” “NWP open” blah blah blah
Yes, well
http://www.climate4you.com/images/OceanTemp0-800mDepthAt59Nand30-0W.gif
well exactly….
http://1.bp.blogspot.com/-kM7DmutxKI4/VP4YeTFbarI/AAAAAAAAEbw/Y-9pDgzLR7E/s1600/20150309-AMO-1970-2015.png
But neither one mean squat…you have to keep your eye on the blob
Note how the peak on the graph was around 2006/07. It was by looking at ocean temp graphs That is why I came to the conclusion that the switch point of the climate runs from 2006/07 back to 1976/77, back to 1946/47, back to 1915/16, and back to 1885/86. Those are the pivot points in the climate system where the system changes from warm to cool, or vice versa.
You can also see that in looking at the graph which Latitude posted below. Note the low point around 1976/77, which turns into the pivotal point of this last leg of warming. The next low point from here should be around 2036/37.
That drop is scaring. It is not 0.1K or so, which makes alarm when rising, it is a whopping 1K drop in temperature. I wonder how many missing nuclear bombs it equates to.
That drop is scaring……just looks that way when you only see the tail end
Here it doesn’t look that way….
http://www.climate4you.com/images/NODC%20NorthAtlanticOceanicHeatContent0-700mSince1979%20With37monthRunningAverage.gif
2 other things to remember,
1) the top image is from November when the ocean area is cooling and the ice is reforming
2) the bottom image is from July when the northern ocean is warming and the ice is melting
Except the same chart type for the East Greenland and West Svalbard Sea regions do not look like chart 1 at all and they are farther north.
I looked back at last years graph of the same day of year. The biggest changes from warm to cool have occurred in the Indian Ocean, the North Pacific, and the South Atlantic. I should learn how to post pics here one of these days.
Eyed from below perhaps…
Time-depth temperature diagram along 59 N, 0-800 m depth, across the North Atlantic Current. Temperatures in Degrees Celcius. Source: Global Marine Argo Atlas. Latest month shown: June 2016. Last diagram update: 7 August 2016.
See Time-Depth temperature diagram at climate 4 you
What does the AMO index value represent? (i.e. how is it calculated?)
I see turning points of significance here, if few in number for modelers.
http://www.climate4you.com/images/AMO%20GlobalAnnualIndexSince1856%20With11yearRunningAverage.gif
“Here it doesn’t look that way….”
But when you put the short term and the medium term charts together in perspective, it says a) there is a persistent trend decline in progress and b) that trend is not slowing in the short term chart. The longer term AMO chart with more turning points provides even more perspective. It is the lack of an “extra” long AMO chart with more long-duration cycles that really limits the analysis but enables the arm waving warmists.
I can tell you are not a statistics or modeling person.
I would like to see the map’s colors reversed, where red/yellow is cold and blue is warm just to take away the tendency of your eye to fixate on yellow/red. I don’t have the software to do that but it would be interesting to see how you interpret such a map.
This site has a nice representation for sst and ssta, my favorite. They limited their use of the reds for the top end of the scale. As such, I find it very easy to look at as I compare the changes from one day to the next or from longer periods…http://www.weatherzone.com.au/climate/indicator_sst.jsp?lt=global&lc=global&c=ssta
Blue Blob
Wait a minute. Are we able to detect how much warmth is getting locally into the ocean over a period of time from volcanic processing ? Let us argue further when we are able to present some clues in this matter .
Indeed – is it true that a hitherto unknown volcano has been discovered under the ‘blob’? Do we know what’s occurring along the Gakkan Ridge (under the current arctic warm spot)? Considering the sub-ice glaciers in W.Antarctica that ‘climate science’ never seems to mention, is it time that sub-oceanic/glacier tectonics & vulcanism is studied more closely?
I meant Sub-ice volcanoes of course . . Doh!
Mush implore my prof redding
Live long and prosper from the planet Vulcan
Why no response to:
ChrisDinBristol November 30, 2016 at 11:17 am
Indeed – is it true that a hitherto unknown volcano has been discovered under the ‘blob’? Do we know what’s occurring along the Gakkan Ridge (under the current arctic warm spot)? Considering the sub-ice glaciers in W.Antarctica that ‘climate science’ never seems to mention, is it time that sub-oceanic/glacier tectonics & vulcanism is studied more closely?
does this mean more rain in California? if so then will sanity come back to those retards? it is weird how Cali’s think that water can be squoze from paper and ink. Maybe a brain bore of some type entered the ear canal.
From Night Gallery “The Caterpillar” 1972.
The Climate Hustle in Cali has zero to do with climate. They (Moonbeam’s weather dancer charlatans) know it, we know it, and the general public suspects it (but is too distracted with the Kardashian’s current butt size to care). So the hustle continues b/c they think they can’t be stopped.
Both this month and the last have been above average for rainfall here in Trinity County, Northern California. The conditions are ripe for a potential flood year as the ground is well saturated.
Here you can see heavy water vapor flows moving to higher latitudes in the mid Pacific. From there the enhanced moisture stream will move towards the Pacific Northwest, and increase the average water content as it mixes with dryer air…https://earth.nullschool.net/#current/wind/surface/level/overlay=total_precipitable_water/orthographic=-160.18,34.04,497/loc=-179.988,23.671
Very interesting. Thanks for showing this Anthony. The Pacific has more heat I believe than all the other oceans combined. The oceans of course have over 1,000 times more heat than the atmosphere.
https://wattsupwiththat.com/2011/04/06/energy-content-the-heat-is-on-atmosphere-vs-ocean/
If 2017 is not cooler than 2016, it will be a shocker. Same probably with 2018(cooler than 2016) but this is stating the obvious after the strong El Nino.
If they are as warm as 2016, without an El Nino, then we have more warming than expected(for most skeptics like me).
This article contains an illustration with another warm blob – an anomalously warm blob of air over the arctic…
https://www.washingtonpost.com/news/energy-environment/wp/2016/11/17/the-north-pole-is-an-insane-36-degrees-warmer-than-normal-as-winter-descends/?utm_term=.a0d12aea80fc
More here:
https://blog.metoffice.gov.uk/2016/11/25/an-experts-view-on-unusually-warm-arctic-temperatures/
The polar vortex is split in to two lobes.
It has been insanely cold and snowy across northern Eurasia for the past 4 weeks. That cold will begin sloshing its way around the NH. Arriving in US-Canada come mid-Dec by evolving weather models. People freezing their butts off not going to care that the North Pole is -15C and not -30C to -40C come the NewYear.
The polar vortex can be seen here for anyone interested.
http://www.netweather.tv/index.cgi?action=stratosphere;sess=
Thanks B.j….
Polar Vortex 17500m.
http://images.tinypic.pl/i/00846/avxlgk1ilgo4.png
Differences in temperature at a height of around 20 km in the stratosphere.
http://www.cpc.ncep.noaa.gov/products/stratosphere/strat_a_f/gif_files/gfs_t50_nh_f00.png
Polar Vortex 26500 m.
http://images.tinypic.pl/i/00846/26vvj6yb4axu.png
van Gogh would be envious…
This should enhance probabilities for this winter’s formation of North Pacific weather bombs (aka Explosive Cyclogenesis.) taking aim at the Pacific NW and carrying motherloads of snow and precipe to the Rockies, great plains, and beyond this winter.
Insurers and NE Pacific marine operators take note.
See more here:
https://en.m.wikipedia.org/wiki/Explosive_cyclogenesis
Maybe someone with the appropriate background-education-expertise could expand on this possibility in a WUWT post?
I have been watching the changes in this region for the last month. The potential for a dense stream of atmospheric water pushing into the PNW is high…https://earth.nullschool.net/#current/wind/surface/level/overlay=total_precipitable_water/orthographic=-154.48,41.52,819/loc=-177.329,35.330
I’m disappointed that someone hasn’t taken the opportunity to use the El Nino and the blob, their areas, temperatures, locations… look at the response in the temperature historically and calculate the cooling going forward. Willis, perhaps?
The fact that this and other opportunities (the pause for example) to advance climate science will NOT be undertaken by main stream ‘scientists’ is telling of the politisizing of science. Shame on the pathetic lot of them. Take a shot at such an analysis yourself, Bob T.
@Gary Young Pearse,
Joe Bastardi does. Their forecasts are based on those analogs. Free vids: weatherbell.com/premium. Daily and weekly. Short and sweet. 3-5 min for dailies. 3-20 min for weeklies.
http://www.weatherbell.com/premium
Thanks MRW. I forgot about the good work they do. I guess my main admonishment was toward the CAGW consensus. They definitely do more hoping, praying, and where possible fudging to satisfy an agenda instead of searching for ways to objectively do climate science. The blob and the now obliterated Pause were beautiful phenomena for advancing the science that was ignored by academic researchers.
According to “Tropical Tidbits” the global SST went down about 0.25 K within a time frame of about 1 month:
http://www.tropicaltidbits.com/analysis/ocean/global.png
If it would be the other way around we would read some comments just like: “tipping point crossed” 🙂
Land temps from RSS and the NCDC adjusters fell by 0.6C and 0.5C respectively in October.
OMG, It’s 97% worse than we thought, we’re all going to freeze to death, there’ll be storm & pestilence, mothers will eat their young; we’re doomed unless YOU repent…. by sending money to my account C/O Big Betty’s Beach Bar Barbados.
instead all we hear is…silence
funny that!
One is in NOVEMBER the other is in JULY, so you cant compare like for like.
Think about the word “Anomaly” in the headline of the figures!
Bob’s post from one month ago has better comparisons/animation.
https://wattsupwiththat.com/2016/10/27/the-blob-has-dissipated/
The Pacific NW has been affected by these warm Blob assisted land temps for over two years. To me, the rapid change is the main story. Possible snow is now in the 7-day forecast for the Puget Sound lowlands (Seattle area) and people are already freaking out. If it arrives, it will be entertaining. Keep an eye out for more YT videos of sliding cars and buses shortly afterwards.
I thought the kids,would no longer ever see snow! Gasp!
Yup, they will shutdown the city, people will abandon their automobiles all for a dusting of snow. And of course they won’t try to melt the snow because it will pollute the sound!
Instead of “Cold Blob”, how about “The Warminator”.
It’s going to get very very cold out at the pipeline protest camps.
I love that law enforcement sprayed them with water hoses in near-freezing weather. :D
The campers used shields for the water and a camp fire warming them at their backs. I would suggest to the authorities a combo of water and industrial fans mounted on flatbed trucks next time.
As a resident of the cloudy, forested region of SW Washington state hope to see the N Pacific “cold blob” translate into a semi-stationary H5 trough parked around 120W, plus or minus 5 degrees or so, this winter thus producing one of those very snowy winters we have not seen for some time now.
Could someone answer (what I hope is) a simple question?
Where is the Arctic Ocean and Antarctic region water temperatures on this plot?
Sea ice is excluded.
How about “Silent Blob strikes back”
How about “I’ve Got a Secret” for millennials and their poor choices of ‘news’ and information.
http://www.ospo.noaa.gov/data/sst/anomaly/2015/anomnight.11.26.2015.gif