Guest essay by Roger Graves
The subject of the extent of Arctic ice cover has been much in the news, with an apparently unending series of attempts to predict its future extent on the basis of a relatively few years’ worth of data. However, it is possible to make some general predictions, based on a much longer-term sequence of historical events. Obviously these will not be accurate predictions, since they are based on mere verifiable historical data, unlike, say, the highly accurate predictions of the IPCC based on computer models which no doubt will soon tell us of balmy tropical seas to be found in the Arctic in the near future. Nevertheless, they can still offer a general guide to what we are likely to see in the future.
First, a significant warming of the Arctic was noted in 1922. The U.S Monthly Weather Review of November 1922 contained a report from the US Consul in Bergen, Norway, saying “The Arctic seems to be warming up. Reports from fisherman, seal hunters and explorers who sail the seas about Spitzbergen and the eastern Arctic , all point to a radical change in climatic conditions, and hitherto unheard-of high temperatures in that part of the earth’s surface.”
The article goes on to say “Ice conditions were exceptional. In fact so little ice has never before been noted. … Many old landmarks are so changed as to be unrecognizable. … At many points where glaciers formerly extended far into the sea they have entirely disappeared.”
Second, the Arctic was navigable in the early 1940’s, although people might be forgiven for not noticing it at the time because World War II happened to be in progress then. The Royal Canadian Mounted Police schooner St Roch sailed across the Arctic ocean west to east during the period 1940-1942, and in 1944 made the east to west return trip. During the period 1944-1948 she again patrolled Arctic waters.
The St Roch was not a 30,000 ton purpose-built ice breaker, but was instead a 300 ton wooden schooner. Granted, she was a tough little boat designed for Arctic conditions, but she had no significant ice-breaking capability, so there must have been open water for her all the way.
We also know that when regular satellite coverage became available in 1979, Arctic ice had a much greater extent than it does today. According to NOAA’s data, ice coverage began noticeably decreasing in extent sometime in the mid 90’s. The chart shown below is fig 4.2 of this reference. Incidentally, the September data shown here is an excellent example of how not to apply linear regression. Yes, you can draw a straight line through any collection of quasi-random points and call it a least-squares linear regression. No, it does not magically make the data into a linear progression from larger to smaller, as they have attempted to show in this case. Although I don’t have access to the original data, I would say that the data seems to approximate to a section of a sine wave, which is what one would expect if Arctic ice cover followed a cyclic pattern.
 |
Noticeable melting in 1922, and noticeable melting again in the mid 90’s suggests a warm/cold temperature cycle in the Arctic some 70 years in extent or thereabouts. Further, the St Roch data indicates that a warm peak of this cycle probably occurred sometime in the 1940’s.
For the sake of argument, let us assume a 70-year cycle with a warm peak in 1945. This would place the next cold trough 35 years later, in 1980 (which is not inconsistent with the NOAA data shown above) and the next warm peak at 2015, which is reasonably close to the recent summer ice minimum.
Counting backwards from 1945, a previous warm peak would have occurred in 1875, and a cold trough would have occurred one half cycle earlier, in 1840.
We also know that the ill-fated Franklin expedition to discover the North-West Passage set out in 1845, a few years after this cold trough, when ice coverage would have been at or near a maximum. As we also know, the expedition failed disastrously, which is what one would expect under such conditions.
I will be the first to admit that my arithmetic is only approximate. However, historical data would seem to support a cyclic ebb and flow of Arctic ice cover. Based on the suggested cycle period of 70 years, we can expect Arctic ice cover to increase from the present day until about the year 2050. Anyone about to invest large sums of money in North-West Passage shipping might well be advised to take note.
Lets take a look at the St Roch’s trip – and compare it to that of a certain large cruise liner which made the NW passage without encountering any ice whatever in 2016…
I make no apology for referring you to this: if you don’t like the site, concentrate on the information presented.
http://www.skepticalscience.com/StRoch.html
The ‘St. Roch’ was (indeed, is) an ice-fortified Schooner… a big, tough boat, specially designed to travel in icy Arctic waters
The ‘St. Roch’s’ first trip (from West to East) took about 28 months (850 days), starting from Vancouver, B.C. on June 23 1940 and ending at Halifax, N.S. on Oct 11 1942.
Now contrast it with this…
http://nsidc.org/arcticseaicenews/2016/09/arctic-sea-ice-nears-its-minimum-extent-for-the-year/
Nevertheless, taking advantage of mild sea ice conditions, the 68,000-ton Crystal Serenity set sail from Anchorage, Alaska on August 16 for its 32-day journey through the Northwest Passage via Amundsen’s route. This is the largest ship thus far to navigate the Northwest Passage and is accompanied by an icebreaker ship and two helicopters. The ship sailed through the Northwest Passage in less than three weeks—52 times faster than Amundsen’s nearly three-year voyage.
The NW passage has now been open to ships of all classes on multiple ice free occasions since the millennium.
there can be no comparison with the multi year and heavily ice breaker assisted passages of the 20th century. Crystal Serenity didn’t use its icebreaker support
The NW passage was totally BLOCKED this year apart from the Cambridge Bay, Bellot, Lawrence route
The main part of Parry passed McClure was BLOCKED
Larsen’s 1944 route was BLOCKED,
Amundsen’s 1903 route was BLOCKED
Only modern Icebreakers and modern satellite charts allowed any passage what so ever.
Andy – As you surely must be aware by now, that doesn’t adequately summarise how things have developed this year. Perhaps I might refer you to our recent conversation on Tony Heller’s recently renamed “Deplorable Climate Science Blog”?
http://realclimatescience.com/2016/09/rapid-sea-ice-growth-after-the-shortest-arctic-melt-season-on-record/
Er… no.
The Amundsen route was totally open and the cruise liner and its accompanying vessels just – sailed through it. No icebreaker assistance needed. Also the yacht ‘Northabout’. Again I refer you to:
http://nsidc.org/arcticseaicenews/2016/09/arctic-sea-ice-nears-its-minimum-extent-for-the-year/
“The southern (Amundsen’s) route is open “
Thank goodness for Northabout’s 90hp Perkins diesel and 2000 litres of fuel storage (topped up several times on the trip). They would have been a bit embarrassed without it.
Let me know when the vikings re-settle and start agriculture on Greenland again and when the Statue of Liberty is covered by rising sea level.
Is the sky falling, again?
More Chicken Little BS.
You are right, the Amundsen route was open for a very short period at the end of August.
But at the time Northabout went through, It was blocked.
They used the only open route at the time, through Bellot Strait, not Amundsen’s route.
Na they didn’t use the ice breaker, they just let it go through the passage first, along with the dozens of other icebreakers currently in the Arctic.
” accompanied by an icebreaker ship and two helicopters”
Well whoopee-do !!!
Said icebreaker not of course being used …
And of course Amundsen was actually MAPPING as he went.
Only an absolute idiot would even try to compare the two…
Oh.. Its Griff.. explains .
+100!
At this point in time, IMHO, any responses to Griff’s continued idiocy and unwillingness to learn should be laughter, long and sustained.
St Roch is also powered by sail and 150hp motor. It had a wooden hull, and was 628 long tons.
Crystal Serenity was steel construction, and close to 69.000 ton.
They don’t seem really comparable.
yes… you could not have got the Crystal Serenity through there in any 20th century year
@ griff [you could not have got the Crystal Serenity through there in any 20th century year] hardly she only draws 25ft!
Griff,
How about doing the least little bit of research before spouting off out of total ignorance? A number of big ships navigated the NW Passage in the second half of the 20th century.
https://en.wikipedia.org/wiki/Northwest_Passage#Later_expeditions
…and in 1944 became first vessel to make a return trip through the Northwest Passage, through the more northerly route considered the true Northwest Passage, and was also the first to navigate the passage in a single season.
And that 1944 route has been totally and absolutely blocked all year.
I doubt that even a big nuclear powered icebreaker could have got through.
ps.. and Larsen didn’t have one. !!
You mean this can be a several years trip.
Gee I crossed the Pacific Ocean in about three weeks.
How Long was Shackleton roaming around the Antarctic and climbing all over the mountains of South Georgia; or wazzat somebody else ??
g
’32-day journey through the Northwest Passage’
Boring.
ROFLMAO!
Haven’t you got anythung better to do Griff, like running for the leadership of te Labour party or the Green party?
Keep your hair short and become transgender, and its a shoo in.
Leo, in the UK almost anyone is likely to get a phone call begging them to join the Labour shadow cabinet… its the biggest source of unwanted phone calls lately… 🙂
Or hermaphrodite !
g
More from your first link, about Larson’s second (supposedly easier) journey: “From the beginning of August, they experienced heavy ice – and made slow progress – as well as lots of floe ice, and drifted in the ice-pack at one stage. They had to seek shelter at times but couldn’t determine their exact location at one point because the weather conditions were so bad. At the end of August they experienced lots of heavy, tightly-packed floes and were prevented from landing due to the ice conditions. A lot of the journey consisted of following up leads and anchoring were they could. They found the heaviest ice of the voyage at the entrance to McClure Strait, where they had to moor themselves to the ice floes, and it was only at the beginning of September that the conditions were noticeably different – so much so that it was noted : “It was really the only fine day we had during the entire passage…” (2). After that, it was back to the heavy, tightly-packed ice-fields and the bad weather, with hurricane-force winds almost capsizing the boat before they were able to find shelter. In fact, the “…season was the worst in years.” (1) (2)”
(1) The Conquest of the North West Passage : The Arctic Voyages of the St. Roch, 1940-44 – Inspector Henry A. Larsen, R.C.M.P
The Geographical Journal, Vol CX Nos 1-3, July – September 1947
(2) The North-West Passage, 1940-42 and 1944 : The Famous Voyages of the Royal Canadian Mounted Police Schooner “St. Roch”
Sergeant Henry Larsen, F.R.G.S., Commander Edmond Cloutier, C.M.G., O.A., D.S.P.
So, a lot of ice…
Without encountering any ice of any kind?
Griff, when you decide to tell whoppers, they are big ones.
Then again, everything you say is a lie.
NSIDC “Nevertheless, taking advantage of mild sea ice conditions, the 68,000-ton Crystal Serenity set sail from Anchorage, Alaska on August 16 for its 32-day journey through the Northwest Passage via Amundsen’s route”
Either Griff is totally clueless, or he never bothers to read his cut and pastes.
His response to me proves that his previous post was a lie.
I see nothing in the graph, fig. 4.2 that gives even the remotest hint of it fitting a sine wave, nor do I know of any Physical theoretical basis for expecting it to be a sine wave.
So why do people keep insisting on making such statements, with no foundation for such a claim.
A plot of the raw data is completely consistent with the data. So that is what should be plotted.
G
I confess that was my favorite sentence in the article: “Although I don’t have access to the original data, I would say that the data seems to approximate to a section of a sine wave, which is what one would expect if Arctic ice cover followed a cyclic pattern”.
Don’t try this at home kids, but that right there is what *real* science and quant stuff sounds like.
Griff conveniently forgot to mention Larsen’s 1944 North West Passage transit. From Wikipedia:
Also, by calling the St. Roch a “big, tough boat” he seeks to minimize the accomplishment of a one season passage in a time when there were no satellite images and navigation to make things easier. The point is that the passage was navigated in the nineteen fourties before the catastrophic global warming was alleged to have begun. So the present passages are not unique and not evidence of catastrophic global warming.
If the Crystal Serenity made the passage without aid of satellite pictures, gps, helicopters to scout ahead, and had no goal beyond getting through, then I would agree there is a comparison to be made.
How many times did the St. Roch need to backtrack due to a blocked passage? Were they mapping the route and not so concerned about speed of passage?
It’s similar to the difference between finding your way through a corn maze without a map, vs. finding your way with a map, gps locator, and video from a helicopter overhead. Unfair and meaningless.
“52 times faster than Amundsen’s nearly three-year voyage.”
He didn’t make it through in his first year when the conditions were perfect because he had to stay and do research. I will not say that he could have made it in equally fast time because his boat was not quite the same. http://realclimatescience.com/wp-content/uploads/2016/09/Screen-Shot-2016-09-09-at-5.40.57-AM-down.gif
In a wooden sailing ship with no satellite or helicopters to find the best passage and ice-breakers to save it.
Thanks Griff for that objective summary of the situation. It’s uncomfortable for many, but essential information if we are to understand what is happening in the Arctic.
To which I say, so what? The arctic ebbs and flows and it is documented. Your co2 output has little if anything to do with it. Warmer is better, no doubt about it and I hope we continue to see warmer conditions for the rest of my days.
Hardly surprising that the “big tough St. Roch”, (built in 1928, a 104′ wooden, 8 knot max. schooner rigged sailboat with a 150hp auxiliary diesel), which had already logged thousands of miles “crossing and re-crossing the Arctic, acting as a floating detachment of the RCMP in the North” before WWll and had tasks other than the transit to perform, took longer than a 45,000 hp, 23 knot ship with satellite ice mapping. http://www.vancouvermaritimemuseum.com/permanent-exhibit/st-roch-national-historic-site
The West/East trip was such heavy going that a 300hp engine was fitted in Halifax before the return trip.http://jproc.ca/ve3fab/st_roch.html
The highly publicized “Mainstream Last First” 2013 stunt to row through the “ice free” NW passage (aborted due to ice) was launched on the steps of the Vancouver Maritime Museum, a few feet away from the St Roch on exhibit, without any mention of the history at all. http://mainstreamlastfirst.com/
The Irish windfarm promoter seems to have flushed this signature publicity scheme down the memory hole at the corporate website as well. http://mainstreamrp.com/
Hilarious to read.
“This is the largest ship thus far to navigate the Northwest Passage and is accompanied by an icebreaker ship and two helicopters. The ship sailed through the Northwest Passage in less than three weeks—52 times faster than Amundsen’s nearly three-year voyage”
So Admundsen had no helicopters, no ice breaker, no underwater sonar, no satellite navigation, no maps…..
Lol.
Griff, you have got to be kidding when you compare the speed of the 2016 Crystal Serenity trip to the speed of the Amundsen journey. First of all Amundsen was mapping and exploring while using basically 19th century technology. And just as important, Amundsen wanted to learn the art and science of dog sledding from the Inuit. That skill would be critical as he undertook his ultimate goal years later — being the first to reach the south pole.
Now , put Arctic sea ice, upsidedown against the AMO
http://s19.postimg.org/ld4kvb4s3/amo_vs_NHice.jpg
Oh, come on Andy !

A fuzzy, illegible spaghetti graph with NO AXIS labelling whatsoever. Yeah so they both kinda rise ( once flipped ) . Also AMO is de-trended and you want to compare the trends.
Now replace AMO with CO2 and would be more convincing.
I had an article Climate Etc a few days ago analysing ( principally ) the drift in date of the ice minimum extent. There was a clear change to trend to earlier ice minimum in the decade since 2007 compared to the previous two decades of progressively later turn around.
This may compared to the slow down in the rate of melting which I had previously detected. ( see links in article ).
Same thing with a bezier spline fitted.
Got some appreciative comments from Roger Pielke Sr. who has published on this himself.
Oops, I suppose I should have put a link to the article.
https://judithcurry.com/2016/09/18/is-the-arctic-sea-ice-spiral-of-death-dead/
Re AMO ( or rather non de-trended SST ) I have compare the satellite period and apart from a general similarity in of underlying rise, there is not an obvious correlation. The sorter term variability does not seem to match too well.
You’re linking a graph with an end date of 2016 to another graph with an end date of 2008…
Especially since the 2nd chart’s data actually runs to 2014, but according to the x-axis label, is only graphed through 2008.
I suspect that graphed from 2007 through 2016, that line is flat or rising. Which would further confirm your analysis.
There are lengthy articles concerning both graphs if you are interested. Follow the link provided.
Short answer is filter length. and the trend analysis was last done last year. I need about another month or two of data for the filter before I can up date this year plus the decadal trend graph was done using Cryo Today’s ice area which has not been updated to account for the instrument failure in Feb., so chances are that is a dead end dataset now. Sadly.
If it is not alarming any more they seem to have lost motivation.
BTW if you read you will see it was based on 5y segments, and yes, if the data is continued, I suspect the 2012-2017 segment will be a positive trend.
Sheez Greg! It show’s certainly as much as Gavin’s “LOTI” graph or any other graph put out by the climate regime. No data for 100’s of thousands of sq mile no problem we’ve got an algorithm for that!
And the theoretical basis for the date of minimum ice being a Bezier Spline function is what ??
G
Can you fit it also to the function a.y = b.exp(-k/x^2)
why ct area and not nsidc/dmi/ extent ? ct area is usually all over the place due to the issues with sensors inability to see ice through any melt water sitting on top of it.
Now replace AMO with CO2….
So you’re saying we don’t know squat. Might as well replace it with grain yeilds…..
Hint…stop using area and extent for how much ice….it’s volume…and most of it is under water
No, I’m saying that mess of a graph does not show squat.
”
….it’s volume… ” , what’s volume? What is IT?
Area and extent are very relevant and give different , though not unrelated information. Since we only have very recent volume data and that does not cover the summer months, we work with what we have.
If you look down at a glass of water…..you would never know how much water is in it
What is IT? …how much ice
Area and extent are very relevant and give different , though not unrelated information…..
I supposed…if you want to know which way the wind is blowing
..but there are better ways than that
“Now replace AMO with CO2 and would be more convincing.”
Not to me, Arctic warming is negative NAO/AO driven, rising GHG’s increase positive NAO/AO:
http://www.ipcc.ch/publications_and_data/ar4/wg1/en/ch10s10-3-5-6.html
ulric says “Not to me, Arctic warming is negative NAO/AO driven, rising GHG’s increase positive NAO/AO:”
is that why the decrease of arctic ice extend matches the positive AMO/Nao trends of the last 20 years?
There is an AMO/NAO correlation: when the amo surges up it is paired with extended positive NAO stretches. bringing mild winters to our country. When from 1945 to 1970 the AMO turned negative our country saw historical winters as when the AMO goes negative, it is paired with a negative NAO trend.
the precise driver and correlation of this feedback system is unknown so it’s not sure what drives this correlating duo (meaning AMO drives NAO or NAO drives AMO?)
you sound like the newspapers here stating that this year’s 13th september was the latest day with 30°C or above ever recorded… which was a huge mistake: the latest 30°C or above day occurred on 19 september 1947
that said the stretch of positive NAO winter trends are now nearing their end and soon we will see a string of 30 years of negative NAO surges. I expect them to begin around 2020
Nonsense, NAO has been in a negative regime since the mid 1990’s apart from around the last two sunspot maxima.
I assume that the AMO is measured in exactly the same SI units as is the NH ice, which I presume stands for Northern hemisphere Ice.
AM0 I presume is Air Mass index, but how do you get zero for an atmospheric air mass; the minimum should be one ??
G
But it is a miracle that they both fit the exact same scale.
It’s a good start, thanks.
AndyG55’s matched curves are entirely plausible with an obvious physical basis – the fact that the AMO is nothing more or less than an oscillation in the strength of the Gulf Stream / North Atlantic Drift.
Thus the strong correlation between Barents Sea temperatures down to 150m and the AMO.
This is from the WUWT article:
https://wattsupwiththat.com/2009/10/08/new-paper-barents-sea-temperature-correlated-to-the-amo-as-much-as-4°c/
The AMO is about just the Gulf Stream. What atmospheric phenomenon could change Barents water temperatures at 150m depth by 4deg C? The wind and pressure and stuff is just a consequence of the oceanographic processes driving the AMO and climate in general.
Now let’s look at the idea of ice cycles and whether this is just another one.
This article summarises and links to detailed research collecting ALL available evidence going back to 1850 on the arctic sea ice.
https://www.carbonbrief.org/guest-post-piecing-together-arctic-sea-ice-history-1850
Let’s look at the conclusion:
“First, there is no point in the past 150 years where sea ice extent is as small as it has been in recent years. Second, the rate of sea ice retreat in recent years is also unprecedented in the historical record. And, third, the natural fluctuations in sea ice over multiple decades are generally smaller than the year-to-year variability.”
In other words, what we see is in excess of the limits of any natural cycle… and no, we can’t expect an increase from now onward.
1850?
The coldest period since the end of the ice age?
You astound me!
I had a good read of the carbon brief article when it was last discussed here. It is almost entirely based on limited observations years apart. Now, even if they could not find evidence, and I use the word loosely, of lower melt points in that time frame, I’m not sure that means anything, if the bench mark years were 2007, 2012 and 2016. We can say they are lows via satellites. You literally had years and years of no observational evidence and filled in assumptions from what observations and ship logs then found. The fact there was an assertion it got close in those times is telling in itself.
Nonsense to even compare.
The sea ice is a fascinating aspect though and it is one those on the more skeptical side need a win on, as it is the one the media has scare mongered on so much. IF, and I say IF, sea ice in the arctic starts to recover, that would be a massive win and should cause people to question what they are told a little more often.
“Carbon Briefs”. Sounds like a sort odour absorbing underwear for the incontinent.
So they have not got any a priori options about anything then. Totally objective science obviously.
You want cycles? I have cycles, icycles:
It really is sad the way Griff and Greg latch onto incomplete data and proclaim that it answers all questions.
Sorry to make you sad, Mark. I’ll just wait until the end of the universe so that we can have the “complete” data.
What makes you sad is what is in your own interpretation.
There is a clear circa 5y periodicity on that data. You can make what you want of the rest.
Since we can’t have perfect data, it doesn’t matter how bad the data I’m using is.
The comedy continues.
Then of course there was the North East Passage sailed by Adolf Erik Nordenskiöld, in 1878, where the sea ice doesn’t appear especially low. No modern navigation aids available.
Lee, looking at the chart below, 1878 looks like it might coincide with one of those AMO troughs.. like we are currently in.
When the Arctic sea ice starts to climb from what it is now, over the next several years, are there enough crevasses for the Arctic alarmista to crawl into ?
I was looking at Griff’s carbonbrief one.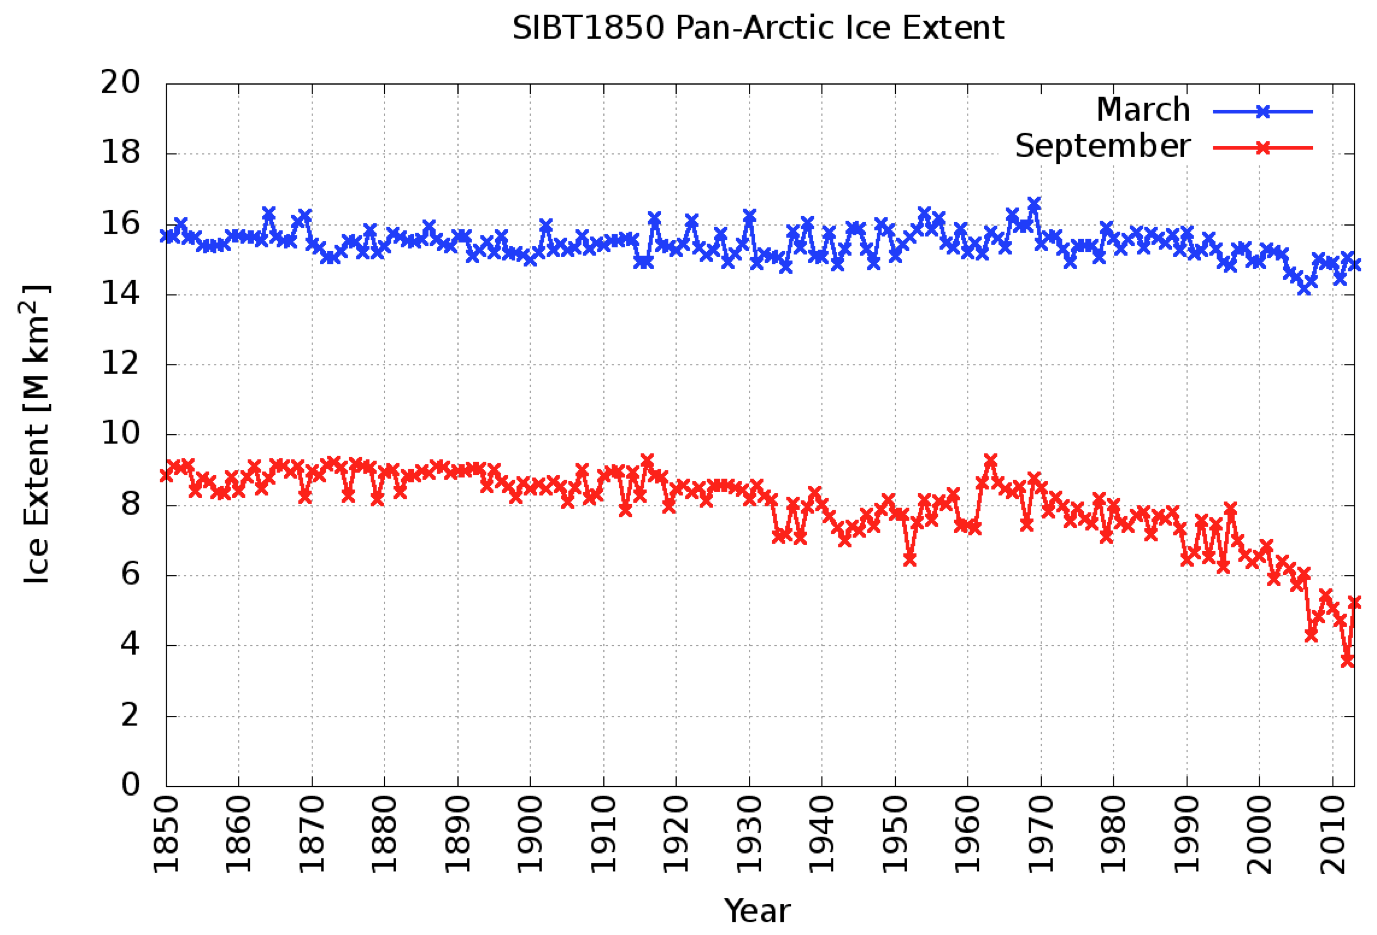
Ah.. another CarbonBreif fabrication. !
Maybe with a bit of Serreze thrown in.
I understand the Russians regularly usethat route!
Of course the Vega had to stop and overwinter before completing its passage in 1879. For the whole of september they had encountered “closely packed drift ice” which impeded their passage, often having to reverse course.
“First, there is no point in the past 150 years”
You mean since the COLDEST period in the last 10,000 years..
DOH !
Since one of the main area of the Arctic that is not land-locked is the area around Iceland. Maybe we should look at the Icelandic sea ice index
You can clearly see the MASSIVE growth of sea ice during the LIA, and that 1979 is actually up there with those EXTREMES.
http://s19.postimg.org/65olaycxf/Icelandic_sea_ice_index_2.png
And if you look carefully, you can see the cycle of the AMO within those EXTREMES
Note also peaks at ~200 year intervals, ie AD 1500, 1700 and 1900.
As I’ve written before, 1979 was at or near the high in Arctic sea ice extent for the past century, ie 1917-2016.
And why does Arctic ice alone count, but not Antarctic, which has been growing since 1979?
@griff
seriously
There’s no way you can prove that. We only have had satellites for the past 45 odd years. Although there are some pretty ice-free pictures taken from submarines at the north pole, Not to mention previous north-west passage transits.
I fully expect the ice to return with a vengeance within the next few years.
“I fully expect the ice to return with a vengeance within the next few years.”
It will certainly be funny to watch the Arctic sea ice worriers when that happens. 🙂
And remember. 1 Wadham = 1 million km² 🙂
Current sea ice area is more than 1 Wadham above 2012 level..
The research I cite does prove that – you can reach the detailed research from the article.
Multiple different record sources have been analysed and that is the meticulously derived conclusion.
The proof is there.
“I fully expect the ice to return with a vengeance within the next few years.”
Most thoughtful observers really hope you are right. The writing on the wall doesn’t bode well unfortunately. This years second lowest extent was in a relatively cool summer (relative to the others in recent years). The ice is thin and young. A couple of more warm summers and we will be talking about the Northern Passage.
Sadly there is absolutely nothing pointing towards any kind of recovery. Only those under serious misapprehensions will be happy if this trend continues.
Any data that supports Griff’s favorite myth instantly becomes conclusive proof.
At least in his “mind”.
The research Griff cites is an example of confirmation bias research.
e.g. The ‘research’ cites using ships logs, oddly only some of the US Navy’s ships are listed.
There are two kinds of reports listed under each ship.
• A) One si a summary report regarding the ship’s assignments and duties. There are some brief descriptions of conditions, but the reports mostly focus on successful operations, not sea conditions.
• B) One is a series of summary ship operations, which might state regions sailed and conditions found relative to the ship’s purpose.
• • a) e.g. A ship delivering supplies around Alaska, simply states delivering supplies. no mention of ice.
• • b) e.g. A ship sent to reconnoiter while searching for signs of the Franklin expedition, actually reports rough ice conditions as passable, not passable, iced in, blocked.
• • c) e.g. A ship actually sent to perform Arctic ice surveys, reports performing the ice surveys and minor hiccups interrupting their surveys
None of the ships’ logs are the daily record of ship actions, problems, solutions, rewards, punishment.
• for the alleged research Griff cites, there are no daily ships logs entered, read, reviewed or considered.
Of special note: where the ship’s summary logs report sea and sea ice surveys, those explicit surveys are not identified nor reviewed.
The research also uses some Danish information, including historic ice charts.
• Charts that are clearly labeled, abbreviated, over the vast majority of the Arctic region, “Ice conditions unknown”.
Meaning, unknown ice conditions are assumed and captured as solid ice cover.
Then there is that lovely little NOAA/MetO/BOM trick of infilling empty spaces with “long term averages”.
I’ve always loved how those alleged record keepers fill in vacant data spaces with assumed long term averages; which they then use for smudging that average over 1200 sq. km…
As is typical of most Griff’s ‘research’ claims; they’ll be discussed for years as how science was misused, right along with Piltdown man, Lysenkoism, etc..
Confirmation bias hooey!
It is amazing how loose standards, greedy liberal arts and pseudoscience graduates, gobs of taxpayer cash coupled with totalitarian political goals can produce such shallow twisted waste of time.
Most professional activities I have been involved in, all of the personnel involved generally have some pride and ambition. Once their mistakes or laziness results are pointed out, they take steps to produce reasonably good work.
A boss of mine had a number of insightful sayings, which I assumed he picked up from his previous superiors. One of his sayings is particularly apt in climate foolishness land.
“People do what you inspect, not what you expect”.
Climate foolishness teams tend to completely ignore all but the most egregious errors. Their research stays in the sound bite spectrums of major media, where all that matters is how their conclusions come across in twitterdumb sentences.
“I fully expect the ice to return with a vengeance within the next few years.”
This has become somewhat of a traditional chant with variations amongst sceptics for some years now.
How long will it remain valid if the Arctic plays awkward and continues to shrink at a steadily decreasing rate? The trend is obviously down, and I see no indication of the fabled rebound.
Gareth:
The trend stopped going down in 2006. Since then, the trend is bottom bouncing yet edging positive.
Perhaps you can explain, Gareth, your lack of perception or understanding, or perhaps a devoted religious belief.
The alarmists have been shrieking about complete ice cap loss, (both poles), for a couple of decades.
From the beginning, alarmists’ have ignored inconvenient historical observations and focused only on the decline.
Facts which you would already be aware of if you paid any attention to comments above.
Nope, Gareth comes in dropping typical alarmist floaters while simultaneously discounting actual observations and reality
Which leaves us scientific method types well convinced that Gareth and his fair weather trolls, plan to deny Arctic ice growth, forever if necessary.
Maybe Gareth will sign up for next year’s polar expeditions?
So Griffter, if it is global warming you are cheering on, explain why it isn’t global! The theory predicts accelerated warming at both poles but Antarctic sea ice and cap didn’t get the memo.
Despite all the ridiculous bloviating over the Arctic/Antarctic and a rash of woeful politicly motivated toilet papers, the theory is still a stinking corpse of money riddled corruption. Since records began Antarctic sea ice has grown; 20 odd years of growth followed by 14 of accelerated expansion.
Last year, in the “hottest year” ever, here in Tasmanian in the cooling Southern Ocean we experienced the coldest winter in 150 years; according to our decidedly warmist bureau of meteorology. And I only cite this as an example of the global verses local paradox that nobody seems able to address rationally.
Speaking of paradoxes, the Pan Evaporation Paradox – 50 years of steep decline (1950-2000) – blew the theory* away at the starting blocks but no one seems to have noticed.
* H20 feedback didn’t happen, it declined for 50yrs. Fifty years… now that’s Climate “Change we can believe in!”
Yes Griff give us a reason the Antarctic is not experiencing polar amplification? Or is CAGW bi-polar?
Not this year. The Antarctic sea ice is more than 2 million sq km below the 2014 value, and at new low for the date
Richard Barraclough says: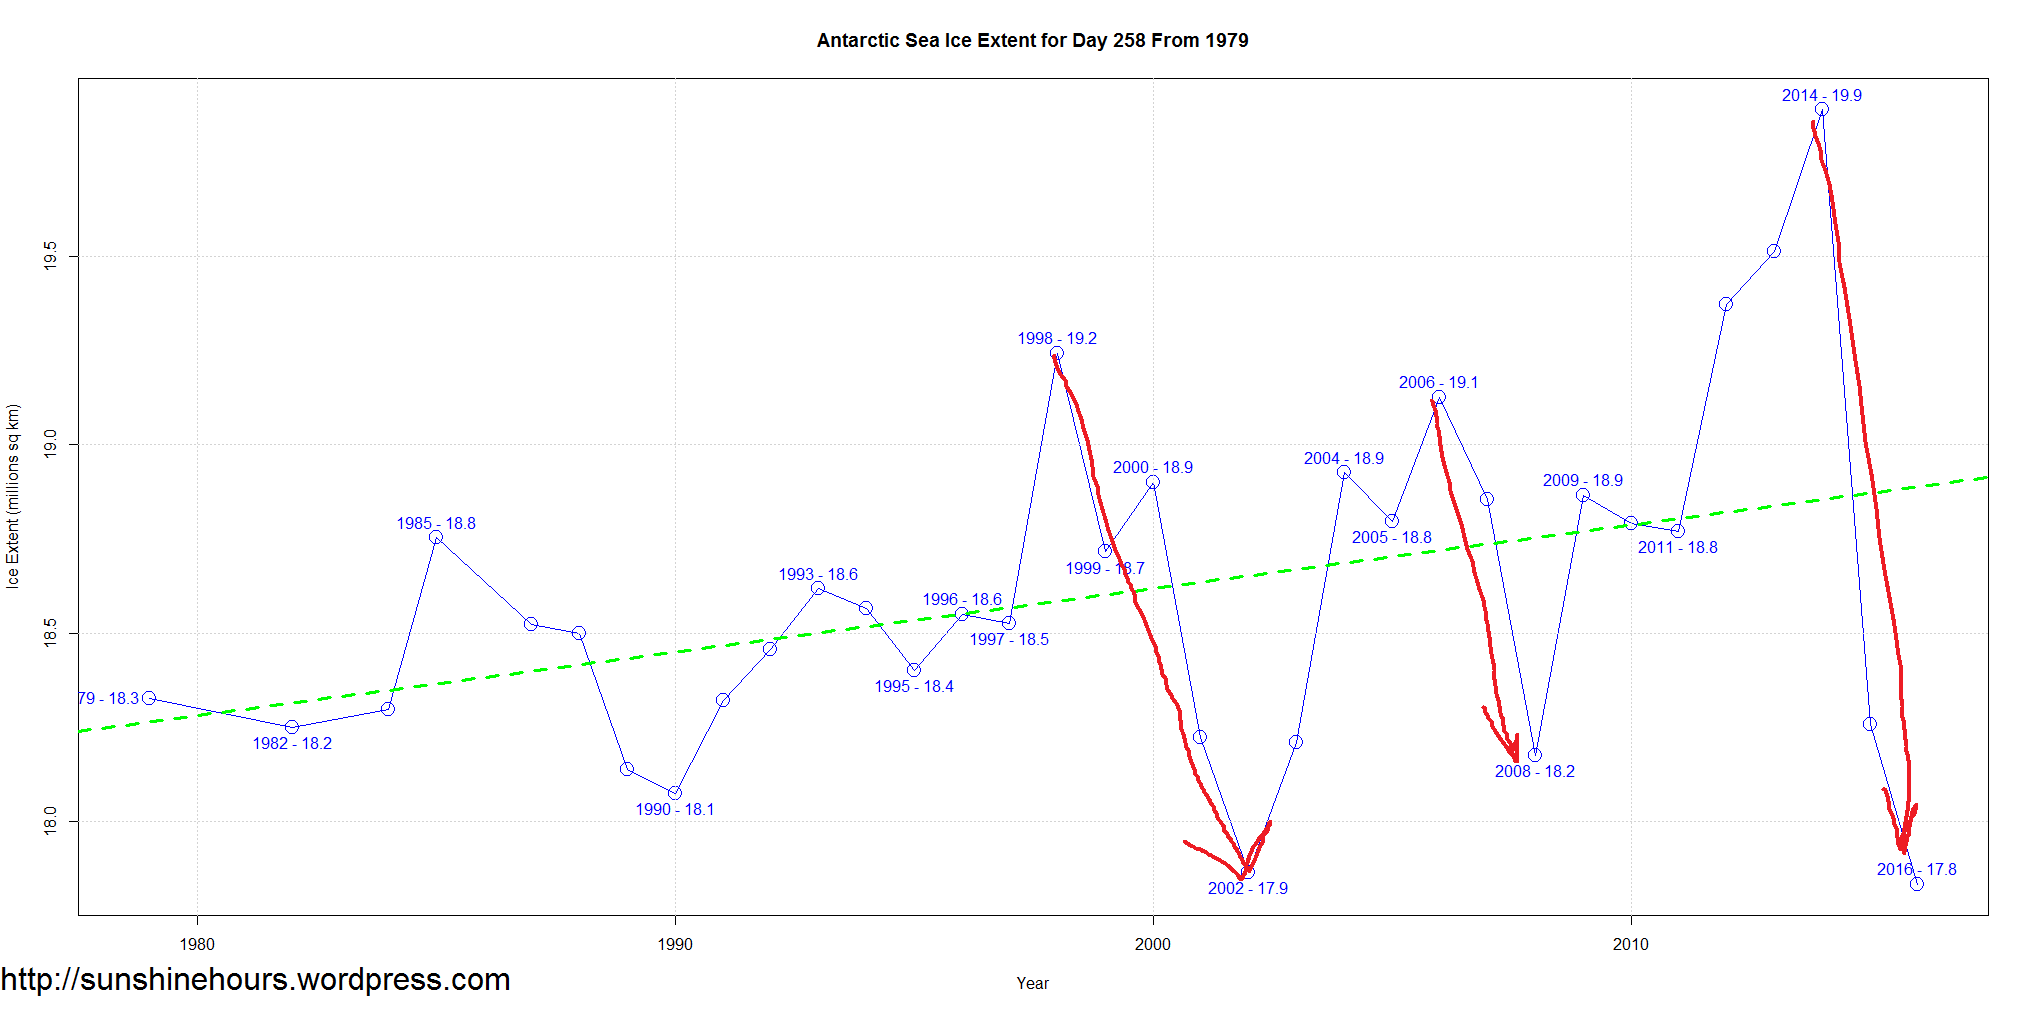
Not this year.
One year is meaningless. Here’s the trend:
Exactly – but what an amazing swing within 2 years.
I was trying to point out that a few comments seem to assume that Antarctic ice is still at an all-time high, just because it was recently. Whither the trend? Who knows?
By the way, which website do you use to find the daily values?. I used to download them from Cryosphere Today, but that seems to have died a death – or at least its satellite has.
New Low!!
Horrors!
Will the ignominy never end!?
Y’all are mighty amusing.
Antarctica is still well within 2 standard deviations.
It has been suggested multiple times, especially after observing similar cycles on other planets and planetoids; that polar melt freeze cycles might be in opposite cycles.
Imagine that, Antarctica 9/25/2016:
http://nsidc.org/data/seaice_index/images/daily_images/S_bm_extent_hires.png
Antarctica extent 9/24/2016:
http://nsidc.org/data/seaice_index/images/daily_images/S_stddev_timeseries.png
And everything is still within normal! Even very short cycle normal.
ATheoK September 25, 2016 at 11:08 am says
Antarctica is still well within 2 standard deviations
I know that’s what it shows on the graph, but I do wonder about the relevance, or even the accuracy of that statement .
We have 38 years of data from the satellite record, and, assuming the yearly values follow a normal distribution, then we can expect 4.5% of them, or 2 of them, to fall outside 2 standard deviations from the mean. In a perfect normal distribution this would be the highest and lowest values in the sample.
Of course, the yearly values in such a small sample are unlikely to behave exactly as a normal distribution, which means that there’s about a 50% chance that the lowest value recorded (or indeed the highest value) will be inside 2 standard deviations. So, if the shading on the graph is to be believed, none of the values over the last 38 years fall more than 2 std devs below the mean – and presumably there are one or two above that range
I guess that means the distribution is slightly skewed, with a small number of years having an unusually large positive anomaly, as we saw in 2014
I see that Griff is still trying to pretend that observations of one or two points is the equivalent to satellite coverage of the entire arctic today.
Griff has to lie, the truth doesn’t support his favorite myth.
Griffypoo:
Your trying to use a paper that cherry picked arctic information, swedged in stretched assumptions and are claiming the results as new gospel.
In the process, the author’s ignore many sources of more accurate Arctic information.
We almost admire how proud you are of that nonsense, but it is still nonsense you are peddling.
Please note all that the carbonbrief article is only a summary of the research it refers to – the conclusions are based on the detailed research…
The carbonbrief article provides links to the research.
The research provides links to their data sources.
Cherry picked vague allusions framed as data with many if not most data swedged in by gross assumptions.
The article and the research it refers too should be printed on toilet paper so there is at least some benefit.
Looks like they used Mike’s “nature trick”. … let’s splice some real data onto some crap and proclaim we actually know something.
Without Satellite data from between 1850 and 1980 …. all you have is more crap!! …. draw the picture that you want, and say you are genius.
How can variations over multiple decades, be less that ANY shorter time interval anywhere in those decades. That is a logical absurdity.
G
Griff, I’m going to have to reiterate what a few others have said; comparing data from the 1800’s with today’s satellite observations is futile and misleading.
One of my specialties (and a subject I publish on) is measurement, statistical modeling and the design of experiments. The study you’ve quoted has a classic problem I’ve been aware of for many years but I don’t think it has a name so I’ll just describe it. When a new measurement technology comes along, for example satellite measures of ice extent, it invariably results in a plethora of publications that use words like “unprecedented” to describe the findings. It’s very similar to watching a child experience the joys of a new toy on Christmas morning and it’s easy to be drawn into that exuberance, but it’s important to remember that the “newness factor” is in play. After a few months the joy is lost, reality sets in, and the child puts the toy back in the closet. The point of this is, a new tool brings a fresh perspective, which is good, but all to often the people using it lose track of the fact that what they’re observing isn’t “unprecedented” at all, it’s just something no one has observed before because they weren’t looking. “Nothing to get hung about” as the Beatles would have said. Strawberry Fields forever. It’s very frustrating to watch one scientist after another use this tactic to get attention; it’s professionally repellent because it’s designed to deceive the layman and take advantage of their ignorance.
We can’t, as scientists, expect to take sparse ship log data from 1850 that may, with a good strong tailwind, have decadal temporal resolution and spatial resolution representing a minor fraction of the area studied, then compare it with spatially comprehensive satellite data that has a temporal resolution measured in minutes and hours. It’s an invalid procedure. It becomes blatantly deceptive when the authors fail to make the deficiencies of the data set known to the reader in Capitalized Bold Face Type.
This is a fundamental measurement problem and it effects all sub-specialties of climate science. Because climate is such a slowly changing system with very long cycles, any statistical analysis performed necessarily depends on high resolution temporal and spatial records taken over very long time series. These data simply don’t exist and, absent the invention of time travel, never will. The temptation to use proxies is huge, and the literature is full of studies based on dendrochronologies, isotope decay, ice cores and other “best available” data sources. Often those studies either omit or understate the uncertainties inherent in these derived metrics. One of my favorite examples is Mann’s original 1999 paper that presents temperature proxies dating back hundreds of thousands of years BP with 1C resolution based on tree rings and calculates atmospheric CO₂ through use of boron isotope decay in fossilized foramanifera. That’s just deceptive. There’s absolutely no possibility a measure of CO₂ dissolved in sea water, as recorded by fossilized plankton, then used to estimate atmospheric CO₂, can be legitimately combined with instrument measures with ppmv precision. To suggest otherwise is absurd.
Hopefully you now understand the problem better. It’s not a failure of theory, it’s a failure of observation. The measurements needed to support these projections and predictions of doom and dire consequence don’t exist. It does no one any good to shout “least ever!” or “hottest ever!” or “fastest ever” in an environment where “ever” means “in the past 100 years” when referring to a system that changes in geologic time. One of my very favorite concerns, as voiced by climate alarmists, is that even though we know the climate of Earth has made excursions into and even beyond the conditions observed today, it’s “never happened so fast before”. That’s laughably nonsensical. A cursory review of C¹⁴ dating shows that measures older than 2000 years BP don’t have the resolution to record changes occurring over a 100 year period; any claims made to the contrary are simply hot air.
So I would ask anyone involved in these conversations to first consider the underlying measurement problems faced by these disciplines, and to evaluate any conclusions made by them in light of those considerations?
“””””….. Because climate is such a slowly changing system with very long cycles, any statistical analysis performed necessarily depends on high resolution temporal and spatial records taken over very long time series. …..”””””
Well actually statistical analyses don’t depend on anything at all, other than the existence of a finite set of finite real known numbers that can be anything at all.
The magic, if you want to call it that is simply the algorithm from the text book that you want to apply, and statisticians can and do make those up whenever they want something new to do.
There is no dependence on the data set at all.
G
If you have an interest and don’t follow Climate Audit there is a recent example of what you discuss shown in this comment https://climateaudit.org/2016/07/21/joelle-gergis-data-torturer/#comment-771132
Bartleby
+1
Excellent comment
Please put this into an article!
@HAS: Thanks for that 🙂 I’ll say it’s sometimes nice to see people who use the same stats tools I do. Unless I miss my guess those scatter plots were produced using StatView, maybe JMP.
You’re right (in my opinion) to point out the deficiencies of proxy measures in paleoclimate models and you have my regards for bringing them to my attention.
Bartleby–thanks so much for the incisive, insightful comments. Yes, by all means please put this into an article. It clarifies our ignorance in a wonderful way and expresses well why Steve McIntyre has used the term “dendrophrenology.”
And I’ll thanks you very much for the sentiment. I won’t be presenting an article on the subject, not because I fear retribution, but only because I have made that effort in the past and I’m no longer inclined.
Thank you for your considerate and heartfelt encouragement.
And I’ll thank you…
I truly don’t like WordPress 🙂
BTW, for Paul and Clio, f you’re interested in an early attempt to explain this problem in a Socratic format please click on my “handle” (Bartelby) and you’ll be transported to a short treatment I wrote on the subject of measurement problems in the climate sciences titled “Technocracies, theocracies, bureaucracies and full contact sports”.
If this is more or less real, you wouldn’t expect to know anything about “the limits of any natural cycle” measuring from 1850.
Although not the Northwest Passage, the German auxiliary cruiser Komet transited along the Russian coast in August 1940 from the Atlantic to the Pacific although it did have aid of Russian ice-breakers.
I know it’s only wiki but, https://en.wikipedia.org/wiki/Nimbus_program indicates that the earliest satellite images of the extent of polar ice were in the mid 60s. While this data was included in the IPCC FAR it has been dropped from more recent reports, probably because it didn’t fit the narrative. No one wants to be told that there was less ice in the mid 60s than there is today.
yes, but we have the cold war submarine records, the DMI records, the records of ice off Alaska collated by the University of Alaska, extensive Soviet records, etc , etc, collected now into one set of research as I noted above.
What are you going to do about it? What could you do about it? Nothing and nothing. Nature flux’s, sometimes largely, sometimes quickly and CO2 abatement will not stop any of it.
The 1964 Arctic Sea Ice Extent in the following graph is a composite of early Nimbus satellite data and Alaskan and Russian sea ice charts, because the 1964 satellite data was not complete. Note that on the X as the years 1965 – 1978 are NOT filled in and that there is no space left open for these years, which would give another impression of the whole period. In that case the years after 1995 would clearly show up as an anomaly, but whether they are an anomaly depends on the real data for the missing period.
From https://polarbearscience.com/2013/06/16/nsidc-says-the-sea-ice-minimum-in-1964-was-not-different-from-1979-1981-or-2001/
In the early nineties there was a big pulse of Warm Atlantic Subsurface Water (AW) entering the Arctic. It flowed along the Siberian Coast and reached Canada ten years later, being cooled down:
“ The first evidence of a recent warming event in the AW layer of the Arctic Ocean was found in 1990 in the Nansen Basin. Positive temperature anomalies of up to 1°C, associated with this 1990s pulse of warm AW, moved downstream and reached the Makarov Basin by 1993. By the time this pulse reached the Canada Basin in the early 2000s the positive temperature anomalies were only up to 0.5°C.”
The authors suggest that the warm subsurface lost its warmth to the surface:
“We suggest local atmosphere–ocean and shelf–basin interactions influenced by anomalous openings in ice cover likely play an important role in ventilating the ocean’s interior.“
Source: Warm Pulses of the Atlantic Water Layer Entering the Arctic Ocean. http://journals.ametsoc.org/doi/pdf/10.1175/2010BAMS2921.1
WR: Another pulse of warm Atlantic subsurface water was entering in the early 2000’s. All this warm subsurface water could at least be a part of the reason for the ice melt in the nineties and 2000’s. The melt at least partly came from the subsurface.
It would be interesting to know more about those pulses of subsurface water INTO and OUT of the Arctic. About both the quantity and the reason why they come from whether the Atlantic or the Pacific. Pulse In = Pulse Out.
A more stable period without a considerable instream of subsurface water will mean cooling of the Arctic subsurface waters. In that case, ice extent can grow.
Is that really credible that warm water down below could lose heat up and out of the surface ??
Why doesn’t it go down and contribute the earth core million deg. C Temperature ??
g
george e. smith September 23, 2016 at 10:14 am
Is that really credible that warm water down below could lose heat up and out of the surface ??
WR: the authors measured a cooling down of the whole pulse during its trip around the basin. The long period could play a role. Also there seems to be some movement along the continental shelves. Read the article for more information. Interesting figures.
I would suggest digging out the data from 1966 from the Nimbus AVCS data..
1940 sounds about right, as a cooling cycle set in from that point until the mid 70s.
The St Petersburgh Institute of Arctic and Antarctic Research has studied the Arctic ice and found a 60 year cycle, with the low point for ice reckoned to be in 2012 and then increasing. The study was based on Russian ice records. The book was published in 2007, and in English as “Climate change in Eurasian Arctic Shelf Seas” Ivan E Frolov et al, Praxis Publishing 2009.
The book also gives short shrift to CO2, and explains why.
The trend in Arctic sea ice since 2006 has been essentially ZERO.
It will certainly be interesting to see where it ends up this Arctic winter.
It bottomed out early and has climbed quite quickly from its low point.
http://s19.postimg.org/425r9zipf/Arctic_ice_area_trend.png
Taking individual minima the last decade has a totally flat trend. However, that may be slightly optimistic due the presence of a circa 5 year periodicity. It may take a slight downward trend next years. Essentially it has stopped over the last decade though.

That’s for those investing in canary futurs. I prefer to use more than 1 day per year when we have 365 days of data.
Here is the rate of change ( full 365d data ) with some low -pass to remove most of the annual cycle.
We see clear evidence of a negative feedback after the OMG events in 2007 and 2012.
Why use all 365 days of data, and then throw it away again with a low pass filter to remove daily changes ?
Why not just pick on a day say in June, or wherever the half ice loss occurs, and simply report on the amount on that day.
Only need to measure for one day then.
G
What’s it look like if you take it back to 1979?
this is misleading… clearly with a second lowest extent this year the ice area is still not recovering and taken as a whole it is down…
I find the use of the word “recovering” misleading. As if the ice suffered from some kind of diease. It is normal for the ice extent to vary.
and now it is varying in a continuing downward trend… ‘recovering’ is the adjective used by those who dispute the trend, not me
Griff says:
… ‘recovering’ is the adjective used by those who dispute the trend, not me
just after saying:
the ice area is still not recovering and taken as a whole it is down…
Goldfish have better memories.
I’m using the term as understood by those of a contrary view there… just to promote understanding… 🙂
The sea ice HAS been recovering from the extremes of the LIA and the 1979 peak.
A lesser amount of sea ice would be an absolute benefit to all those living up there..
Fishing, commerce, travel, all become possible again.
If Griff understood half of what he thought he understood, he still wouldn’t understand anything.
Hey Griff give us a date when the artic will be totally ice free.
I was wondering how long it would take for Griff’s shadow to emerge from his monotonic lair.
Are you worried about arctic sea ice? What are you going to do about it? Why aren’t you worried about Antarctic ice expansion that is occurring? Your ilk…your ilk….tisk tisk tisk.
Brian mentions the Russian research AARI studies of ice charts over more than a century. They also find a quasi-60 yr. cycle in extents.
https://rclutz.wordpress.com/2015/12/23/arctic-sea-ice-self-oscillating-system/
Ron, I hope you liked my Bundy Bear link. 🙂
I did not know a polar bear could speak Australian. But then we mostly have teddy bears here.
Nice link. The Russians don’t have climate politics. It seems that the only model that predicted the global temperature development near actual satellite temperatures was Russian.
The following figure seems to be a plausible one to understand what is happening in the Arctic:
Indeed Wim. That model is INMCM4 from the Russian math institute. I actually discovered that one was the best of 42 CMIP5 models and posted on it:
https://rclutz.wordpress.com/2015/03/24/temperatures-according-to-climate-models/
Thanks again. Worth to repeat your conclusions on this model. Oceans, H2O and CO2 are weighted different:
Curious about what makes this model different from the others, I consulted several comparative surveys of CMIP5 models. There appear to be 3 features of INMCM4 that differentiate it from the others.
1.INMCM4 has the lowest CO2 forcing response at 4.1K for 4XCO2. That is 37% lower than multi-model mean.
2.INMCM4 has by far the highest climate system inertia: Deep ocean heat capacity in INMCM4 is 317 W yr m^-2 K^-1, 200% of the mean (which excluded INMCM4 because it was such an outlier)
3.INMCM4 exactly matches observed atmospheric H2O content in lower troposphere (215 hPa), and is biased low above that. Most others are biased high.
So the model that most closely reproduces the temperature history has high inertia from ocean heat capacities, low forcing from CO2 and less water for feedback. Why aren’t the other models built like this one?
Thanks for raising the issue of climate history irt the Arctic. History supports the skeptical position that the Arctic is dynamic, and will have large swings in ice coverage. The climatocracy avoids history, except for the kind that can be rewritten.
Here is a synopsis of Frolov et al book referenced by Brian
https://rclutz.wordpress.com/2016/03/02/the-great-arctic-ice-exchange/
where Frolov fails is in recognising that the ice in the central arctic is not now thick/old multi year ice…
Whereas in the past the ice circulated clockwise in a multiple year cycle, with a thick fast ice area against the Canadian shore, is has become ever thinner and younger – and as it did this year the fast ice is becoming dislodged and of less extent.
The arctic cyclone of 2012 would not have made the same impact on pre-2007 ice… nor would this years storms.
Frolov describes the arctic ice circulation and Fram export well… just doesn’t add in the effects of warming
What you are missing Griff is that the circulation regimes switch between cyclonic and anticyclonic. Frolov knows more about this than you.
Basically anyone know more about this that Griff does. !
My duaghter’s stuffed panda knows more than Griff does.
And he two cyclones in 2016?
i hear a desperate cry from griff to say the arctic is doomed….
is that why skepticalscience their graph of multi year sea ice ends at 2012? Of course after 2012 you will see a recovery of multi year sea ice. and they don’t like it.
the very important thing you forget in your statement is that a lot of your “pre 2007 ice” doesn’t exist anymore since the huge melt of 2012. so a lot of your “pre 2007 ice” became “post 2012 multi year ice”.
and that very important fact is something skepticalscience doesn’t mention.
so in short: we see a tie with 2007 in arctic ice extend, however compared to 2007 the ice was in worse conditions then it was back then coming from the lowest maximum ever. and with the highest record temperatures ever.
something doesn’t add up here
how does a “record low maximum, record high arctic temperatures, a worse then pre 2007 multi year ice state and even a record high positive PDO not add up to a record low ice extend?
Frolov’s research is actually spot on: storms can accelerate the gyres in the arctic, what exactly happened in 2012 which causes a bigger transport out of the Fram Strait.
actually arctic sea ice extend is a very bad value to say what happens as wind patterns can -like in May this year- influence arctic ice thickness and extend. It drives it even more then the melt.
what the doom and gloombelievers in May did forget was that all the ice blown off shore from Alaska didn’t melt, it got stacked, making the ice more resilient to melt. making an absolute record low very unlikely. That’s exactly what has been said here on this site, and it did become true.
so technically and scientifically the ice is recovering. however to be sure we need the ice volume value. the PIOMAS data shows no second lowest Arctic sea ice volume… So far all the doom and gloom is gone…..
Arctic sea ice fluctuates and fluctuates largely over spans of time. What do you suggest we do about it? Foolish alarmism. The answer? NOTHING! Because there is NOTHING you do that will prevent these oscillations from occurring.
“Based on the suggested cycle period of 70 years, we can expect Arctic ice cover to increase from the present day until about the year 2050.”
Based on the shape of the cycle, we can expect the AMO to stay warm for another 20 years. And based on it’s apparent relationship with sunspot cycles, we can expect two more warm phases to the AMO, between the maxima of SC24 and SC25, and again between the maxima of SC26 and SC26.
It does not match pre-1990 too well by the looks. The early 20th c. rises about 30y too late to be the cause and you’d need a fair bit of AGW to make the end but match. I’ve seen this graph several times, not a very convincing causal relationship on the face of it. Sorry.
One thing I never understand is why people want to use a detrended AMO, unless you already “know” what caused the linear trend that you have removed.
Well patently the AMO didn’t rise 30yrs too late to warm the Arctic. If you plain ignore the phase change between the two data sets, there certainly is not a very convincing relationship, any fool can do that. AGW increases positive NAO/AO according to the models, that won’t warm the AMO and Arctic, they warmed from 1995 onwards because of increased negative NAO/AO.
http://www.ipcc.ch/publications_and_data/ar4/wg1/en/ch10s10-3-5-6.html
“If you plain ignore the phase change between the two data sets, there certainly is not a very convincing relationship,”
It is you who is ignoring the phase shift because you did not account for it or even mention it. Science is not based on channelling what you thought, it is based on what you present. If you think there should be some temporal lag ( not sure why a fixed lag would be appropriate ) or more likely you want to relate the derivative of one to the other, then do so and plot it. Don’t expect readers to do a mental derivative and correlation in their heads. Say what you think it should be and plot it. Maybe you’re right.
Well if you had really already seen the chart several times, you would have seen me mention the phase shift.
So what are you going to do about it? And why would you try? Nonsense…all of this.
I can see the connection clearly. They are both going up and down as if one causes the other.
Does the wood cause the trees, or verse vicea ??
g
Here is a good animation showing the history of arctic exploration and the construction of the map of the Canadian Arctic – starting in the year 1497 (or 1500 when Greenland was rediscovered).
It is about 4 minutes long so it is only for those who are really interested. Note the majority of these expeditions would have been made in wooden sailing ships at a time when no one had a map of where they were going and had no satellite pics to tell them where the ice conditions would be better. They were just exploring and/or searching for the NorthWest Passage. There is no way there was more sea ice during these times because these wooden ships with no engines were not going through any pack ice.
There was way more expeditions that you imagined.
Excellent idea, thanks for that.
The point is Bill, there is way less ice now than at the time of any of those expeditions…
Ha ha, you are a one note thinker. You do not have enough evidence to support that claim.
I posted link via a carbon brief article to the evidence tommy – and another link to an article on Judith curry’s blog citing more historic ice level evidence in detial
Griff,
Please don’t try to convince us of your confirmation bias so vividly. There are very little real data from 1850 to 1950, to be making overconfident conclusions from.
You have ignored the valid satellite data from 1972-1979,because it showed a much lower ice level in the Arctic,1979 is the HIGH point in the entire satellite data, which creates a misleading slope.
As has been pointed out time and again, the evidence you have presented does not support that conclusion.
There probably was more ice then, during the LIA than now. So what?
But had they known the route and had more provisions, some of the 19th century explorers might have gotten through, as Amundsen did in 1906.
The fact is that Arctic sea ice has been as low as now at various times in the past century, to include even the satellite era in the 1970s, and during the Holocene has been lower than now for thousands of years, let alone in prior, warmer interglacials. Nothing at all out of the ordinary is happening now.
Sunsettommy,
Do you believe that the world has been warming since the Little Ice Age ended?
Do you believe that worldwide glaciers have been on average receding since about 1850?
Do you believe that sea level has been on the increase since around 1850?
Then you must logically believe that Arctic Sea Ice has been on a decreasing trend since 1850. To believe otherwise would be illogical.
Javier:
Oh!?
With that kind of rationale, then the Antarctic should be declining.
The sea level has been increasing since the last Glacial Maximum.
There has not been any acceleration in sea level rise since 1850, or 1950.
Not all of the world’s glaciers are retreating.
Whales are increasing in numbers.
Polar bears are frightening numerous.
Walruses have multiplied, so have sea lions and seals.
Al of that alarmist crap is meant to scare, not enlighten.
Javier says:
Then you must logically believe that
ArcticGLOBAL Sea Ice has been on a decreasing trend since 1850. To believe otherwise would be illogical.^Fixed^. If you’re going to be ‘logical’, then stop selecting Arctic ice, which is just cherry-picking. As Prof Feynman said, you have to take all the evidence—not just what supports your belief. Because you are the easiest person to fool.
Global sea ice is normal. The original ice scare predicted that polar ice would disappear. That did not happen. So in order to rescue that failed prediction, the focus has shifted to the Arctic, while the Antarctic is ignored.
Dr. Spencer points out that there are natural explanations for Arctic ice variability:
http://www.drroyspencer.com/wp-content/uploads/AO-DJF-cumulative-since-1900.png
Natural variability is the default explanation. It will remain the most likely explanation so long as polar ice remains within its long term parameters. That is what we’re observing. There’s still plenty of Arctic ice, and the Antarctic ice trend is still positive. Keep in mind that the planet is still recovering from the LIA, and it is to be expected that polar ice will naturally be reduced due to a warmer planet.
What we’re observing now is completely normal. The Arctic has warmed up cyclically for as long as Arctic ice extent has been observed. There is nothing unusual or unprecedented happening now, and there is no indication that polar ice will disappear (the original, falsified prediction).
Finally, the variable polar ice explanation has not changed since John Daly wrote about the “Arctic ice” scare more than a decade ago. Well worth reading:
http://www.john-daly.com/polar/arctic.htm
Antarctic has been going opposite to Arctic for the entire Holocene, as it is doing now.
Sea level actually decreased after the MWP during the LIA.
That you can find a glacier responding more strongly to local conditions does not change the general trend.
There are lots of articles here at WUWT explaining these things. You should read them.
dbstealey September 23, 2016 at 12:12 pm
Nice to see your comment, dbstealy! I enjoyed your 1922 Monthly Weather Review link “normal”!
But the other one, Dr. Spencer’s points, doesn’t show up. Could you post another one?
then i still wonder what the ice extent was in the MWP. i bet “worse” the it is now seen the fact a lot of the viking settlements are still frozen in the permafrost since the LIA.
and then we didn’t even start to talk about the holocene optimum…
You know a lot is still unknown.
maybe a good start is the 4000 year old trees that grew in the alps, discovered by the retreating glaciers. you know that glaciers do move, so those trees came from higher up then where they were found. instead of reading all the panic, i do ask: “how warm was it that trees were growing on places where the only thing you can see is….. ice”?
Perhaps that’s a good start.
First you have no idea if that is true or not. 2nd, what are you going to do about it and how? Idiocy…pure idiocy.
Thanks, Bill.
That was great. Love the Age of Discovery. Iron men in wooden ships.
Arctic sea ice appears to have entered a pause in the last 10 years since its big fall of 2007. This phenomenon appears to be linked to sea ice dependency on AMO. It is expected that AMO will start going negative in the near future, so Arctic sea ice is likely to remain in pause or even increase during the next decade.
http://i1039.photobucket.com/albums/a475/Knownuthing/osisaf_nh_iceextent_seasonal2_zpsyk3pbipl.png
http://i1039.photobucket.com/albums/a475/Knownuthing/SeaIceProjections2_zpssnsxjkwv.png
http://i1039.photobucket.com/albums/a475/Knownuthing/amo2_zpsju5oxkfp.png
More damned de-tredned AMO.
If ice coverage is linked to SST how on earth does it know to ignore the linear trend part of AMO? Jeez.
Yeah right. I guess you didn’t noticed that this is a non-detrended AMO graph. Do you see the straight dashed trend-line?
AMO is a de-trended index. If you take an arbitrary snip out of it there well may be a trend in that.
Maybe if you included a ref for the data it would be helpful to know what it is. If it is just N Atl SST , it should not really be called AMO.
Just because you say so doesn’t make it so.
Trenberth, K. E., & Shea, D. J. (2006). Atlantic hurricanes and natural variability in 2005. Geophysical Research Letters, 33(12).
“Indices of the AMO have traditionally been based on the average SST anomaly for the North Atlantic north of the equator [Enfield et al., 2001] (Figure 1), where the SST (from HADISST [Rayner et al., 2003]) northern limit was kept at 60°N to avoid problems with sea ice changes. We use a 70-year (1901–70) base period as it covers roughly one full cycle of the AMO. The AMO is given by smoothing from a 10-year running mean [Goldenberg et al., 2001; Enfield et al., 2001] or similar low-pass filter (Figure 1). In most cases the variability has been highlighted by detrending the data [Enfield et al., 2001; McCabe et al., 2004; Sutton and Hodson, 2005; Knight et al., 2005], and a linear trend is provided in Figure 1 for reference. The index reveals a warm period from about 1930 to 1970, while cooler regimes occurred from 1902 to 1925 and 1970 to 1994. Since 1995 the AMO index has been positive and increasing.
Figure 1. Annual SST anomalies averaged over the North Atlantic (0 to 60°N, 0 to 80°W) for 1870 – 2005, relative to 1901 to 1970 (°C). The heavy line with fill depicts the AMO and is from a low-pass symmetric filter with 13 total weights and a half-power point at 16 year periods, with the end points reflected. The linear trend fit is also shown (dashed).
It is the right thing to compare to, and it shows a remarkable coincidence. So yes, you were wrong in both of your comments.
Javier:
Your own quote states that the AMO is detrended, plus smoothed.
About those “Cea Piron, MA and Cano Pasalodos, JA (2016):” charts:
So some, not all, Russian charts are incorporated:
Ah! The magical mystical collation of unknown, but assumed, data as proxy to ice extent. Cobbled into an Arctic ice extent graph, with zero validation.
This graph is then coupled to satellite observations and presented as a single graph.
Again the unholy climatology method of adjusting actual data, correcting graph appearances to personal tastes and then coupling to actual observations to create false presentations…
Now about Peron’s and Pasalodos’ version of a 95% confidence levels? Let’s just say that even they go off the chart.
Greg, AMO is not a detrended index. it’s a superimposed index, a “signal”.
the only reason why in most cases the AMO is plotted as detrended is for clarity and identification of the “warm and cold phases” as base lines tend to shift with time. (see the changing WMO standard for the temperature baselines) and it then is named as “AMO index”
So an AMO index graph makes the AMO values comparable and identifiable trough time, which is the only reason why it is detrended. but that is not what the AMO is. (note i say AMO not AMO index!)
it’s a clear distinctive ebb and flow between warm and cool periods that will speed up/slow down warming in a warming trend, but that also will speed up/slow down cooling in a cooling trend.
when you would deepen into the subject you will notice that they often speak of “AMO signal” or “AMO variability”, not the AMO as an index, when they try to trace back the AMO signal. (they can trace it back to 8000 years ago). and they speak of an “AMO index”
in short:
AMO index shows the strength of the signal and is detrended
AMO is the identified signal of this index in the data and is not detrended
they are not the same, a mistake a lot make
javier used the AMO graph and correctly termed it: AMO is the non detrended graph
conclusion: Arctic ice extend correlates with the AMO
Thanks
Very sensible comments. I have long been railing against this stupid obsession with linear “trends” in climatology.
In fact a sinusoid does not fit as well as you may think when you try it. If you try regression it give about 80 y period which does not fit well at all. If you tweak it by hand, the shape in never quite right.
It’s definitely non linear and and not a monotonic decline but really don’t have a long enough sample to get a better idea what the recent decade is showing us.
I would call one ship’s passage through the Arctic in 1850 “anecdotal evidence”. Satellite sea-ice extent since 1979 is systematic measurement. Extrapolating between the two is senseless. Let’s face it, we don’t have a benchmark for Arctic sea-ice extent. We don’t know the natural variation at a century time scale.
Also, a single ice-free summer does not prove man-made global warming. We need successive ice-free summers, each summer ice-free earlier and staying longer than the summer before. This clearly isn’t happening.
It’s single point reading but it’s a pretty solid indication that sea was not at 1979 levels until AGW came by in the 1960s. HadISST is total fiction. for the most part.
Ugh, ugh and more ugh. What are you going to do about it?
And why doesn’t the Antarctic know about this AGW mystery?
Clearly the trend in ice extent and area is down over the satellite record, though of course there is variation from year to year.
and the research I have linked to, from all available sources, demonstrates that we do have a good idea of historic ice extent for over a century.
Here’s another very detailed survey of 20th century data from Judith Curry’s blog…
https://judithcurry.com/2013/04/10/historic-variations-in-arctic-sea-ice-part-ii-1920-1950/
It concludes:
“The 1920-1940’s arctic sea ice melt can therefore be seen as remarkable, albeit the caveats about apples and oranges need to be applied. Looking at the evidence available from each of the arctic oceans means the ice extent probably lies somewhere within that experienced during the first half of the 2000’s, but was probably not as low as 2007 and 2012.”
to which we can now add ‘or 2016…’
According to you Griff,there is indeed a cycle…………
Remarkable melting. First half of the 2000s (2000-2005). “Probably not as low as 2007 and 2012”. Meaning, could be, could be close. Difference being, satellites measuring in detail vs manual observations.
Griff, all you have just shown, from your own links, is that there has been melting, significant as well, in the past and that it is only “probably” not reached the levels of 2007/2012/2016. So, that said, if for 3 years between 1920-1940 someone didn’t fill that log book in, there could have been a minimum equal.
As said before, the arctic sea ice is fascinating. It is the frontline in the debate, as far as the wider public is concerned. IF, and I said IF before, ice starts recovering (at the moment it has stopped declining), the whole theory of the death spiral and that of CAGW would need to be confronted by the wider media.
Who knows though.
To add further, when you consider 2007/2012/2016 were storms, could be there wasn’t that storm setup in those periods….
Hardly compelling evidence, Griff.
yes, there seems likely to be an underlying cycle… its just that this time the warming is overriding it…
Griff, the whole point is that until you have determined what is natural variability you can not decide that “the warming” is even present.
This has been the AGW fallacy for the last 30 years. We do not understand climate, so we do not know what is natural variability and what is not. Arbitrarily de-trending everything is sight and attributing it to AGW meaningless.
There is NO proof of any warming that can categorically be attributed to AGW. It is an ASSUMPTION.
Griff
Thanks for referencing my article on arctic ice variations. This is an updated version with substantially more articles, science papers and observations.
https://wattsupwiththat.com/2014/08/22/historic-variations-in-arctic-sea-ice-part-two/
The arctic warming lasted from around 1916 to around 1950 . Evidence suggests it probably started a few years earlier as the icebergs from disko bay that sunk the Titanic were probably released by glacier melt. By some measures, see the ref to Phil jones, the coldest consecutive two decades in Greenland were during the 1930 and 1940 decades. We shall have to wait and see if the period ending 2020 beats that.
I visited the Scott polar institute in Cambridge to gather information and the conundrum that needs resolving is how much the ice recovered from its 1916 to 1950 episode. The arctic may possibly have become cold for a couple of decades, before melt commenced again, as evidenced in the satellite records. Whether it was as thick at that time as when the ice started to melt around 1916 is anyone’s guess at present. Consequently whilst it would appear that ice melt now is greater than at its height in the forties we really need to know what thickness it started from to make an apples to apples comparison. With that (substantial) caveat, the three years of very substantial melt during the 2000’s would appear greater than the earlier melt period.
Incidentally I wrote part one that covered the arctic melting around 1816 to 1840 . There is probably a part thrEe needed, in order to cover melting around 1700 to 1730 or so! according to the Hudson bay trading company records, there is another possible another article to cover the early 1500’s when the northern sea route likely became open and the Viking expeditions are too well known to make it worthwhile repeating here.
What startled me carrying out the research was the extraordinary annual variations and what was intriguing were the frequent references to very warm winters when ice did not form to any great extent
Tonyb
You say “the trend” like it means something. There is no reason to interpret this change as a linear “trend”. Why a linear model? It could be the down side in ice due to the hot half of a 60y cycle in SST, or maybe a mix of a cycle and warming trend. Or something else we don’t know either.
Whatever is driving it, it is probably distorted by feedbacks as well.
Thinking that a linear ‘trend’ tells us something just because Excel says it can fit one is one of most naive and widely held ideas in climatology.
Griff
September 23, 2016 at 8:03 am
Please explain why alleged “warming” isn’t also melting the Antarctic, where sea ice has increased since 1979.
Current Satellites doesn’t see all the ice either. The amount of Arctic ice during the melt season is probably a little higher than what Satellite data indicate, as it has limited resolution.
There is uncertainty for sure. I don’t see why that should be in one direction. Ice extent is reckoned to be more robust than ice area in the summer months since the method is less susceptible to problems due melt pools vs ice.
The Royal Navy escorted several convoys to Murmansk during WW2 in all seasons. Any records from that time indicating a low amount of floating ice or free passage to Murmansk to help verify the above assertions?
Plenty of soviet records… less, understandably, in the actual war time
I recommend this as a thorough survey…
https://judithcurry.com/2013/04/10/historic-variations-in-arctic-sea-ice-part-ii-1920-1950/
Griff
My next door neighbour here in England, now well in his nineties, took part in two British supply convoys to Murmansk. He says the Russians were not at all friendly.however just last year he was asked to attend a ceremony locally, where he was awarded a splendid medal to commemorate their feats, by the Russian ambassador to Britain.Which is more than our govt managed to do.
The northern sea route secretariat in Russia was set up in the 1930’s as they realised the trading opportunities that were possible due to the melting ice. I understand the route is now in decline but whether that is weather related, due to costly transit fees, or that ships have found other routes, I do not know.
Tonyb
When I was Second Mate I was in Murmansk in January 1968 loading Iron Ore.
We saw no sea ice at any time although we took the inside passage north inside the Norwegian coastal islands in case of spray icing everything up on deck in the open sea.
Normally Murmansk is ice free all year.
OSD,
The generally ice-free conditions extend all the way to Novaya Zemlya, at least. German U-boats rested in Belushya Bay in 1941.
What about the Antarctic sir? Detest your lying ilk.
The author states: “The subject of the extent of Arctic ice cover has been much in the news, with an apparently unending series of attempts to predict its future extent on the basis of a relatively few years’ worth of data.”
The “relatively few” years he refers to is the period from 1978 until present, or a total of 38 years worth of satellite ice measurements. That, apparently, is not sufficient for predicting a trend.
He then takes a total of two (2) data points, melting which occurred in 1922 (data point 1), and again in the 1990s (data point 2). Based on that, he predicts a sinusoidal trend with a cycle of 70 years – without any analysis of the in between years to see if they support his sinusoidal hypothesis.
So 38 data points are not enough, but 2 are. Hmmmmmm.
Apparently it escaped your notice that those two points were separated by 70 years, which is a climatically significant interval. Thirty-eight years aren’t. Climate is the average of 30 years-worth of weather. Therefore you need at least 60 years to say anything with a hope of being significant.
Fascinating set of comments.
I caught the story about Crystal Serenity when she was at Cambridge Bay and was doubtful that the trip would be successful.
Made it just in time, which will inspire more such trips next year.
Such good fortune may not bless next season’s eager tourists, some who would take the voyage to “prove” Global Warming.
There was no doubt about the success of the Crystal Serenity because it goes escorted by an ice-breaker. Russians have been doing it for decades with merchants and more sea-ice conditions.
Yep …. I can’t help but wonder just what effect all those “ice breakers” have had on the arctic ice. I mean, if a good wind storm turns it into slush, causing the all time low in satellite measuring, you have to wonder just what the yearly slicing up of ice does on the long term trend.
Kinda like that idiot who found a rare beetle, . whooped out is magnifying glass to get a better look and fried the beetle. LOL.
Or those scientists who went into the rainforest to study rare frogs, but ended up killing them because of a fungus they brought in on their shoes.
A Consul in Bergen Norway would have been someone who was not a scientist or even someone with a boat. It would have been a diplomat who would send back cables, while also performing other duties such as getting drunken American sailors out of jail, and would have been based upon what he heard around Bergen. While it was probably a warm winter in 1922 it would have been basically repeating idle conversation and should not be taken as definitive in any way.
His is hardly the only testimony or evidence of lower Arctic sea ice in the 1920s-40s than during the decades before and after that interval.
I wonder if Hudson’s Bay Company kept ice records of its outposts in the Canadian Arctic from the 17th century onwards.
Apparently the warming was caused by Naval forces during WW1.
“The investigation could furthermore demonstrate that there is a high possibility of a connection between the Arctic warming and the naval war in Europe from 1914 to 1918, due to the fact that the seawater current system had carried all the war torn sea water literally into the front garden of the Spitsbergen”
http://www.arctic-heats-up.com/chapter_9.html
Even though they note that 2016 ties with 2007 for second lowest Arctic sea ice minimum the sea ice extent has quickly returned to the standard deviations.
Much quicker than the 2012 or 2007 years. This lessons the significance of being tied for 2nd.
Does it not?
I was talking about NSIDC.
The 5d running average is not a good way to fitler out the noise. It is also too short. I found I needed to use a 14 day gaussian filter to end up with one unique change of direction per summer season.
If it reverses you are looking at annual weather variations not changes to the annual cycle. See the article on Climate Etc.
https://judithcurry.com/2016/09/18/is-the-arctic-sea-ice-spiral-of-death-dead/
Arguing about 3rd or 4th sig fig to see who is the “winner” is pointless. That is all weather not climate. People are just scurrying to plead it is either worse than we thought or the opposite. Min has been drifting earlier since 2007 after drifting later for 20y . So something changed ten years ago.
Driver changed or reaction to neg feedbacks, it will take more data to understand.
Here is a comparison of data of min according to NSIDC 5d trailing average ( re-centred ) and my processing. One thing to note is that it makes little change to the early Nimbus data whereas is does change the DMSP data. Nimbus took 6 days to get complete coverage and so does not have the same temporal resolution. This is why there is more variability in the later dates according to NSIDC.
Thus some of the change in NSIDC dates is due to incompatibilities in the data. My processing with heavier filtering dampens the later dates more than the early ones. Refreezing being quicker than the end of melting. The curve is not symmetrical either side on the minimum.
Wow, look at that sea ice grow
http://s19.postimg.org/wztaa6hgz/osisaf_nh_iceextent_daily_5years_en_7.png
Yes, I think this years processed min data on my graph will be a day or two earlier than last year. It seems that this filtered turning point is an indicator of rate of melting. If that is the case it will provide a better means of assessing changes since it takes a lot of years to estimate decadal rate of melting from the noise of ice extent variations.
On that basis, we are on a par with circa 1996/7 before the alarming plunge from 1997 to 2007 started.
The next few year will reveal whether there is some recovery of whether this earlier rate is more representative of a long term decline.
Griff
“This is the largest ship thus far to navigate the Northwest Passage and is accompanied by an icebreaker ship and two helicopters.”
I would submit that it is not ice cover that is decreasing insomuch as our wealth and technological ability to navigate existing and ever-changing arctic conditions has increased to the point where voyages by the likes of the Crystal Serenity and her paying passengers are possible.
A very, very good point.
I seem to remember both US and Russian submarines surfacing at the North Pole in the ’50s and summers in the early 50’s as being very hot here in Colorado. Now, if a sub surfaced, I would presume there was very little ice or it was a very thin layer. There must be some data or anecdotal records of the ice in the 50’s as well as the 30’s. Anyone know of such data?
You remember correctly. I remember the 1950s summers as being miserably hot here in northern California too.
http://www.john-daly.com/polar/arctic.htm
don’t presume check. IIRC subs can break through several metres of ice, depending upon the vessel and how motivated they are.
Varies a lot. For a typical US attack sub, more like feet, and then usually just the sail. For the largest Russian ballistic missile subs, yeah, maybe meters and the whole deck, in order to launch its SLBMs. Even so, some Russian exercises have been cancelled in recent years due to too much ice.
http://www.worldculturepictorial.com/images/content_2/russia_claims_north-pole.jpg
Russia claiming the North Pole and all its inhabitants. Because they invented the North Pole.
Breaking through ice:
http://www.worldculturepictorial.com/images/content_2/russian_submarine_arctic.jpg
They wouldn’t have needed to this september, here’s the Oden tied up to the ice floe at the N Pole:
https://twitter.com/CCG_GCC/status/769867469628596224/photo/1?ref_src=twsrc%5Etfw
Greg Goodman September 23, 2016 at 12:16 pm
don’t presume check. IIRC subs can break through several metres of ice, depending upon the vessel and how motivated they are.
They wouldn’t have needed to this September, here’s a photo of the Oden tied up to an ice floe at the N Pole:
https://twitter.com/CCG_GCC/status/769867469628596224/photo/1?ref_src=twsrc%5Etfw
The N Pole this september:
https://twitter.com/CCG_GCC/status/769867469628596224/photo/1?ref_src=twsrc%5Etfw
Phil
Yes the north pole has been moving quite rapidly in recent years. Presumably an effect of rising CO2.
Sorry about the triple post, nothing showed up at my end yesterday!
ptolemy2 September 24, 2016 at 11:07 am
Phil
Yes the north pole has been moving quite rapidly in recent years. Presumably an effect of rising CO2.
I assume you are implying that the Oden is not at the Pole in that photo?
If you look at the group of people on the ice next to the ship, they were taking their photos at the pole.
According to their GPS they were within 10m of the Pole at the time they tied up to the ice. ( 89°N 59.995)
[snip -self promotion /mod]
Dear mod,
Please explain how the comment you have “snipped” was “self promotion”.
Thanks in anticipation
[it links to another one of your pot-shot posts. we aren’t here to provide promotion or linkage to your blog which contains an almost constant stream of criticism and ” boo hoos they won’t publish my comments”… you are either clueless or mendacious. mendacious seems likely since you use multiple identities in blogosphere /mod]
Dear mod,
What “pot-shots” would those be then? The article in question contains lots of images of the geographical North Pole this year, plus explanatory text sprinkled with lots of links to original sources. It makes no mention of WUWT.
And what “multiple identities in the blogosphere” are you referring to?
I have to admit I do publish occasional articles to the effect that my comments are on your cutting room floor. The solution seems absurdly simple. Stop [snip]ping my comments!
[oh, please. your comment is clearly BS, your headline and naming of two people here at WUWT. it is settled then …you are mendacious
The SIMPLEST solution is to stop attempting to post comments here. we are not required to carry them. /mod]
it is not 70 years, it is 86.5 years
looking at the sun
we have the following solar cycles
11 years Schwabe = 1 S
22 years Hale Nicholson = 2 S
43 years 1/2 Gleissberg = 4 S
86.5 Gleissberg = 8 S
the actual effects of the cycles maybe delayed due to other ‘earthly’ factors, but eventually energy-in and energy out will catch up with us.
Technically we are already globally cooling.
what shape is you 86.5 y cycle ? Is it a cosine or like a larger version of the typical Hale Schwabe cycle?
Regressing a cosine on the current data gives something like 80y but I would not take that to mean much with the snippet of data available.
it is a sine wave, like I found here, looking at maxima
http://oi60.tinypic.com/2d7ja79.jpg
which appears to make a good fit to the SSN going back to 1927
note that at the time of making the graph some literature indicated GB at 88 years, which makes my prediction out aa bit. The actual GB minima for solar polar magnetic field strengths were in 2014.
but you can approximate it with a normal quadratic as shown here, for a sample of weather station representing [global] minima
the above shows the data for ca. 1 half GB
note that I forgot to mention the DeVries cycle
http://www.nonlin-processes-geophys.net/17/585/2010/npg-17-585-2010.html
I was asking you what shape this very precisely timed Gliesberg cycle was supposed to be.
“it is not 70 years, it is 86.5 years”
That is a solar cycle and you reply by posting earth temps. Oh well. I did not expect much better.
@Greg
would advise you to look here\;
we can see the half cycle of GB at 43 years with bending points 1971 and 2014
you can imagine drawing the parabola and hyperbole representing the south and north solar polar field strength, repspectively. There is a dead end stop in 1971 and 2014 indicating some electrical switch –
note the little holes in the graph
it appears actually like that there were mini solar cycles in 1970 and 2013….
I have been able to find correlation with the position of the planets for the bending points and change of signs in the GB cycle but I am not yet sure if the correlation is causal or caused.
http://oi64.tinypic.com/5yxjyu.jpg
Griff says:
yes, there seems likely to be an underlying cycle… its just that this time the warming is overriding it…
You finished with a baseless assertion. Assertions are opinions, Griff.
The original climate scare was based on the belief that a rise in CO2 would cause runaway global warming and climate catastrophe. That has been falsified by the ultimate Authority.
Therefore, an honest scientist would either:
• Admit their hypothesis was wrong, and reject it, or
• Admit their hypothesis was wrong, and try to formulate a new hypothesis in an attempt to rectify the errors.
Instead, the alarmist crowd continues to peddle the repeatedly falsified “dangerous AGW” scare.
If you want to be considered an honest scientist, then deal honestly with the failed “polar ice” hypothesis, instead of trying to resuscitate and defend your failed prediction.
Either admit you were wrong, or fix your hypothesis so it is able to make at least rudimentary predictions accurately.
There’s nothing wrong with being wrong. Everyone is wrong at times. The problem is when one side is obviously wrong, but they still refuse to admit it. Arguing incessantly doesn’t make you right.
The Arctic ice scare is obviously wrong, because the original hypothesis argued that rising CO2 would cause polar ice to disappear. Limiting your argument to “Arctic” ice is just moving the goal posts. But being half right is still wrong.
“Arguing incessantly doesn’t make you right.” Yes it does. 😉
The Arctic ice scare is obviously wrong, because the original hypothesis argued that rising CO2 would cause polar ice to disappear.
Uh huh. Next.
So the author feels that anecdotal information from a few locations over time contradict the temperature record from many known weather stations around the far northern latitudes? It also boggles the mind to think the the few anecdotal observations would not be backed up by others around the Arctic if it were a widespread phenomenon like it is today
Oh god another wacko WUWT article. Christ author do attempt to cite a peer reviewed article in a respected scientific journal won’t you? If there is no verifiable science behind your statements then you are just spouting off your ever so precious opinion. Grow up.
Peer review rant. Self-dealing academic incest is best, eh?
It’s not your blog, so go whine elsewhere, or STFU. Anthony can accept musings from whoever he chooses. We here all know how broken pal-review is (refer to climategate emails)
What’s going on in the Antarctic and what are you going to do about any of it? This entire ‘hypothesis’ is in shambles and you’ll have no affect on any of it. How does that make you feel. Warmer is better. I hope it keeps going this way.
@Bill Illis and those interested in the NW passage
I did not see in that video the trip made by Willem Barentz back in the 16th century. Both him and his crew got stuck in the ice going north from Holland but they tried to survive on Nova Zembla. Unfortunately they all died. Hence we have now the Barents sea up there.
In those days the Dutch flag was flying high on all seas so I donot think that Barents went looking for the NW passage unless there were strong historical and or anecdotal scriptural evidence that the NW passage did exist. Indeed, in hindsight, it seems likely now to me that the NW passage did exist in around 1100 AD. Namely, in the MWP it appears to have been warmer than it is now, as evident from the 2nd graph here,
http://wattsupwiththat.com/2009/12/09/hockey-stick-observed-in-noaa-ice-core-data/
so, really, there is nothing new or to be concerned about, even if the NW does open up a bit
….for a little while…
Walsh et al. put sources together to work out how much ice there was historically. They say September extent never went below 6 million sq km from 1850 until 2002, this is a more useful comparison than anecdotes about individual areas IMO. [/IMG]
https://www.carbonbrief.org/guest-post-piecing-together-arctic-sea-ice-history-1850
Not sure how to put an image in these posts:
[IMG
Does that affect anyone’s opinion here?
After carefully reading the initial post in this thread, I have spent the better part of two hours perusing the 213 (and growing) responses to this thread. I find the discussion fascinating and I’m grateful to all participants. I especially found Bartleby’s comments (September 23, 2016 at 10:55 am) to be helpful.
After carefully reading the Carbon Brief article “Piecing together the Arctic’s sea ice history back to 1850” mentioned several times in this thread I have spent about three minutes reading the comments. There are exactly two of them. The article,was posted August 11. Comments are now closed.
What can be appropriately inferred from the relative number of comments on both articles? I realize that Anthony’s blog is popular and I have a fairly good idea of why this is, but I was shocked at the near total absence of comments on the Carbon Brief article. This seems to be, after all, one of the truly crucial issues in the larger discussion about climate change.
Thanks, everyone.
cliosmith,
Having read the Carbon Brief article, what do you think of the historical Arctic sea ice record since 1850?
there is no man made warming (AGW), if that it what you are implying.
Namely, if there were, I should have found some noise in my minima graph here
but I found none.
(AGW is supposed to affect minimum T)
[On this site, please limit [ and ] to the moderators. .mod]
I have read Florence Fetterer’s guest post at the page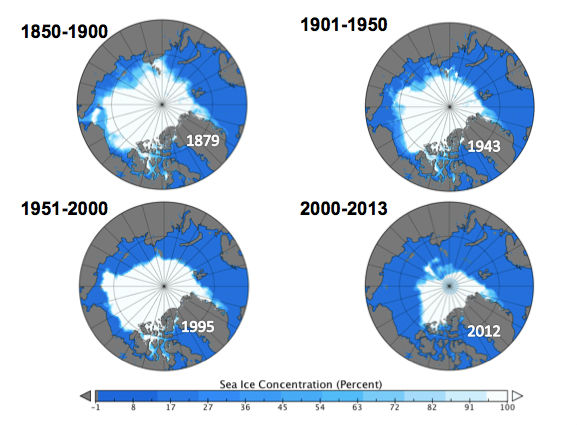

https://www.carbonbrief.org/guest-post-piecing-together-arctic-sea-ice-history-1850
proposed by MieScatter.
This guest post is quite interesting, and presents us a view somewhat differing from what we use to read, like “In earlier times it was warm as well in the Arctic” or “even warmer”.
This differing view manifestly is based on retrieval of many sources not present in earlier NSIDC compilations. These addenda led to a new record (for which there is unfortunately only a netcdf variant, no text data easy to read or download for anybody):
http://nsidc.org/data/g10010
We all know the the arctic region was to greater extents ice-free. But I did not imagine this:
nor a fortiori this
What disturbs me id that though Fetterer’s guest post is dated august 2016, the data presented here doesn’t go beyond 2012, known as a highly Arctic ice-arm year; I miss a representation of the slight recovery since then. That is a unnecessary missing which inevitably aliments suspicion.
Nevertheless we can draw at least one simple conclusion.
Should this data correctly reflect the past 150 years, so there is some evidence that the 35-year cycle idea imagined and presented here at WUWT by guest author Roger Graves has few chance to pass a deep scientific check, e.g. through a careful change point analysis:
http://www.changepoint.info/introduction.html
A look at the march and september plots lets rather thing of a major change point be detected around 1970. Prior to that date, both plots seem to show something like natural variability, and a decline since then, far more pronounced in september of course.
So?
The less arctic sea ice that is present in September, the greater the cooling effect the next seven months.
Many years, the greater the arctic ice area is in March-April, the smaller the area is in September.
Many years, the smaller the arctic sea ice area is in September, the larger the sea ice area is in March-April the next year.
From late-August until 1 April, the less sea ice there is, the greater the heat loss will be from the Arctic ocean.
Nothing of what you pretend is visible on the chart, so please come again when you have more substantial info.
What you wrote here is no more than a copy & paste of what you write everywhere as far as Arcitc sea ice is concerned. I know: it’s your leitmotiv, but repeating it all the tmie doesn’t make it more relevant.
Fine. I can always be convinced. By calculation, backed up by evidence.
So. Judith Curry has found that the average daily loss of heat energy from the Arctic sea ice at 78 degrees [latitude] in mid-August is greater than 2400 Watts-hrs/m^2. Now, that is for a much warmer period than any day in September, as the DMI average temperature plots for 80 north [since] 1958 show, and it does not include the heat energy losses [required] to freeze a surface layer of ice on any given melt pond on the arctic sea [ice] but let [us] conservatively assume that the open arctic waters in September lose 100 watts/m^ per hour to the air by evaporation and convection, to the seawater below by conduction, and to the arctic skies by long wave radiation.
Calculate the daily total energy difference gained by the arctic ocean by solar radiation, compared to what is gained by solar radiation onto the same area of average arctic sea ice for each day in September. Or for any day in September, for that matter.
Oh, and while you have the calculations and assumptions out, find out how extra solar energy is reflected by the average square meter of excess Antarctic sea ice that same day.
Nice reaction, but it is still no answer to what I was talking about:
– no evidence at all for a 35 year cycle there;
– decline starts around 1970 after 120 years with rather weak variability.
I have no idea about any cause for the second point, and I’m not a person explaining anything with AGW. Talking about credible causes interests me a bit more than an accurate evaluation of how much energy is lost by thawing.
And where does the energy needed for thawing after all come from? From a sun actually on full decline? From tentacular energy spent from far far away (5N-5S – 120-170W) by these good Niño guys?
At best one could guess after having read your prosa that that the increasing arctic sea ice decline from april till september at least helps in keeping the arctic sea ice decline from october till march somewhat lower 🙂
bindidon,
What strikes me this year is that though we have a tie with 2007 the low was very abnormally short compared to the other record lows: it rose 1 million suare kilometers from sept 10 to sept 30. This doesn’t comply with an arctic death spiral, more with “something is going on”
there are things happening in the arctic that we do not know of yet.
also comparing incomplete data from before 1979 with complete satellite data is adding an apple to a string of pears.
i’ pretty sure that if the arctic extend plot would be detrended that it will fit on the AMO index. Even the short reliable 37 year graph will show that.
Ooops! The chart must end in 2013 – and not in 2012! There is a visible sea ice recovery at the end, I didn’t look carefully enough at it. Apologies.
Again, similar to Global T, I don’t think we can compare data from before 1950 with todays’ data. It is again comparing apples with pears due to the method of collection of data – e.g non re-calibrated thermometers and human observation – instead of satellite / computed observations.
add on the Hudson bay company use of the North west Passage.
1937-
http://trove.nla.gov.au/newspaper/article/97897865?searchTerm=north%20west%20passage%20ice%20free&searchLimits=
and
1930
“PERILS OF ARCTIC
North-West Passage
THREE SHIPS GET THROUGH”
http://trove.nla.gov.au/newspaper/article/137078889?searchTerm=hudson%20bay%20company%20north%20west%20passage&searchLimits=
and not sure if this event happened-
1936-
NEW GRAIN RACE.
Dash Through North-West Passage.
http://trove.nla.gov.au/newspaper/article/40735753?searchTerm=wheat%20through%20the%20north%20west%20passage%20to%20england&searchLimits=
REPLY
Richard PERMALINK
September 17, 2016 11:42 am
SS MAnhattan went though the NWP in 1969.
REPLY
Richard PERMALINK
September 17, 2016 11:52 am
Richard Collinson was the first to take took his ship through the North West passage in the 1850’s.
“but Collinson took his
ship safely through to England. The
North-west passage was not again
made until Roald Amundsen navigated
the tiny Gjoa, a sailing sloop with
gasoline engine, from the Atlantic`’
http://trove.nla.gov.au/newspaper/article/66964441?searchTerm=richard%20collinson%20north%20west%20passage&searchLimits=
REPLY
richard September 25, 2016 at 8:10 am
1930
“PERILS OF ARCTIC
North-West Passage
THREE SHIPS GET THROUGH”
Didn’t happen, certainly in the usual sense of the word:
One ship travelled one way having left in 1928 and stayed near Gjoa Havn, and was met there in 1930 by a ship that came from the opposite direction, they exchanged some cargo and travelled back the way they had come. Nice bit of propaganda by the HBC.
http://trove.nla.gov.au/newspaper/article/137078889?searchTerm=hudson%20bay%20company%20north%20west%20passage&searchLimits=
and not sure if this event happened-
It didn’t.
Richard PERMALINK
September 17, 2016 11:52 am
Richard Collinson was the first to take took his ship through the North West passage in the 1850’s.
“but Collinson took his
ship safely through to England. The
North-west passage was not again
made until Roald Amundsen navigated
the tiny Gjoa, a sailing sloop with
gasoline engine, from the Atlantic`’
Again strange use of the word ‘through’, Collinson sailed into the western end of the NW Passage and explored it but then sailed out via the Bering Strait and returned to England via the Cape of Good Hope.
We also know that when regular satellite coverage became available in 1979,
______________________________________________________________________
We have quasi-regular satellite coverage as far back as 1961. We have some exceptionally interesting Nimbus HRIR (High Resolution Infrared Radiometer) and AVCS (Advanced Video Camera System) images from the Arctic from 1964, 1966, and 1969.
Here is a graphic from the NSIDC on Antarctic ice extent from Nimbus. There is much to learn from this early data…
Thanks for the hint -> http://cires1.colorado.edu/events/rendezvous/2011/posters/detail.php?id=4532 and other interesting sources I’ll search for when I have time to do.
Focus on the differences between 1964 and 1966 in the Arctic. You will be interested I assure you.
Here is another non-reader. Had you bothered to read my article on the Arctic in 2011 Energy and Environment you would know Arctic history by now. To start off, Kaufman et al. (2009) studied sediments in small Arctic lakes and determined that most of the last 2000 years there was nothing but a slow, linear cooling in the Aerctic. It ended at the turn of the twentieth century when a heat wave arrived unannounced. Warming continued until 1940 when cooling set in. The cooling lasted thirty years, until 1970, when the present warming returned. All of the Arctic warning data have been recorded after this date and none of these guys know what happened before. The warming cannot possibly be from the greenhouse effect because we know that no carbon dioxide was released when the warming started. It is very likely that what happened was a rearrangement of North Atlantic current system such that the warm Gulf Stream flow was aimed more directly at the Arctic Ocean. Spielhagen et al. (2011) measured the temperature of Atlantic water entering the Arctic and determined that it exceeded anything reaching the Arctic before this. The thirty year cold spell was probably caused by a temporary return of the previous flow pattern. But what happens in nature can happen again. It is not out of the question that another cold spell could appear and raise havoc with transportation in the Arctic.
True
global cooling on its way
1778:
“August 18 – reaches the ice pack at 70° 44’N., north of Icy Cape. Cook reported that in the early afternoon, sailing in a chilly mist, they encountered a wall of ice about 12 feet high, stretching from horizon to horizon. After noting that the pack ice was advancing at the rate of 15 miles in 10 hours, they of course then headed south again.”
http://www.explorenorth.com/library/yafeatures/bl-Cook1.htm
12′ high means 100′ thick. I’ve never seen this report discussed in a context of ice islands or any other. –AGF
The “death spiral” comments always make me laugh. The oldest ice in the arctic is not 4 billion years old (or whatever number you use for the earth’s age) so at some point the arctic was ice free, and now there is ice again. So the ice cannot “die”.
even more then you would conclude that “ice ages” are actually an exception rather then the norm in earth’s “life”…