Guest Post by Bob Tisdale
This post provides an update of many of the ENSO-related variables we presented as part of last year’s 2014-15 El Niño Series. The reference years for comparison graphs in this post are 1997 and 2014, which are the development years of the strongest recent El Niño and the last El Niño. I have not included animations in this post. In their place, I’ve compared present-day maps from the NOAA GODAS website to the same time in 2014. Note that I’ve also added an 2015-16 El Niño Series category at my blog for those who want to refer to the earlier ENSO updates from this year.
This is the last post in which we’ll use 2014 as a reference year. Next month I’m switching to 1982 along with 1997, to capture the evolutions of the two strongest El Niño events in recent history for comparison to this year.
INTRODUCTION
There are a couple of notable things this month. First, NINO3.4 region sea surface temperature anomalies, which NOAA uses as its primary metric for determining the strength of an El Niño, are still running a tick ahead of the 1997/98 El Niño. Considering the volume of warm water below the surface of the central and eastern equatorial Pacific, we shouldn’t expect the El Niño to decay anytime soon. See the NOAA animation of subsurface temperature anomalies through September 15 here. In fact, we may expect the NINO1+2 region to warm again.
Second, for the first time in a few months I can report that there appears NOT to have been another westerly wind burst in the western tropical Pacific recently. If Mother Nature wants the El Niño to continue strengthen, she’ll continue to provide westerly wind bursts in the western equatorial Pacific.
ENSO METRIC UPDATES
This post provides an update on the progress of the evolution of the 2015/16 El Niño (assuming one continues into next year) with monthly data through the end of August 2015, and for the weekly data through mid-September. The post is similar in layout to the updates that were part of the 2014/15 El Niño series of posts here. The remainder of the post includes 17 illustrations so it might take a few moments to load on your browser. Please click on the illustrations to enlarge them.
Included are updates of the weekly sea surface temperature anomalies for the four most-often-used NINO regions. Also included are a couple of graphs of the monthly BOM Southern-Oscillation Index (SOI) and the NOAA Multivariate ENSO Index (MEI).
For the comparison graphs we’re using the El Niño evolution years of 1997 and 2014 (a very strong El Niño and the last El Niño) as references for 2015. The 1997/98 El Niño was extremely strong, while the 2014/15 event was extremely weak and intermittent.
Also included in this post are evolution comparisons using warm water volume anomalies and depth-averaged temperature anomalies from the NOAA TOA project website.
Then, we’ll take a look at a number of Hovmoller diagrams comparing the progress so far this year to what happened in both 1997 and 2014.
Last, we’ll compare maps and cross sections (2014 and 2015) from the GODAS website of a number of ENSO-related metrics.
NINO REGION TIME-SERIES GRAPHS
Note: The weekly NINO region sea surface temperature anomaly data for Figures 1 and 2 are from the NOAA/CPC Monthly Atmospheric & SST Indices webpage, specifically the data here. The base years for anomalies for the NOAA/CPC data are referenced to 1981-2010.
Figure 1 includes the weekly sea surface temperature anomalies of the 4 most-often-used NINO regions of the equatorial Pacific. From west to east they include:
- NINO4 (5S-5N, 160E-150W)
- NINO3.4 (5S-5N, 170W-120W)
- NINO3 (5S-5N, 150W-90W)
- NINO1+2 (10S-0, 90W-80W)
As of the week centered on September 16, 2015, the sea surface temperature anomalies for the easternmost NINO1+2 region were about 2.6 deg C, noticeably less than the peak earlier in the year. The westernmost NINO4 region is showing a slight increase in sea surface temperature anomalies over the past few weeks…after a decline. The NINO3.4 and NINO3 regions are continuing to show increases in recent weeks.

Figure 1
Note that the horizontal red lines in the graphs are the present readings, not the trends.
EL NIÑO EVOLUTION COMPARISONS FOR NINO REGION SEA SURFACE TEMPERATURE ANOMALIES
Using weekly sea surface temperature anomalies for the four NINO regions, Figure 2 compares the goings on this year with the 1997/98 and 2014/15 events. All of the NINO regions this year are warmer than during the same times of the 2014/15 El Niño. The NINO1+2 is now lagging well behind the 1997/98 El Niño, but the other regions are comparable to or warmer than the 1997/98 El Niño. Then again, as we’ve noted throughout this year, we started this year in weak El Niño conditions, while we didn’t during the two reference years.

Figure 2
THE MULTIVARIATE ENSO INDEX
The Multivariate ENSO Index (MEI) is another ENSO index published by NOAA. It was created and is maintained by NOAA’s Klaus Wolter. The Multivariate ENSO Index uses the sea surface temperatures of the NINO3 region of the equatorial Pacific, along with a slew of atmospheric variables…thus “multivariate”.
According to the most recent Multivariate ENSO Index update discussion, strong El Niño conditions exist:
Compared to last month, the updated (July-August) MEI has increased significantly by 0.39 standard deviations to +2.37, or the 2nd highest ranking, surpassed only in 1997 at this time of year. This new peak value of the current event ranks third highest overall at any time of year since 1950, with 1982-83 and 1997-98 remaining in a ‘Super El Niño’ club of their own (for now), with peak values around +3 standard deviations.
There’s something else to consider about the MEI. El Niño and La Niña rankings according to the MEI aren’t based on fixed threshold values such as +0.5 for El Niño and -0.5 for La Niña. The MEI El Niño and La Niña rankings are based on percentiles, top 30% for the weak to strong El Niños and the bottom 30% for the weak to strong La Niñas. This is difficult to track, because, when using the percentile method, the thresholds of El Niño and La Niña conditions vary from one bimonthly period to the next, and they can change from year to year.
The Multivariate ENSO Index update discussion and data for July/August were posted back on September 3rd. Figure 3 presents a graph of the MEI time series starting in Dec/Jan 1979. And Figure 4 compares the evolution this year to the reference El Niño-formation years of 1997 and 2014.

Figure 3
# # #

Figure 4
EL NIÑO EVOLUTION COMPARISONS WITH TAO PROJECT SUBSURFACE DATA
The NOAA Tropical Atmosphere-Ocean (TAO) Project website includes data for two temperature-related datasets for the waters below the equatorial Pacific. See their Upper Ocean Heat Content and ENSO webpage for descriptions of the datasets. The two datasets are Warm Water Volume (above the 20 deg C isotherm) and the Depth-Averaged Temperatures for the top 300 meters (aka T300). Both are available for the:
- Western Equatorial Pacific (5S-5N, 120E-155W)
- Eastern Equatorial Pacific (5S-5N, 155W-80W)
- Total Equatorial Pacific (5S-5N, 120E-80W)
Keep in mind that the longitudes of 120E-80W stretch 160 deg, almost halfway around the globe. For a reminder of width of the equatorial Pacific, see the protractor-based illustration here. Notice also that the eastern and western data are divided at 155W, which means the “western” data extend quite a ways past the dateline into the eastern equatorial Pacific.
In the following three illustrations, we’re comparing data for the evolution of the 2015/16 “season” so far (through month-to-date September 2015) with the data for the evolutions of the 1997/98 and 2014/15 El Niños. The Warm Water Volume data are the top graphs and the depth-averaged temperature data are the bottom graphs. As you’ll see, the curves of two datasets are similar, but not necessarily the same.
Let’s start with the Western Equatorial Pacific (5S-5N, 120E-155W), Figure 5. The warm water volume and depth-averaged temperature anomalies show the Western Equatorial Pacific began 2015 with noticeably less warm water than during the opening months of 1997 and 2014. Both western equatorial datasets now, though, are higher than in 1997 but less than 2014.

Figure 5
Both warm water volume and depth-averaged temperature anomalies in the Eastern equatorial Pacific (5S-5N, 155W-80W) continue to lag behind the values of 1997, but are greater than the 2014 values. See Figure 6.

Figure 6
The total of the TAO project eastern and western equatorial subsurface temperature-related data, Figure 7, are as one would expect looking at the subsets. Warm water volume and depth-averaged temperature anomalies in 2015 are higher than they were in 2014, but comparable to where they were in 1997.

Figure 7
SOUTHERN OSCILLATION INDEX (SOI)
The Southern Oscillation Index (SOI) from Australia’s Bureau of Meteorology is another widely used reference for the strength, frequency and duration of El Niño and La Niña events. We discussed the Southern Oscillation Index in Part 8 of the 2014/15 El Niño series. It is derived from the sea level pressures of Tahiti and Darwin, Australia, and as such it reflects the wind patterns off the equator in the southern tropical Pacific. With the Southern Oscillation Index, El Niño events are strong negative values and La Niñas are strong positive values, which is the reverse of what we see with sea surface temperatures. The August 2015 Southern Oscillation Index value is -19.8, which is a much greater negative value than the threshold of El Niño conditions. (The BOM threshold for El Niño conditions is an SOI value of -8.0.) Figure 8 presents a time-series graph of the SOI data. Note that the horizontal red line is the present monthly value, not a trend line.

Figure 8
The graphs in Figure 9 compare the evolution of the SOI values this year to those in 1997 and 2014…the development years of the 1997/98 and 2014/15 El Niños. The top graph shows the raw data. Because the SOI data are so volatile, I’ve smoothed them with 3-month filters in the bottom graph. Referring to the smoothed data, the Southern Oscillation Index this year is ahead of the values in 2014, but behind 1997…though it’s getting close.

Figure 9
Also see the BOM Recent (preliminary) Southern Oscillation Index (SOI) values webpage. For the past week (through September 21), SOI values started strong, temporarily dropped out of El Niño conditions, then returned to El Nino conditions over the past three days. Also, the current 30-day running average is a greater negative value than the -8.0 threshold of an El Niño based on the Southern Oscillation Index, as is the 90-day average.
COMPARISONS OF HOVMOLLER DIAGRAMS OF THIS YEAR (TO DATE) WITH 1997 AND 2014
NOTE: The NOAA GODAS website has not yet added 2015 to their drop-down menu for Hovmoller diagrams. For the following illustrations, I’ve used the Hovmolller diagrams available for the past 12 months, deleted the 2014 date and aligned the 2015 data with the other 2 years.
Hovmoller diagrams are a great way to display data. If they’re new to you, there’s no reason to be intimidated by them. Let’s take a look at Figure 10. It presents the Hovmoller diagrams of thermocline depth anomalies (the depth of the isotherm at 20 deg C. Water warmer than 20 deg C is above the 20 deg C isotherm and below it the water is cooler). 2015 is in the center, 1997 on the left and 2014 to the right. (Sorry about the different sizes of the Hovmollers, but somewhere along the line NOAA GODAS changed them, but they are scaled, color-coded, the same.)
The vertical (y) axis in all the Hovmollers shown in this post is time with the Januarys at the top and Decembers at the bottom. The horizontal (x) axis is longitude, so, moving from left to right in each of the three Hovmoller diagrams, we’re going from west to east…with the Indian Ocean in the left-hand portion, the Pacific in the center and the Atlantic in the right-hand portion. We’re interested in the Pacific. The data are color-coded according to the scales below the Hovmollers.

Figure 10
Figure 10 is presenting the depth of the 20 deg C isotherm along a band from 2S to 2N. The positive anomalies, working their way eastward early in 1997, 2014 and 2015, were caused by downwelling Kelvin waves, which push down on the thermocline (the 20 deg C isotherm). You’ll note how, each year, the anomalies grew in strength as the Kelvin wave migrated east. That does not mean the Kelvin wave is getting stronger as it traveled east; that simply indicates that the thermocline is normally closer to the surface in the eastern equatorial Pacific than it is in the western portion.
The El Niño conditions were much stronger in 1997 than they were in 2014 and so far in 2015.
An upwelling (cool) Kelvin wave followed the initial downwelling (warm) Kelvin wave in 2014 and suppressed the development of the El Niño last year. That has not happened in 2015.
Figure 11 presents the 2015-to-date along with the 1997 and 2014 Hovmollers for wind stress (not anomalies) along the equator. The simplest way to explain them is that they’re presenting the impacts of the strengths and directions of the trade winds on the surfaces of the equatorial oceans. In this presentation, the effects of the east to west trade winds at various strengths are shown in blues, and the reversals of the trade winds into westerlies are shown in yellows, oranges and reds. To explain the color coding, the trade winds normally blow from east to west; thus the cooler colors for stronger than normal east to west trade winds. The reversals of the trade winds (the yellows, oranges and reds) are the true anomalies and they’re associated with El Niños, which are the anomalous state of the tropical Pacific. (A La Niña is simply an exaggerated normal state.)

Figure 11
The two westerly wind bursts shown in red in the western equatorial Pacific in 2014 are associated with the strong downwelling Kelvin wave that formed at the time. (See the post ENSO Basics: Westerly Wind Bursts Initiate an El Niño.) Same thing with the three westerly wind bursts early in 2015, January through March: they initiated the Kelvin wave this year. Throughout 1997, there was a series of westerly wind bursts in the western equatorial Pacific. We didn’t see the additional westerly wind bursts later in 2014, which suppressed the evolution of the 2014/15 El Niño. So far in 2015 we’ve had a number of westerly wind bursts. The most recent one happened in late-July/early-August of 2015 and helped to strengthen the El Niño this year.
We’ll need more westerly wind bursts this year, too, in order for this El Niño to continue to develop throughout the year.
Figure 12 presents the Hovmollers of wind stress anomalies…just a different perspective. But positive wind stress anomalies, at the low end of the color-coded scale, are actually a weakening of the trade winds, not necessarily a reversal.

Figure 12
NOTE: There are a number of wind stress-related images on meteorological websites. Always check to see if they’re presenting absolute values or anomalies.
And Figure 13 presents the Hovmollers of sea surface temperature anomalies. Unfortunately, the Hovmoller of sea surface temperature anomalies is delayed a few weeks at the GODAS website. Refer again, also, to the comparison graphs in Figure 2.

Figure 13
Notice how warm the eastern equatorial Pacific got during the evolution of the 1997/98 El Niño. While the sea surface temperatures this year have reached are well above threshold of a strong El Niño, they’ve still well behind those of the 1997/98 El Niño…especially east of 120W (to about 90W), where sea surface temperature anomalies were more than 4.0 deg C at this time.
GODAS MAPS AND CROSS SECTIONS – MID-SEPTEMBER 2014 AND 2015
As opposed to presenting animations from NOAA’s GODAS website of maps and cross sections of a number of metrics as I did in the 2014/15 El Niño series, I thought it would be better (more informative) to compare the most recent maps and cross sections from this year to those from the same time last year. So let’s start with the cross sections of temperature anomalies along the equator.
Figure 14 compares the subsurface temperature anomalies along the equator (2S-2N) for the pentads (5-day averages) centered on September 15, 2015 (left) and September 15, 2014 (right). The equatorial Indian Ocean is to the left in both Illustrations and the equatorial Atlantic is to the right. We’re interested in the equatorial Pacific in the center. The illustrations confirm what was shown in the depth-averaged temperature anomaly graphs in Figures 5 and 6. The subsurface temperature anomalies in the western equatorial Pacific are cooler this year than last, but in the eastern equatorial Pacific, they’re much warmer this year. By August 2014, an upwelling (cool) Kelvin wave had traveled east and lowered the subsurface temperature anomalies along the equatorial Pacific. That did not happen this year.

Figure 14
Don’t expect the El Niño to start to decay anytime soon. There is still a lot of warm water below the surface in the eastern equatorial Pacific. Also, it has shifted east in recent weeks, so we should probably expect the NINO1+2 region to warm again.
Figure 15 presents global maps of the depth-averaged temperature anomalies to depths of 300 meters (a.k.a. T300 anomalies). Looking at the tropical Pacific as a whole, not just the equator, the downwelling Kelvin wave this year has definitely reached the shores of South America. This year’s Kelvin wave has traveled eastward into an eastern tropical Pacific that’s warmer than last year, a product of the additional downwelling (warm) Kelvin waves later in 2014. Keep in mind, though, that the downwelling (warm) Kelvin wave this year started later than in 2014 and that there was an upwelling (cool) Kelvin wave last year by this time that suppressed it. Also note that the western tropical Pacific is much cooler this year than last. We’ll have to wait and watch to see if those cool anomalies in the west are setting up for a strong La Niña next year.

Figure 15
Sea surface height anomalies, Figure 16, are often used as a proxy for temperature anomalies from the surface to the ocean floor. They are showing lower sea levels in the western tropical Pacific this year than last and showing that the downwelling Kelvin wave has arrived in a warmer eastern tropical Pacific.

Figure 16
The sea surface temperature anomaly maps at the GODAS website lag by a few weeks. Figure 17 shows the sea surface temperature anomaly maps for 2014 and 2015 for the pentads centered on September 15th. The sea surface temperature anomalies along the equatorial Pacific are warmer this year than last, concentrated this year just east and west of the dateline. The eastern North Pacific is also warmer this year, with the remnants of the “blob” and the coastally trapped Kelvin wave(s) from last year.

Figure 17
Let’s hope a very strong La Niña follows the El Niño this year and finally overcomes the effects of “The Blob” on the North Pacific. Even then, there may have been an upward shift in sea surface temperatures there, which would impact the entire east Pacific. We’ll have to keep an eye on it over the next few years.
The most recent update on The Blob is here, dated August 12, 2015.
EL NIÑO REFERENCE POSTS
For additional introductory discussions of El Niño processes see:
- An Illustrated Introduction to the Basic Processes that Drive El Niño and La Niña Events
- El Niño and La Niña Basics: Introduction to the Pacific Trade Winds
- La Niñas Do NOT Suck Heat from the Atmosphere
- ENSO Basics: Westerly Wind Bursts Initiate an El Niño
Also see the entire 2014-15 El Niño series. We discussed a wide-range of topics in those posts.
WANT TO LEARN MORE ABOUT EL NIÑO EVENTS AND THEIR AFTEREFFECTS?
My ebook Who Turned on the Heat? goes into a tremendous amount of detail to explain El Niño and La Niña processes and the long-term aftereffects of strong El Niño events. Who Turned on the Heat? weighs in at a whopping 550+ pages, about 110,000+ words. It contains somewhere in the neighborhood of 380 color illustrations. In pdf form, it’s about 23MB. It includes links to more than a dozen animations, which allow the reader to view ENSO processes and the interactions between variables.
Last year, I lowered the price of Who Turned on the Heat? from U.S.$8.00 to U.S.$5.00. And the book sold well. It continues to do so this year.
A free preview in pdf format is here. The preview includes the Table of Contents, the Introduction, the first half of section 1 (which was provided complete in the post here), a discussion of the cover, and the Closing. Take a run through the Table of Contents. It is a very-detailed and well-illustrated book—using data from the real world, not models of a virtual world. Who Turned on the Heat? is only available in pdf format…and will only be available in that format. Click here to purchase a copy.
My sincerest thanks to everyone who has purchased a copy of Who Turned on the Heat? as a result of the 2014-15 and this year’s El Nino series.
Hoping for a Sept, Oct, Nov, Dec, Jan, Feb, Mar, Apr, May miracle. We are so far in the hole a mere March miracle ain’t gonna cut it.
Meanwhile the East Coast of Australia (the region most effected by El Nino heat) is having its coldest, wettest September since 1986 and shows no signs of being in an El Nino year what-so-ever.
I love Bob’s work, but when I look out the window it all seems suspect.
Bob Tisdale, very well done, as usual.
The 1997/98 El Niño event was a very dramatic event, often refered to as the “Super El Niño”. Certainly there is nothing else like it in the satellite record. Would another event, as large or larger, so soon, be considered as extraordinary or just “another day at the office” for an oceanographer.
What is your perspective on this?
Agree – very well done. Re the 97/98 super El Nino, it would be very interesting to see how an analysis of only the pre-21/9/97 (US 9/21/97) data would interpret it. Would a super El Nino be clearly predicted? I suspect not. IOW we still can’t predict these things even a few weeks out.
Bob says “We’ll need more westerly wind bursts this year, too, in order for this El Niño to continue to develop throughout the year.“. The SOI suggests(?) we will get them. But do we really know??
Hi TonyL: The 1982/83 El Nino was comparable to the 1997/98 El Nino in some respects.
We only have reasonable sea surface temperature data for the equatorial Pacific for about 65 years. Many studies exclude the data for the NINO regions before 1950 because there is so little source data. With so little long-term data, who’s to say what’s “normal”?
1982/83 El Nino –
“Within the next few weeks, the ocean began to react to the changes in wind speed and direction. Sea level at Christmas Island in the mid-Pacific (see map) rose several inches. By October, sea-level rises of up to a foot had spread 6000 miles eastward to Ecuador. As sea level rose in the east, it simultaneously dropped in the western Pacific, exposing and destroying the upper layers of the fragile coral reefs surrounding many islands. Sea-surface temperatures at the Galapagos Islands and along the coast of Ecuador rose from typical levels in the low 70s (degrees Fahrenheit) well up into the 80s”
” Overall, the loss to the world economy in 1982-83 as a result of the climate changes amounted to over $8 billion. The toll in terms of human suffering is much more difficult to estimate”
http://www.atmos.washington.edu/gcg/RTN/rtnt.html
Great post. It should be interesting to watch for the formation of atmospheric rivers. A couple of big ones occurred in 1997 and 2006.
http://www.esrl.noaa.gov/psd/psd2/coastal/satres/data/html/ar_detect_gfs.php
Thank you for the report!
Just in case any one is wondering about it, there is absolutely no way that UAH will beat 1998 in 2015. With an 8 month average of 0.223, the average over the next 4 months needs to be 1.00 to beat 1998 this year. The highest anomaly ever was in April 1998 when it was 0.742. It is a big jump from 0.276 in August to 0.742. However while 0.742 could get beaten by December, there is no way that we can average 1.00 over the last 4 months of 2015.
The same general situation applies to RSS.
Not expecting a possible sudden jump until at least November, so rules it out further.
I will say, that all these “anomaly” graphs are just so frustrating. To look at these anomaly graphs, one would come to think that the Pacific is warmer than the gulf of mexico. Is that true??
Hi Dr. Deanster: Let me begin with, we’re not looking at the sea surface temperature anomalies of the entire Pacific. I’ve presented the sea surface temperature anomalies for four regions of the equatorial Pacific. Also, there is no way to look at an anomaly graph and assume one region is warmer or colder than the other. Anomalies are deviations from normal for the specific region being shown.


We use anomalies for a number of reasons.
First, using the NINO3.4 region of the equatorial Pacific and the Gulf of Mexico as examples, there can be large seasonal components to the sea surface temperature data. Due to the seasonal components, it’s difficult to determine if anything unusual is happening by looking their monthly temperatures in absolute form.
A second reason, there can be very large differences in sea surface temperatures. Imagine trying to compare the sea surface temperature for the Southern Ocean, which surrounds Antarctica, and the NINO3.4 region of the equatorial Pacific to see if there’s an interrelationship.
To answer your question, right now, the sea surface temperatures of the Gulf of Mexico are warmer than the equatorial Pacific, but three months ago they weren’t, and for most of they year they are not. On an annual average basis, the NINO3.4 region is warmer:
Last as a reference, here’s a comparison graph of the sea surface temperature anomalies for the NINO3.4 region and for the Gulf of Mexico:
There’s no reason to be frustrated by anomalies.
Cheers.
I’m pretty sure it just means the (N) Pacific is warmer than it typically is, more-so than the Gulf is warmer than it typically is.
As I recall during the past strong El Niño events, the Midwest was warmer and drier than normal. I hope this trend continues this winter. I will keep my fried old snow blower and defer the purchase of a new one until next winter.
As you mention, Nini 1&2 may warm in the coming months, but I find it odd that the heat and surface height, after progressing eastwards https://sealevel.jpl.nasa.gov/science/elninopdo/latestdata/ (check archives for further progression) has now moved westward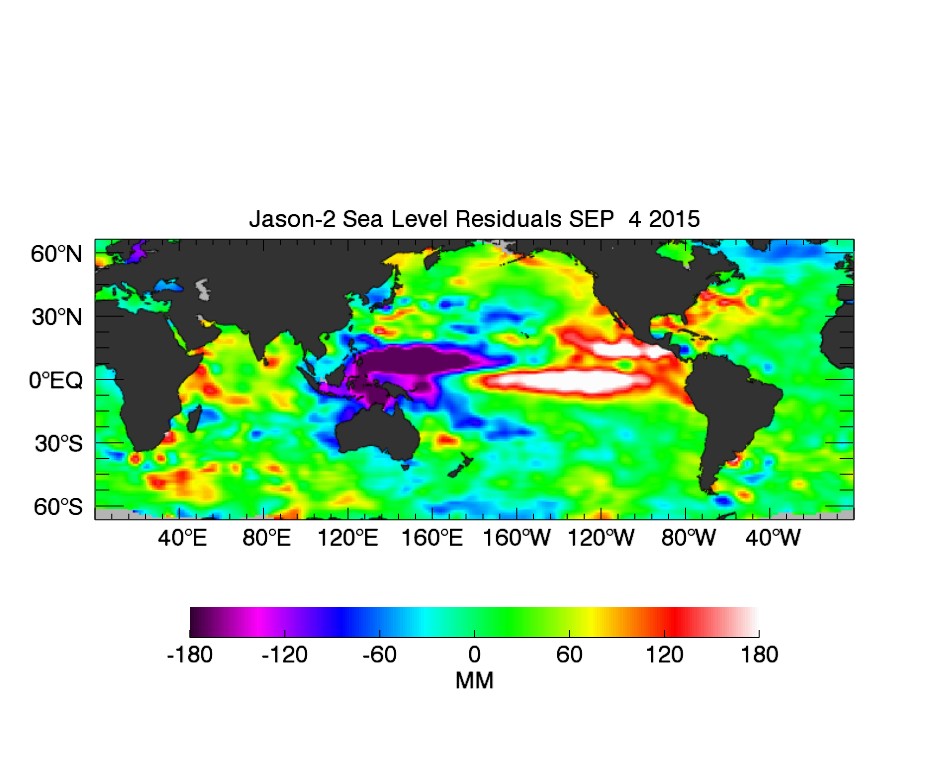 . (last image Sept 4 in the series)
This has fired up all the indicators (SOI, 3.4 anomaly) that look as if it heading to a ’97 event. To me the (non anomaly) SST image http://weather.unisys.com/surface/sst.gif seems to indicate a cold Northward pushing upwelling coastal SA event ‘warping’ the equatorial heat event Northwards. The ’97 Nino in full flight had heat smearing Southward down the SA coast, with, presumably no or little cold upwelling.
It will be an interesting few months ahead.
Thanks Bob.
Thank you for all the intense information. Yes, we are having an el Nino event. I hope this winter, unlike the last two, is warmer than usual, I was in the hospital must of this last summer and am still rather fragile and I don’t need a severe winter here in the Northeast NY region!!!
Consider moving West. Many pioneers moved West because of the hard Winters often experienced in the Eastern half of the US. Regardless, I hope the best for you.
Bob – Just to make sure I understand.
1) The ENSO process is a naturally occurring process. No credible person has claimed that the ENSO process is controlled by the level of man-made CO2.
2) The level of CO2 in the atmosphere has been monotonically increasing for 30-40 years.
3) If we do have a big El Nino year, then we are likely to see an increase in global average temperatures.
4) If we have a big El Nino year and global temperatures do increase, then the temperature records will show a stronger correlation between ENSO and other naturally occurring events than with the level of CO2 in the atmosphere.
5) Because we can not predict these naturally occurring events, we can not predict the climate.
Is that correct?
That’s a reasonable summary, leon0112.
Leon0112…Good points. But, “controlled by” is strong wording. Kevin Trenberth has made the suggestion that ENSO has been, or may have been, amplified by our added CO2. He is credible…although I don’t think he has been able to verify this independently. Others have simply assumed that our added GHGs have done so.
ENSO is nothing more then a temporary modulator of the climate regime the climate is in nothing more nothing less.
It has nothing to do with climate change unless processes brought ENSO into a permanent state of El Nino, or La Nina ,which is not going to happen.
For my part I think the El Nino will fade as this winter progresses.
I can see that SOME indicators line up for a 97/98 type event but many more indicators are very different. we don’t know enough (well maybe Bob does) to predict a massive event. It is all natural variation and I “feel” that this el Nino will not be as big or as far reaching as the warmists hope. They are hoping for a large warming event so they can say “see told you it would start warming again” for what it is worth I don’t think this will happen, more cold winter for the northern hemisphere and a slightly warmer southern hemisphere summer, nothing outstanding and certainly nothing to do with CO2.
Joe Bastardi believes the same.
There is no doubt this is going to be a top 3 El Nino now. Although this year has about a 2 month head start, so if it stays this way won’t become stronger than the strongest in 1997/98 (since the 1950’s). It wasn’t until January 1998 until temperatures across the continents suddenly raised, so because of a 2 month start should be looking for around November time.
http://i772.photobucket.com/albums/yy8/SciMattG/RSS%20Global_v1997-01removal_zpszk83g0xi.png
If this happens again there will be no doubt that ENSO contributes increasingly greater towards global temperatures than any CO2 contribution.
Seems to be 2 options that this will conclude.
1) There is a step up in global temperatures after the usual La Nina that follows a strong El Nino.
2) No step up occurs after the following El Nino and global temperatures remain stable or even fall below the mean after the following La Nina.
If 1) occurs likely to be excess energy still to be released out of the tropical oceans from previous solar activity/reduced global cloud albedo.
If 2) occurs likely the excess energy has previously been lost in 1) and as a result this has been lost to the atmosphere and with no top up resulted in stable or decline in global temperatures.
Any chance of California getting enough hard rain to wash out some of the slime infesting the state?
No, California slime is remarkably persistent. Especially Brown slime. 🙂
and the slime stays indoors, usually in government buildings
Yes, this winter should be wetter and cooler than usual for southern and central CA. Hopefully we’ll see some atmospheric rivers but I hope they don’t last too long – could produce major mudslides after the drought and severe forest fires.
It seems like region 1-2 is still not getting with the program. Mind you in 1997 we didn’t have “the blob” so I’m looking forward to a warmer winter out west and have told my relatives out east to make sure the snow blower is tuned up.
Now there have been 2 instances of an el-nino going 3 years but very rare. I’m planning on next year to be a la-nina year and much colder out west. Enjoy it while it lasts.
After years of living in Bakersfield, California and Houston,Texas; the weather in Kailua Kona, Hawaii is like heaven to me. Everyone I talk to here tells me that this summer has been unusually hot, humid, and rainy. In fact, the rainfall in Kona over the past few weeks has been closer to what I would have expected in Hilo. The trade winds also seem to be more intermittent than normal. When people comment on the unusual weather, I tell them it’s most likely due to El Niño, though I’m not really sure myself.
Bob; Are these weather conditions in Hawaii consistent with El Niño?
Since an El Nino releases energy from the ocean to the atmosphere,
… wouldn’t that make it an ocean cooling event ?
Yes you are correct and la-nina is the recharge phase where the ocean gains heat while you and I get cold. See I learned a lot from Bob’s PDF book 🙂
Top notch stuff on this concentrated warmth in a few percent of the earth’s surface that has such a global impact. Surely at least one reader in a lofty position in academia will come forward and give Bob Tisdale a PhD in oceanography/climate – he’s been writing his thesis at the highest level for years. He’s already written your textbook for you. A second one for the eclectic genius in science, Willis Eschenbach. He covers a lot of territory with ocean, land, atmosphere, sun, biology/ecology/extinctions (or not)/botany, ichthyology, ornithology, volcanoes, storms, atoll dynamics, renewable energy, agriculture, deserts, the carnot cycle, and whatever comes up in the subject of climate and the planet’s many spheres.
I predict something like this will happen eventually because I have to believe that there are a lot of decent people out there in positions of authority over these kinds of things.
So it still looks like we might, possibly, die nearly as much as we died in 1998.
Thanks Bob, always worth a read, especially when I’m in the mood for just looking at information, not opinion.
An executive summary up front that cuts to the bottom line & gives a clear explanation of the trends of conclusion(s) to be drawn from the data would be very useful.
Most non-scientists aren’t much interested in wading through so many detailed charts & graphs … Although useful in helping to see the events, they get to be a bit much for non-climatologist readers.
I’m probably not as bright as I once thought I was but even after reading the post twice I’m still not sure what I was supposed to learn from it.
I took away a enlightening description of nature doing its thing, and what will eventuate is (as usual) totally up to the vagaries of the chaotic system we know as ‘climate’.
Were you expecting Bob to forecast how much more we should tithe to the UN to stop the climate(s) from changing?
If you can’t understand the data and graphs, there are plenty of popular el Nino stories that explain things with little graphic information. We come here for the science, for the most part.
Am waiting for the woolly caterpillars to emerge. They were cream colored for the 83/83 El Nino event. The past two falls they were almost black. As I recall they were light colored for the 97/98 El Nino. Ha-Ha!
Last week I picked one from the concrete slab in front of the house (central WA State) and moved it to the backyard. However, color is hard to interpret:
http://web.extension.illinois.edu/state/newsdetail.cfm?NewsID=26251
More charts …
1. Troup’s Daily SOI
2. Indices Comparison
Timing is very different from 1998/9. Closer to 2002/3. A susprise may be in store for some when the La Nina that will surely follow kicks in …
http://ocean.dmi.dk/arctic/plots/meanTarchive/meanT_2015.png
http://ocean.dmi.dk/arctic/plots/meanTarchive/meanT_1998.png
The see-saw has tipped … go Humboldt. You have a meeting to inform in Paris around November.
http://nsidc.org/data/seaice_index/images/daily_images/S_stddev_timeseries.png
http://nsidc.org/data/seaice_index/images/s_anom.png
Arrgh, typo and wrong arctic comparison … 1997/98.
http://ocean.dmi.dk/arctic/plots/meanTarchive/meanT_2015.png
http://ocean.dmi.dk/arctic/plots/meanTarchive/meanT_1997.png
No spike, greater proportion of dissipation gone south.
“The bigger they are, the harder they fall”, also applies to El Nino events.
After the 97/98 Super El Nino, ENSO temperature anomalies dropped from +3 C to -1.2C within a year; a 4.2C drop.
Since the current El Nino is similar in scope to the 97/98, we should expect a similar, if not an even larger drop in ocean temps because the current El Nino is a rare 3-year El Nino event and the PDO started its 30-yr cool phase in 2008.
CAGW alarmists were lucky to get a strong El Nino to coincide with for their precious Paris Doom & Gloom summit, as they’ll have their “hottest year eva” mantra to propagandize (at least for HADCRUT4 and GISTEMP), but strong El Nino events are a two edged sword.
During strong El Nino events, global temps do spike, BUT, that also means many thousands of Quads of stored ocean heat are blown out to space; it’s nature’s way of seeking equilibrium and followed by global cooling.
It reminds of the following:
“For over a thousand years, Roman conquerors returning from the wars enjoyed the honor of triumph, a tumultuous parade. In the procession came trumpeteers, musicians and strange animals from conquered territories, together with carts laden with treasure and captured armaments. The conquerors rode in a triumphal chariot, the dazed prisoners walking in chains before him. Sometimes his children robed in white stood with him in the chariot or rode the trace horses. A slave stood behind the conqueror holding a golden crown and whispering in his ear a warning: that all glory is fleeting.”~ General George S. Patton Jr.
If temperatures increase due to a strong El Nino, then this is evidence AGAINST CAGW. Forgive the appeal to authority, but 97+% of all scientists believe that ENSO events are naturally occurring events. If the last two big upsurges in global temperature were tied to big El Ninos, then natural variation is driving the climate. NOT man made CO2.
Big run up in temperature associated with ’98 El Nino. Warming Pause. Another big run up associated with ’15 El Nino. Constant increases in man made CO2. Global temperatures tied to natural events, not man made CO2.
“… it’s nature’s way of seeking equilibrium and followed by global cooling.”
The sad fact of climate “science” is that the warmists (who are in charge of almost all the research dollars — 99%?) do not seek to understand the earth’s weather machine. They do not care to know how the planet’s climate seeks equilibrium though various feedbacks — both positive and negative feedbacks. They do not even seek to understand natural variations in climate: if you can not blame it on human activity they are not interested.
Humankind could have learned so very much more about our climate over the last 40 years if the governments had not decided they needed a good scare to keep the people in line and act as an excuse to fleece them with ever more taxes, crony-deals, regulations, and all the rest. It is a crime against the human race — especially the poor among us who are least able to afford the government’s gross theft of opportunity.
Someone posted this on Jo Nova’s website.
This is the most easy to follow animation I have yet seen on how this El Nino is developing.
http://weather.gc.ca/saisons/animation_e.html?id=year&bc=sea
Nice animation.
The hot plume coming out of the coast of S America appears to have already become disconnected from its coastal source. Does this mean it has run out of steam?
Thanks for that.
If you take your eyes away from the Pacific and look at the North Atlantic, it helps to explain why the UK has had a rather cool few months this summer. The most common wind direction (westerly) is coming from an unusually cold sea.
Note that the West Coast North America ocean is hot but the entire half of the Atlantic facing Europe and Africa is very cold! This duality is highly important and totally ignored.
Great post and great replies! As one of the not too bright i appreciate it.
Just as a matter of interest what scale are the SSH anomalies in figure 16 – anybody