UPDATE: See the note at the end of the post.
Date: June 10, 2015
Subject: Karl et al. (2015) Possible artifacts of data biases in the recent global surface warming hiatus and the Sea Surface Data that Support It
From: Bob Tisdale – Independent Researcher
To: Tom Karl – Director NOAA/NCEI
Dear Tom: I’m writing to you with respect to the recent paper, of which you were lead author. The paper is, of course, Karl et al. (2015) Possible artifacts of data biases in the recent global surface warming hiatus (paywalled.) It presented the impacts on the recent slowdown in surface temperature warming of the not-yet-implemented changes to the NOAA/NCEI global land+ocean surface temperature dataset. The changes to the ocean surface portion (the NOAA ERSST.v4 sea surface temperature reconstruction), not the land surface portion, played the larger role in your findings. The changes to that sea surface temperature data are supported by the papers:
- Huang et al. (2015) Extended Reconstructed Sea Surface Temperature version 4 (ERSST.v4), Part I. Upgrades and Intercomparisons, and
- Liu et al. (2015) Extended Reconstructed Sea Surface Temperature version 4 (ERSST.v4): Part II. Parametric and Structural Uncertainty Estimations.
The intent of this letter to present when and how the new NOAA sea surface temperature data differ during the hiatus from the night marine air temperature data, upon which it is based, which are used for bias adjustments over the term of the data.
WHEN AND HOW THE NEW NOAA SEA SURFACE TEMPERATURE DATA DIFFERS FROM THE NIGHT MARINE AIR TEMPERATURE DATA, UPON WHICH IT IS BASED, DURING THE GLOBAL WARMING SLOWDOWN
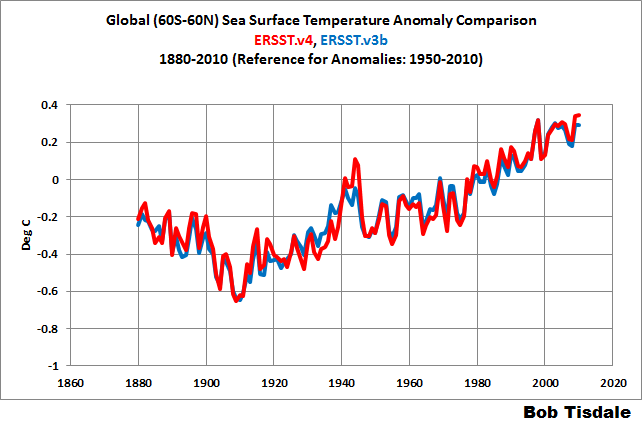
Figure 1 is Figure 3 from this weekend’s post More Curiosities about NOAA’s New “Pause Busting” Sea Surface Temperature Dataset. The new NOAA ERSST.v4 sea surface temperature data for the latitudes of 60S-60N have a noticeably higher warming rate during the hiatus than the UKMO HadNMAT2 data, which served as the reference for bias adjustments in your new ERSST.v4 data.  Figure 1
From January 1998 to December 2010, the last month of the HadNMAT2 data, the new NOAA ERSST.v4 data basically doubled the warming rate of the reference HadNMAT2 data. In other words, the HadNMAT2 data do not support your claims of no slowdown in global warming.
Someone might want to try to claim that the higher warming rate of the NOAA ERSST.v4 data is caused by the growing number of buoy-based versus ship-based observations. That logic of course is flawed (1) because the HadNMAT2 data are not impacted by the buoy-ship bias, which is why NOAA used the HadNMAT2 data as a reference in the first place, and (2) because the two datasets have exactly the same warming rate for much of the period shown in Figure 1. That is, the trends of the two datasets are the same from July 1998 to December 2007, a period when buoys were being deployed and becoming the dominant in situ source of sea surface temperature data. See Figure 2.  Figure 2
Note that magnitude of the trends during that time period. Back in 2008, few people were discussing a slowdown in global warming.
In reality, the differences in the trends shown in Figure 1 are based on the responses to ENSO events. Notice in Figure 1 how the night marine air temperature (HadNMAT2) data have a greater response to the 1997/98 El Niño and as a result they drop more during the transition to the 1998-01 La Niña. We might expect that response from the HADNMAT2 data because they are not infilled, while the greater spatial coverage of the ERSST.v4 data would tend to suppress the data volatility in response to ENSO. We can see the additional volatility of the HadNMAT2 data throughout Figure 2. At the other end of the graph in Figure 1, note how the new NOAA ERSST.v4 sea surface temperature data have the greater response to the 2009/10 El Niño…or, even more likely, they have been adjusted upward unnecessarily. The addition additional response of the sea surface temperature data to the 2009/10 El Niño is odd, to say the least.
What caused that unusual behavior, Tom? Could it possibly be the Lowess filtering you’ve elected to use for the bias adjustments, instead of the linear smoothing you used in the previous ERSST.v3b data? The support paper for the new NOAA sea surface temperature data, Huang et al (2015), states with respect to filtering as shown in its Figure 5 (my boldface):
The monthly fitting coefficients (gray lines) are shown in Fig. 5, which overall fits the fifth assumption that the biases vary slowly with time. To filter out potentially spurious high-frequency noise in the fitting coefficients, a linearly fitted coefficient was used in ERSST.v3b (Smith and Reynolds 2002). Subsequent to ERSST.v3b several analyses have highlighted the likely presence of substantive multidecadal bias variability throughout the record (e.g., Kennedy et al. 2011) rather than simply around the transition from mainly buckets to mainly ERI measures around the early 1940s. In ERSST.v4, a Lowess filter (Cleveland 1981) has been applied on Ay (Fig. 5) and allowed to vary the bias adjustments throughout the record. A filter coefficient of 0.1 is applied to the Lowess, which is equivalent to a low-pass filter of 16 years and represents the low-frequency nature of the required bias adjustment. The reason to apply a filter is to make the bias adjustment smoother so that it may be more consistent with the assumption of applying a climatological SST2NMAT pattern of Am,y. However, we stress that higher-frequency changes in SST biases are virtually certain to exist as indicated in Thompson et al. (2008), Kennedy et al. (2011), and Hirahara et al. (2014). Shorter windows or use of annually averaged data would be noisier by construction because the estimate at any given point would be based upon a smaller sample and it is not clear at what point there becomes a risk of fitting to random sampling noise rather than systematic bias signal. The preference is for robust estimation of the multidecadal component of the bias adjustments using a coefficient of 0.1 but may come at a cost of accurately portraying biases at times of rapid transition (e.g., the WWII era).
And as illustrated and discussed above, could the filtering you’ve elected to use also “come at the cost of accurately portraying biases at times of rapid transition” in response to strong annual perturbations from El Niño events during the hiatus? Something appears it may have definitely added unnecessarily to the buoy-ship bias adjustments of your new sea surface temperature dataset after 2007.
CLOSING
UPDATE: See the note at the end of the post.
Judith Curry commented in a recent post here that that the findings of your recent Karl et al. (2015) paper were based on cherry-picked methods:
This new paper is especially interesting in context of the Karl et al paper, that ‘disappears’ the hiatus. I suspect that the main take home message for the public (those paying attention, anyways) is that the data is really really uncertain and there is plenty of opportunity for scientists to ‘cherry pick’ methods to get desired results.
I would tend to agree. The results of the statistical methods used on the earlier version of the NOAA sea surface temperature data (ERSST.v3b) did not provide the results NOAA was looking for now, so NOAA/NCEI, under your direction, mixed and matched methods until they found the results you wanted (ERSST.v4).
I look forward to your reply.
Sincerely,
Bob Tisdale
# # #
UPDATE (June 16, 2015):
There continue to be comments about my introduction to a quote by Judith Curry in the closing of the post. See the comments starting here on the cross thread at WattsUpWithThat (WUWT) and the comments starting here on the thread of Tim Ball’s recent post at WUWT. I apologize for my poor choice of the word “commented” in the lead-in to the quote. Because Judith Curry didn’t specifically state that Karl et al cherry picked methods, I should have used the word “implied” or “suggested” in place of “commented”. It should have read Judith Curry commented implied (or suggested) in a recent post here that that the findings of your recent Karl et al. (2015) paper were based on cherry-picked methods:
Typo: “The addition response” -> “The additional response”
Thanks, Bob. I corrected it.
I suspect the reply will be along the lines of ‘La La La, I’m not listening!’.
There will be no reply. Why would anyone feel motivated to reply to an “open letter”, on what they surely regard as a hostile website, from someone who has not contacted them privately?
A simple article rebutting the science would seem more appropriate.
NMAT2 is itself is adjusted and “corrected” based on several variables including ICOADS SST. This makes adjusting SST on the basis of NMAT circular.
Explanation of the complex processing applied to derive NAMT dataset is provided in Kent et al 2013 http://onlinelibrary.wiley.com/doi/10.1002/jgrd.50152/pdf
What is rather odd is that NMAT2 has a pause; SST has a pause yet they combine the two to get a continued rise.
IMO the magic happens due to weighting factor of 6.8 that is applied by Karl et al in favour of float data, that has been warmed up by 0.12 degrees.
If they wish to suggest that NMAT is more reliable then they should conclude that the early 20th . warming ( natural ) is indistinguishable from the late 20th c. rise ( natural + AGW ). The logical implication is the AGW in undetectable.
I just picked up on this that Bob highlights from Huang et al (2015)
The Lowess filter has variable frequency response near the ends of the data. The usual kernel based filters require a full window and in this case would stop at least 8 before the end of the data ( even more for a well behaved filter ). Lowess starts to apply different processing at the ends to enable it to give a result, however there is no magic solution. You *cannot* effect a 16 year filter using 8 years of data. Period. Lowess may be a kind of 16y filter over most of the range but it is not that at then end.
What usually happens with Lowess is that it runs off in one direction or the other, similar to padding a running mean by repeating the last data point. Since the data is rising it will tend to run high at the end. This may well mean that thier “bias” calculations run in the last decade of the data.
This would appear to be borne out by Bob’s figure 1 above.
Good catch Bob.
Mike, you can see the differences in the late “run-off” in Figure 5 from Huang et al based on the different Lowess filters.
Mike says: “NMAT2 is itself is adjusted and “corrected” based on several variables including ICOADS SST. This makes adjusting SST on the basis of NMAT circular.”
According to Kent et al. 2013 (the paper that supports the HadNMAT2 data):
“This approach, combined with the later start of HadNMAT2 compared with HadMAT1, means that HadNMAT2 is not dependent on contemporary SST observations for any adjustments over its full period of record.”
See:
http://onlinelibrary.wiley.com/doi/10.1002/jgrd.50152/pdf
Cheers
Thanks, Mike. Yes, “circular”, as in positive feedback.
Thanks Bob. In this case lowess (0.1) seems to work OK at end . The 32y version is suspiciously flat. At the beginning of the series both the 32y and 16y lowess are obviously badly distorting the data. Of course, knowing whether a filter is going to work “about right” or distort the data makes it useless.
IMO lowess should apply consistent processing to all data and stop when it can’t, ie at the ends, just like any other fitler. One of the reasons climatologists seem to like lowess is because it runs up to the end of the data but this is just as bad a padding a running mean etc. Amateur time.
re. SST yes they do say that. Which still means SST is an input to NMAT even if it is not month by month. Now consider the air-sea difference. There is massive swing of about 0.5 K around Sept 1939 . So using the “climatological” average will be badly out on both sides of that date. This was the original motivation for all the “bias correction” going on in HadSST2 and later.
This reflected in the graph you reproduce from Huang. We can also note that NMAT get replaced by SST for Suez area at the end of 19th c.
Now if the air-sea difference is wrong, then all the guessing games and models about changes in the boundary layer will be wrong and compensation for deck height will be wrong. This is quite complex processing.
I can see why Hadley had not made this data public yet. They had released a paper for discussion of their methods but were not confident enough to publish the dataset. It would have been wiser not to let Tom Karl play with it either. Once that was out, they were under precssure to release NMAT2, even though they clearly were not ready to do so.
As usual, anything that does not fit preconceived expectations is deemed to be a “bias” and is studiously rubbed out. This means that any real climate effects get “corrected” away and all that is left is what they expect to be there : AGW plus some wiggles to make it look “climatey”.
I suspect it will be more like:
My paper was peer reviewed by a couple of my best friends and therefore there is nothing wrong with my data or methods.
MarkW
But who WAS it reviewed by? Who are the “two” star-panel all-knowing judges of all things dumped in wet buckets in wet oceans the past 100 years?
Good one Bob – both barrels. with pinpoint accuracy and from short range
Ah but Government “climate scientists” are fitted with teflon-coated kevlar vests.
It is often said, “Never engage in a battle of wits with an unarmed opponent.” This is not, despite surface appearance, because it would be unfair to your opponent. Rather, it is because such a duel is unfair to you. For one who lacks the means to engage in a battle of wits, lacks also the means to recognize when he has lost, making him an indefatigable, if inept, opponent.
(If you like the above, feel free to use it. I first found it on some forum — talk.origins, perhaps? — sometime in the ’90s. I don’t remember who said it, and I’m sure he put it rather more elegantly. Or, if you recognize it, could you tip me off as to the author, who so richly deserves the accolades?)
mellyrn: There appear to be many attributions: http://quoteinvestigator.com/2014/06/24/wit-battle/
No, no — not the “battle of wits” original. I want to know who pointed out that the “unarmed” one can’t lose.
The quote I recall is ‘never argue with a fool as its hard to tell which is which’
In a similar vein: Never wrestle with a pig, you both get dirty and the pig enjoys it.
Or, Never teach a Pig to Sing…It wastes your time and annoys the pig
Actually it should read
Arguing with a Climate Scientist is like teaching a Pig to Sing…It accomplishes nothing and annoys the Pig
It is hugely damaging to the image of CAGW advocates that sceptics are now openly questioning whether their has been tampering with the raw data to exaggerate evidence for global warming. People have an instinct about dishonesty and often have zero tolerance for people in power lying, it is like a switch, switch it and your reputation and everything you say is turned to dust.
Keep up the questioning on this subject and go on writing open letters. They might ignore you but they will also be feeling heavy punches and not liking it
I believe it has been openly pointed out that [there] has been tampering. Any graph that shows the 30’s as cooler then today is a lie.
In Law the Latin term is “Falsus in Uno, Falsus in Omnibus” (false on one thing, false in all things.)
The trouble with pointing out the factual errors has means to review such ‘research’ is that it makes the assumption that such errors matter. In reality they do not , the authors know that within the area of climate ‘science’ facts have a very low value , the real value of work comes not from the reality of your data, but from the ability of your claims to show ‘faith in the cause ‘ and to provide useful PR through green friendly press headlines .
In both cases Karl’s work has real value and follows in the path of fact light , or even lied filled , ‘research’ such papers from Mann, Cook, Lew , which have become part of the CAGW dogma which requires the faithful to so often defend the indefensible.
By all means point out the problems, but do not expect to have any affect.
I imagine a reply, if any, will be filled with even more distortions, all in the same direction.
You tell him, Bob!
The problem is He can just ignore this letter and probably will, or respond with the equivelence of “We are the Scientists and we know what we are doing”. In other words mind your own business.
What is really required and will never, ever happen is for all those Newspapers, Journals and Magazines that ran the original “headline” story also printed the letter for balance.
As I said sadly it will never happen, it might get printed by Booker, Rose or Delingpole, but that would be all.
About six months ago Booker began running serious stories about data tampering, it was a big moment because this had been a taboo subject. Booker’s stories are usually ignored, but the important ones then resurface as scoops two years down the line, it is a process.
These allegations are already leaking into the landscape of the collective consciousness of the media, it will appear as if nothing is happen or getting through, that is a wrong impression.
The other allegation that is seeping in is that the whistleblowers/sceptics like Willi Soon are being bullied. The combination of these two stories will be toxic to the case for CAGW. We should be feeling optimistic about these developments
“The intent of this letter to present when and how the new NOAA sea surface temperature data differ during the hiatus from the night marine air temperature data, upon which it is based.”
Bob, it doesn’t help to start such a missive with a totally wrong assertion. NOAA SST data is not based on NMAT. That is why it is called SST, and why there is such fuss about buckets, engine intakes, buoys etc. Nor is it a reference. It may be a point of comparison. A problem with NMAT is the sparsity of data. It’s a puzzle, because I presume you know all this. So Fig 1 will fall flat.
Nick, you know very well that I understand that NMAT and SST datasets are based on different source data. Why do you even mention it?
You obviously have not read Huang et al. 2015. As you’ll note in Table 1, HadNMAT is used as a reference for bias adjustments over the term of the data.
http://rda.ucar.edu/datasets/ds277.0/docs/ERSST.V4.P1.JCLI-D-14-00006.1.pdf
You may not like my phrasing “upon which it is based”, but the new ERSST.v4 data, for the most part, mimic the HadNMAT2 data over the overlapping terms of the two datasets (1880 to 2010), where with the earlier version of NOAA’s sea surface temperature data (ERSST.v3b) there is [less] agreement, especially during the 1940s through 1970s.
Nick, correction: the clause “where with the earlier version of NOAA’s sea surface temperature data (ERSST.v3b) there is no such agreement” should read, “where with the earlier version of NOAA’s sea surface temperature data (ERSST.v3b) there less agreement”.
Nick, I have amended the text you didn’t like to “which are used for bias adjustments over the term of the data”.
“Why do you even mention it?”
Bob, I mentioned it because the statement was clearly wrong, and probably unintended. Your revised statement is better.
Huang et al do use NMAT for bias estimation, but that does not mean that they expect SST to track NMAT, else why not just use NMAT? They in fact show in Fig 5 how they observe the difference to evolve over time. They use NMAT as a reference to detect systematic differences between different SST methods, at a point in time. They don’t expect SST-NMAT to stay constant. That’s why your Fig 1 misses the mark.
The arithmetic is set out in their Eqs 5 and 6. C is the climatological difference SST-NMAT, expected to be stable over time, (but seasonal). But the coefficients A certainly aren’t, as Fig 5 shows.
Nick, are we having troubles with semantics again?


Let’s run through a sequence here.
ICOADS is the source for sea surface temperature data. Here’s the ICOADS data compared to the new NOAA ERSST.v4 data for the latitudes of 60S-60N.
So that’s the start product versus the new NOAA end product.
NOAA wasn’t obviously satisfied with their earlier ERSST.v3b data, so they updated it to ERSST.v4. The two are compared next. NOAA used an earlier version of a marine air temperature dataset for bias adjustments of the ERSST.v3b data, but they ended those bias adjustments in the early 1940s.
On the other hand, NOAA used the UKMO HadNMAT2 data for bias adjustments over the full term of the data, which is why the ERSST.v4 data mimic the HadNMAT2 data.
NOAA certainly did not use the HADSST3 data for the bias adjustments on the ERSST.v4 data.
With respect to Huang et al. Figure 5, it presents the temperature difference between the ICOADS sea surface temperatures (absolute) and the HadNMAT2 night marine air temperatures (absolute), with the different Lowess filters applied to the difference. For the next graph I’ve converted them to anomalies before subtracting the HadNMAT2 data from the ICOADS SSTa data.
Also shown is the difference between the ERSST.v4 data and the ICOADS SSTa data. There are of course differences between the two curves due to infilling, data filtering and additional tweaking, but it’s blatantly obvious to create the ERSST.v4 data, NOAA subtracted the HadNMAT2 data from the ICOADS SSTa data…aka bias adjustment so that the ERSST.v4 data mimicked the HadNMAT2 data.
Nick Stokes
You said something useful.
The replication in writing of what is in the mind is actually quite difficult. We think far less in words than most psychologists believe. One of the reasons that psychology is in such a bad state is that psychologists are trained to be “word thinkers”.– but that is off topic.
Eugene WR Gallun
This was a very good open letter Bob. Thanks for taking the time to do it.
For years now I have seen government agencies and those that they regulate pervert data and distort various trials or experiments. These perversions have gotten ever worse with time. We must call out the perpetrators every chance we get so the public can start getting the idea that climate “science” and medical “science” no longer follows the scientific method and the so-called results they get are near worthless.
I have no idea what it would take to get the scientific community to return to the scientific method and honesty, but I do know we need to do that to prevent wholesale disaster in many areas. Trofim Lysenko and his pseudoscientific movement termed Lysenkoism is one example of what happens when politics poisons science, but there are many, many more.
“regulate pervert data”
What is pervert data, and does it have anything to do with the big discussion regarding the term lesbian, that we had yesterday?
No, I missed the lesbian discussion.
“pervert data” should read “perverted data” …. although, I do think “pervert data” is not far off the mark.
Actually the original just needs commas “government agencies, and those that they regulate, pervert data…” to read well.
““pervert data” is not far off the mark.”
Mark, that’s a priceless quote. 🙂
Predicted Responses:
1) “If this is an issue you should publish in the peer reviewed journal.” Which would then let Karl et al do the peer review. And thus the paper would never see the light of day (at least until after Paris).
2) “This is just a conspiracy theory.” Even though Karl et al claims that everybody else has been faking the Pause for the last 15 years which seems to imply Karl et al think the exact reverse. Logic cannot be a strong suit of anyone who wrote this paper.
3) Just ignore it. Their reputation is damaged already.
Or possibly…
4) retraction of the paper.
But that requires integrity.
[Italics added. .mod]
The predicted response is…….NOTHING
The paper has served its purpose; it has been widely quoted in the Press, the BBC and other news outlets. The ‘pause’ never existed, that’s the message people hear.
Just like the 97% consensus. The facts don’t matter.
MikeB
I agree, it’s like apologies printed in the UK Press after a front page story which lasted several days; usually a short paragraph buried somewhere on page 17 with other space fillers.
The message; Keep it simple and keep repeating it.
It will help them in Paris but in the long run this sort of thing stinks and the press are beginning to catch on. It will be a pyrrhic victory for the advocates of CAGW, and it will haunt them when their backs are against the wall.
Data tampering is a pivotal issue in this debate because it goes to the heart of the credibility of the science (if it is a science)
Julian said “…the press are beginning to catch on.”
Wake up and smell the coffee, man!
The liberal-dominated press are in on this sc@m!
Why is public funded research “paywalled” ?
This link is not paywalled. http://www.sciencemag.org/content/early/2015/06/05/science.aaa5632.full
Nonetheless, your point is an extremely important one about public funding of science in general.
Often, if you write to the author and ask for a copy, they will send you one for research purposes.
But not if your only reason is to show they’re wrong!
Surely there is a fundamental flaw of logic in this – and many other papers?
The data is the data. Unless we have “better” data – in which case that is surely “the data” – how can we adjust the best data we have?
It is the same with all these temperature adjustments. Homogenisation is fine, as is using the data to infill areas with missing data, but on what possible basis can reasonably accurate data be changed using less than reasonably accurate proper data?
If you simply substitute less accurate and less reliable data for more accurate and more reliable data, your conclusions MUST be less accurate and less reliable.
I often suggest that the error bands should be increased whenever making adjustments/homegenisation.
One may have the intent that the ‘adjustments’ are corrections in the right direction, but it may be that far from ‘improving’ the data, they are perverse and render it less accurate.
The truth is that none of these data sets is fit for purpose, and those that use them go on to over extrapolate them.
The problem is, that when it comes to both land and sea based temperature measurements, even the best just ain’t very good.
“better than nothing ‘ is a standard approach to data quality within climate ‘science’
Data, once “adjusted”, cease to be data; rather, they become merely estimates of what the data might have been, had they been collected timely from properly selected, sited, calibrated, installed and maintained instruments. “Infilling” merely spreads these estimates to adjacent areas in which no instrument has been sited, or in which the sited instrument in non-functional.
If data are important, then data collection and accuracy are important. This is particularly true in fields such as climate science, in which it is impossible to rerun experiments plagued by bad or missing data. The cavalier attitude of climate science toward data accuracy and comprehensiveness is appalling.
You hit the nail on the head.
Is it OK if I quote you when explaining what is wrong with current climate science?
Very well said. Every adjustment to the data weakens the data.
(Tree) Woof, Woof!!!
The Karl paper was widely reported within 12 (not 24!) hours of it’s release. Here at WUWT, we were witness to the pre-publication announcement, leaking to the press, and the announcement of the paper by press release.
Let’s stop for a minute. How many of us have had a paper appearing in the peer reviewed literature announced with a press release? I am sure many of us, getting published for the first time, thought the event was worthy of a press release, but alas, it was not to be. (Bitter Disappointment) As one professor put it, “next time, act like you have done it before”.
So what is the point?
Simple. We need to do Public Relations. We need to Know people who Know PR. We need to cultivate people in the media. Without PR, our message is simply not heard.
In fact, The Karl paper was a good demonstration of how to get a message out. Instead of decrying the methods, people should have been taking notes. Sure, the warmists, with government aid have a big advantage, but that is no reason to give up, it is the reason to redouble efforts in that direction.
Heartland Institute at least makes a splash (Go Team GO), once a year. But it needs to be a constant effort.
Wish I was there this year.
The largest single impact on recent SST warming trends in Karl, et al., resulted from the decision to extend ship data corrections beyond 1941 into the present. They used the NMAT data to compare with the post-1941 ship data and decided NMAT data justified the ship data adjustment.
As they state in the supplemental materials:
The explanation quoted above implies that uncorrected buoy data was used to test of the validity of extending ship adjustments into recent years. It states that the buoy data was “co-located” and “[without] the offset added.”
If extending pre-1941 ship data adjustments by itself produced nearly perfect agreement (-0.002 C/decade) with the uncorrected buoy data — why did they add an additional 0.12 C to the buoy data afterwards?
Note: This is separate from the issue of how they weighted the buoy data to reflect the growing number/influence of buoys in recent years. I’m just trying to get a grip on when in the process, and why, they adjusted both the buoy data AND the ship data if a single adjustment placed them in agreement.
“The trend of uncorrected ship minus buoy data was -0.066°C dec-1,…”
I have a problem with a number like that without a confidence number being provided. I am getting tired of these amazing strings of significant digits.
“I have a problem with a number like that without a confidence number…”
Why do you need confidence numbers? They are unnecessary for adjusted data. And if you’re going to adjust, it only serves to increases accuracy by adding resolution. It’s good to be the king…
“…I wish I believed in global warming,
I could cast scientific principals aside,
And understand that their “settled science”
With real evidence you can’t override…..”
From: http://rhymeafterrhyme.net/i-wish-i-believed-in-global-warming/
It used to be that observable data was used to prove or verify a theory. NOAA latest proposed “RUBBER BAND” datasets now do the opposite . The unproven and flawed theory is used to modify the very latest the observable data gathered with the latest equipment . No data is sacred any more as NOAA blindly modify any observable data to suit flawed theory which satisfies political goals of their bosses . if the scientific community turn a blind eye to this , then science as we used to know , is doomed .
“The results of the statistical methods used on the earlier version of the NOAA sea surface temperature data (ERSST.v3b) did not provide the results NOAA was looking for now, so NOAA/NCEI, under your direction, mixed and matched methods until they found the results you wanted (ERSST.v4).”
Assuming that is correct, Karl’s response will no doubt be a smug “cricket chirp”.
Bob – just looking at Figure 1 and Figure 2, how would the results change if you ignored the data prior to 2002? Just eye-balling it, it would appear that the trend goes away, or even changes to down.
As a second more rhetorical comment, lets assume that the trend numbers are correct. They are being used to peddle CAGW. However, there is nothing catastrophic in any of the trends.,
I commend realists in their efforts to challenge papers such as Karl et al. (2015). They must surely know that over the next few months, the world is going to be inundated with numerous other “Karl et al” type papers in order to boost the propaganda behind the flawed global warming doctrine leading up to this December’s Paris Climate Conference.
The reality is that what these alarmists are now producing is “crappy science” designed to fit a political narrative. You see, these people, who are determined to make Paris December 2015 a success by achieving an international agreement on fossil fuel energy use, have long abandoned credible science. Karl et al. (2015) is proof of that. In fact, the climate science is now totally irrelevant because realists have already blown apart the flawed global warming doctrine and its crystal ball models.
The proof that the science is irrelevant is evident by what comes out of Obama’s mouth. Obama seems to have assumed the role of a self-appointed “Grand Mufti of the Mosque of Dangerous Man-Made Global Warming” … determined to save the world from climate catastrophes. And he’s going all out for it because he knows nobody can stop him!
What ever happened to the vaunted “Separation of Church and State” purportedly revered by the progressives?
“Enquiring minds want to know.”
‘ now producing is “crappy science” designed to fit a political narrative.’
Actually they been doing this ,and getting away with it, for years , you could even ask that if you where to take away these types of papers what would be left of climate ‘science’ research?
Has anyone requested / demanded a retraction of the paper? What is the process for refraction?
Greg, it’s the change in direction of propagation of a wave due to a change in its transmission medium. The phenomenon is explained by the conservation of energy and conservation of momentum. Due to change of medium, the phase velocity of the wave is changed but its frequency remains constant. That’s refraction.
Sorry Greg, I just couldn’t resist it 🙂
No she didn’t. Re-read the quotation you provided. She said there was plenty of scope for cherry-picking, she did NOT accuse Karl et al having done so. If you wish to say that, make your case, but do not misrepresent what Judith Curry or others have said to suit your own arguments.
That is quite improper and should be ammended.
How can Karl bake cherry pie
Sans picking cherries where they lie?
================
Too good!
That’s no cherry pie, my friend,
it’s more a cheesy cake,
of which the naïve media
voraciously partake.
He meant to say that the data was highly cherry-pickable.
“….. lets assume that the trend numbers are correct. They are being used to peddle CAGW. However, there is nothing catastrophic in any of the trends.,”
EUREKA! You’ve identified a true catastrophe!
As always, I truly do love a good graph of an experimental result — two experimental/observational results — without any sort of error bar, or error envelope, or error analysis. For one thing, we cannot tell whether or not the difference between the two SSTs is significant or insignificant. For another, we cannot tell whether or not we should be inclined to believe the error estimate, since it could hardly be less than the correction from the previous version to the new version (and I’m sure that the previous version had a similar error estimate given a similar base of data). The point being, of course, that one cannot really estimate the probability that a bias correction to better match an uncertain result is itself correct.
I think that this is basically what you (and Judith Curry) are saying — that if you ignore any discussion of expected error, one can always find a way to tweak the data within it so that it shows warming, or cooling, or flat behavior and stays within its bounds, but all that means is that the change is not significant (in addition to being cherry-picking, the direct implementation of confirmation bias, etc — many statistical sins).
The problem with statistical sins is that over time, they will return to bite you. If NOAA’s SST proceeds to consistently diverge from ARGO-based SST, especially as the number of ARGO buoys continues to smoothly increase, it will become apparent to everybody that the former is incorrect and that the “adjustment” used was ill-considered. The timing of the release of the result — right before G7, leading into the meeting later this year — will also be highly suspect. Karl had better hope that nobody decides to throw him under the bus, as he is now directly challenging Hadley and the ARGO project both and it wouldn’t be completely surprising if congress decided to get into the act and ask him some pointed questions about the transparent political timing vs the need for objective science.
In the meantime, we can chalk this up to the latest in a long, long string of “corrections” that somehow always warm the present compared to the past compared to the previous un- oops I mean “less” — corrected analysis of exactly the same data! I’m dazzled.
rgb
it is truly amazing that supposedly scientific error corrections come without any error bars. for all we or anyone else knows the error corrections have increased the error.
In any case, a warming rate of less than 1.5 degrees per century, most of this confined to night time temperatures in cold regions of the earth, with very little daytime warming or tropical warming, is hardly the stuff of catastrophes.
So what if the nighttime temperatures get a little bit warmer in colder regions of the earth? This will tend to reduce frost kill of vegetation and people, making it easier to grow food and easier for the poor to heat their houses.
Cooling is simple and cheap. All it takes is water and evaporation and a warmer world is a wetter world. Heating on the other hand is expensive, because it requires energy. As a result it is cooling that is to be feared.
RGB, Karl relied on Huang. Huang’s 0.12 buoy adjustment (table 1, last line) comes from Kennedy et. al. 2011, which is cited multiple times. J. Geophys. Res. 116 : D14104. Huang notes that Kennedy found substantial evidence for correlated uncertainty, then makes a simplifying assumption that the errors are not. Section 2, third from last paragraph. Later he says in section 4b that the ignored correlated uncertainty might have a big impact “and requires substantive further investigation.”
The calculated 0.12 buoy adjustment is explained in section 5c. Huang computes 0.12 applying Kennedy’s method to Huang’s raw data. He gives no uncertainty interval. AND he does NOT note that Kennedy’s own estimate was to cool ERI, not warm buoys, with 0.12 plus or minus 1.7C! A factor of 10 greater uncertainty than the adjustment itself. GIGO. Thus was this reguritated dogs breakfast created.
rgb : “I think that this is basically what you (and Judith Curry) are saying — that if you ignore any discussion of expected error, one can always find a way to tweak the data within it so that it shows warming, or cooling, or flat behavior and stays within its bounds, but all that means is that the change is not significant (in addition to being cherry-picking, the direct implementation of confirmation bias, etc — many statistical sins).”
Exactly.
I think this is the key point that should be made in response:
If a data adjustment can create warming from a pause, then who is to say another adjustment might not make a pause out of ALL of the warming? The science feels decidedly unsettled…
Thanks rgb, I have wondered about your point at the bottom of your comment : We’re adjusting the dataset now, we’re in a better position to do so “, however we’re not going to remind you that the dataset has already been adjusted N times. Further, we’re not in a position or don’t have the time to fully explain how we have or have not taken OUT all previous adjustments OR in our process correctly brought forward all the margins of error since we MAY not have simply gone back to the ORIGINAL dataset – IF it were available and we are inclined to share it now.
I’m beyond dazzled …. dazed …. and further confused – guess that’s what the AGW camp always wants.
New paper finds the 18+ year ‘pause’ of global warming is not due to missing heat hiding in the deep oceans
http://hockeyschtick.blogspot.com.au/2015/05/new-paper-finds-18-year-pause-of-global.html
Well, not exactly. If you read the paper/abstract posted, all they say is that the error bars are too big to conclude that it is hiding in the deep ocean. It might be. It might not be. But GRACE and ARGO combined cannot resolve it, at least over the reference period they studied, and they tried hard.
Which should surprise no one. But it does continue to leave climate scientists with a bit of a puzzle. Do they continue to believe CERES and other products that claim a sustained TOA energy imbalance? If so, just where is the missing heat? That’s a serious problem for everything but hiding in the deep ocean, because the other “solutions” to the hiatus “problem” tend to assert that there isn’t really an imbalance, but things like aerosols are preventing the TOA imbalance and hence the warming.
This is yet again a problem of resolution. Can we trust CERES to 0.5 W/m^2? Is it plausible that we can measure TOA imbalance globally from satellites at this resolution? There are multiple inconsistent claims for error out there in climate science and everybody seems inclined to (IMO) overestimate the precision of their own pet result, and as a consequence climate science in general claims lots of very precise but inconsistent things (or just leaves a discussion of error out of any sort of public debate where it would weaken “the cause”).
I’m cynical about all of the data. Too many people, too much vested interest, too many completely implausible assertions of certainty, too little careful statistical analysis, almost no validation at all.
rgb
10+
they use everything to peddle up the warming.
in GISStemp they use “missing data” to create warming bias.
yesterday i took a look at the raw data at gisstemp for Uccle belgium and De bilt, netherlands and to my biggest amazement i found there 2 months with “data missing”. one for december 2014 in belgium and one for april 2012 in the netherlands.
2014 was a record warm year in belgium, mostly due to a persistent positive NAO pattern during the whole winter (one of the three longest persistent positive NAO stretches ever recorded), while the eastern USA was freezing cold with the great lakes having their record longest ice cover. however december 2014 did push the record 0.2°C lower then the GISS value. the funniest thing is: go to the official site of the belgian RMI (in dutch or French) and you find:
– the full 12 months of data with complete reports
– the mean of the year 2014 at 0.2°C lower then the GISS value (yet still a record year)
– the missing data for december 2014
in the netherlands for De bilt april 2012 is missing. De bilt records that month as one of the coldest in 100 years. again that missing april month makes a difference of almost 0.4°C with GISS making 2012 at De bilt 0.4°C warmer then it truely was. again in the KNMI site (dutch) you find
– the full 12 months of data with complete reports
– the mean of 2012 which is 0.4°C lower then the GISS value
– the missing data for april 2012
it should be interesting to compare these values of GISStemp with the original ones from the stations around the world. i bet there’s also a lot of warming bias due to “missing data” that is available on the official sites of the station in question.
it would be nice to see the real values with the missing points added. Maybe i should post something about this find but i’m not an HTML head. i even have no idea how to put links or embed images.
so even the unadjusted data has a bias and is tampered with it looks like….