Guest Post by Bob Tisdale
First: Congratulations to the teeny-tiny 2014/15 El Niño. It’s now official. NOAA included it as an “official warm event” on their Oceanic NINO Index this week.
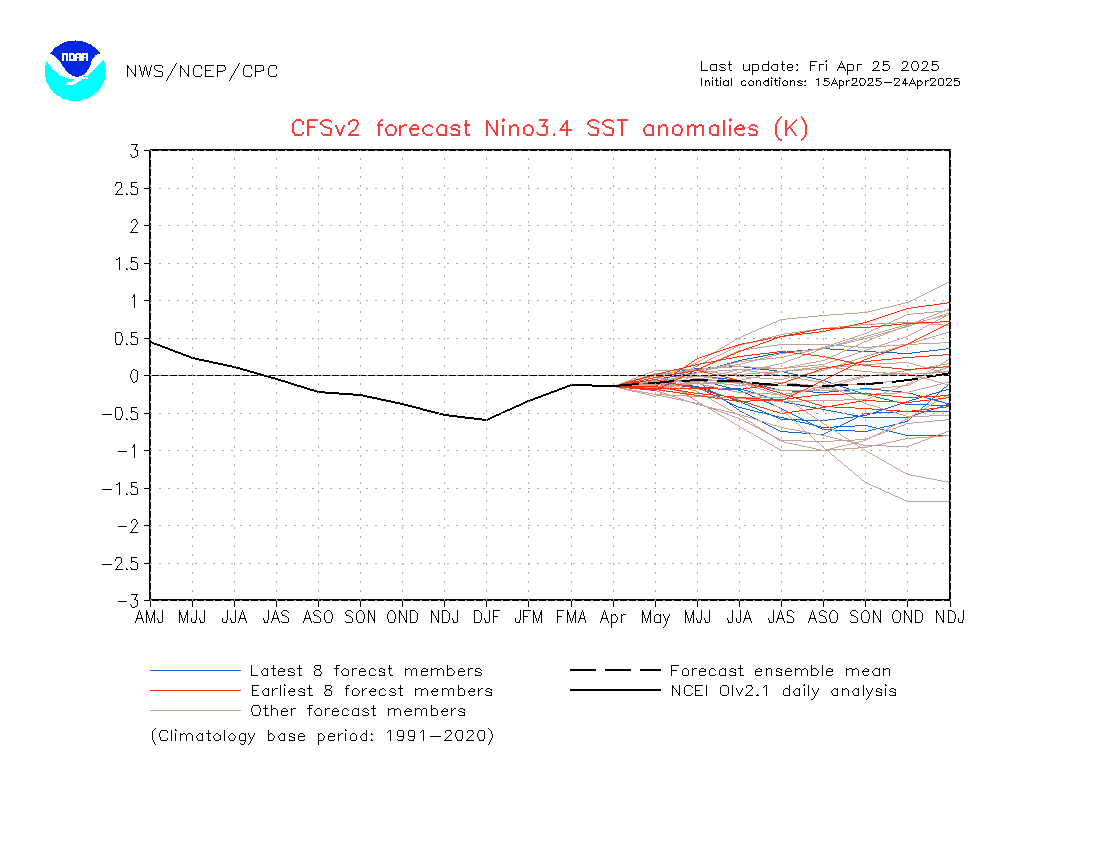
NOAA’s CFS.v2 model (dated April 9, 2015, source here) is now forecasting a strong El Niño for this upcoming ENSO season, or as blogger Alec, aka Daffy Duck called it, “a supercalifragilistic el nino” when he brought the forecast to my attention here. See Figure 1. That forecast is noticeably higher than the one that shows up on page 25 of the NOAA weekly ENSO update, which was dated April 4th.

Figure 1
If you live in California and are hoping for drought relief, I wouldn’t get my hopes up just yet. It’s still (boreal) springtime, and ENSO forecasts have a hurdle called the “spring prediction barrier”. Basically, El Nino forecasts have a bad history during and before boreal spring. [See of Torrence and Webster (1997) The annual cycle of persistence in the El Niño/Southern Oscillation for more info on the spring prediction barrier.] The spring prediction barrier is especially true for El Niño development predictions…not so much for El Niño decay or La Niña development and decay. [See Duan and Wei (2013) The ‘spring predictability barrier’ for ENSO predictions and its possible mechanism: results from a fully coupled model.]
There are a number of aspects that may help in the development of a stronger El Niño this year than last. (1) This year’s downwelling Kelvin wave is a little later in the year, so it will be impacting equatorial sea surface temperatures later in the normal ENSO development “season”. Keep in mind that El Niño events are normally tied to the seasonal cycle. [See the post Why Do El Niño and La Niña Events Peak in Boreal Winter?] (2) The eastern tropical and equatorial Pacific (surface and subsurface) are warmer this year than last. [See the March 2015 ENSO Update – Will the 2014/15 El Niño Become the 2014/15/16 El Niño?] (3) The downwelling Kelvin wave making its way across the equatorial Pacific is a little weaker than the one last year, but it’s still a reasonably strong downwelling Kelvin wave.
But as we saw last year, the development of an El Niño can be suppressed by a lack of westerly wind bursts over the course of the year. Strong westerly wind bursts early in the year only initiate the process. They are needed throughout the rest of the year to strengthen the El Niño. Also, the upwelling (cool) Kelvin wave that should come next can offset the strength and impacts of the existing downwelling (warm) Kelvin wave. So part of the development will depend on the strength and timing of that upwelling (cool) Kelvin wave, too.
A COUPLE OF NOTES ABOUT BACK-TO-BACK AND MULTIYEAR EL NIÑOS
For this discussion, we’ll refer to NOAA’s Oceanic NINO Index again. Of the 20 El Niño events since 1950 that are shown on the ONI index (in red), there are 2 pairs of back-to-back El Niños (the 1957/58 & 1958/59 El Niños, and the 1976/77 & 1977/78 El Niños) and two multiyear El Niños (the 1968/68/69 El Niño, and the 1986/87/88 El Niño). El Niño events normally evolve in one year and decay in the next, so I’m defining multiyear El Niños as those that developed in year one, extended through the second year, and decayed in the third. Bottom line: multiyear and back-to-back El Niños can and do happen. In other words, just in case some alarmists decide to get goofier than normal and try to make a fuss about a multiyear El Niño or back-to-back El Niños, there would be nothing unusual about either type coming to pass this year.
And for those wondering, there is no set rule about the strengths of the first and second years of multiyear and back-to-back El Niños. See Figures 2 and 3. For the multiyear events, the second season of the 1968/68/69 El Niño was slightly weaker than the first year, but during the 1986/87/88 El Niño, the second season was definitely stronger than the first. Looking at the back-to-back El Niños, the 1976/77 & 1977/78 El Niños were comparable in strength, while the 1957/58 El Niño was stronger than the 1958/59 El Niño. In fact, the 1958/59 El Niño was so weak it doesn’t appear on the Old Oceanic NINO Index, which uses a fixed set of base years for the climatology. [See the post Comments on NOAA’s Recent Changes to the Oceanic NINO Index (ONI).]

Figure 2
# # # #

Figure 3
As I noted a number of times last year, we’ll just have to watch and see what Mother Nature has in store for us.
[Thanks to blogger Alec, aka Daffy Duck for the heads-up.]
If one looks at the monthly data back to the 1950′,you can see El Ninos can turn in the space of 3 months to La Nina conditions.
Thanks, Bob. Very good analysis.
“There is an approximately 70% chance that El Niño will continue through Northern Hemisphere summer 2015, and a greater than 60% chance it will last through autumn.”
“At this time, there is also considerable uncertainty as to how strong this event may become. In summary, there is an approximately 70% chance that El Niño will continue through the Northern Hemisphere summer 2015, and a greater than 60% chance that it will last through autumn.”
From http://www.cpc.ncep.noaa.gov/products/analysis_monitoring/enso_disc_apr2015/ensodisc.html
“It appears quite likely that an El Niño of at least moderate strength will develop this summer and fall. The tropical and subtropical Atlantic are also quite cool at present. We anticipate a below-average probability for major hurricanes making landfall along the United States coastline and in the Caribbean.”
From Extended Range Forecast of Atlantic Seasonal Hurricane Activity and U.S. Landfall Strike Probability for 2015 (.pdf, 9 April 2015), at http://hurricane.atmos.colostate.edu/Forecasts/2015/apr2015/apr2015.pdf
Bob, you tend not to make predictions in your posts, but it would help us who have less knowledge than you (which is most of us, IMHO) if you would prognosticate, guesstimate the odds of this or that (“I would suggest that there is a 35% chance of a back-to-back-to-back El Nino”), or weigh the alternatives (“There is a better chance I believe that there will not be a a back-to-back-to-back El Nino than the chance that there will”).
Any help would be appreciated
Sorry, Madman2001, I don’t make predictions.
yeah, i can understand why that is 🙂
we could always offer you lots of money
Madman2001, Daniel, and Glenn999: See Joe Bastardi’s April 10, 2015 at 12:04 pm comment below. He makes predictions.
Atta boy, Bob.
One of your strengths is educating the rest of us on some pretty arcane, but usually meaningful, stuff.
It’s just good clean fun to use your analyses in reasonably calm lunch discussions with equivacating-warmest friends…for example, your comments in this post about multi-year ENSO not being unusual or there being “no rules” about the relative strengths of the multiyear event peaks.
Week in, week out, you demonstrate chunks of this climate stuff yields to good ‘ole analysis of actual data (as opposed to model tea-leaf reading). Please keep up the good work…and stay reasonably far away from “forecasting”.
Stick with your observations, Bob. You’re very good at it. We need to know what happens before we can start thinking about how it happens, and we need to know how it happens before predicting. (Some people who make predictions base it on a single observation, if that.)
The warmer folks will be re-identifying weak La Ninas as El Ninos as we ‘progress’.
I’m referring to the WUWT article “Warm Blob in Pacific Ocean”. Could a large blob of warm water be taking energy away from the energy needed to form an El Nino?
My thoughts were along the same lines.
Could it be blocking the winds that build up an El Nino?
Ralph Kramden, the warm water for an El Nino comes from the western tropical Pacific. See the post “An Illustrated Introduction to the Basic Processes that Drive El Niño and La Niña Events”:
https://bobtisdale.wordpress.com/2014/01/10/an-illustrated-introduction-to-the-basic-processes-that-drive-el-nino-and-la-nina-events/
The California Current should be carrying the warmer-than-normal water from that blob southward. That would tend to enhance the El Nino.
M Courtney, I don’t recall seeing any suggestions that the high pressure in the Northeast Pacific is impacting the trade winds or the westerly wind bursts.
Thanks for the response.
It just made sense to me that a large blocking high somewhere in the Pacific could disrupt the winds all round.
But if you know of no evidence then I doubt there is any or will be any.
Forecast shows the cooling south-eastern Pacific. It will be interesting.
http://www.cpc.ncep.noaa.gov/products/stratosphere/strat_a_f/gif_files/gfs_z100_sh_f120.gif
They’re bound to make a correct prediction one day, and what’s the point of predicting similar or lower temperatures if it won’t get you any media attention?
Just how many times, and for how many years, have the NOAA forecasters of doom been wrong about El Nino? It’s gonna get hot, new records, oceans boiling, send money, yada, yada, yada.
It seems that they have been prediction “the big one” for at least 4 years now.
Like a stopped watch, eventually they will be correct. (roll-eyes emoticon)
Please Bob, call it an Autumn or Fall prediction barrier, because that is what it is.
Harry, please clarify.
The EN develops on the SOHEM and is thus basically a SOHEM phenomenon till it spreads, The months of FMA The so-called spring barrier months are the southern autumn.
Maybe best to just use the month names. That would eliminate any perceived hemispheric-centrism.
Duster, I will agree. In the future, I’ll call it the April-May-June prediction barrier.
Harry, I’m curious as to why you’re saying that the EL Nino develops on the Southern Hemisphere. Please understand that I’m not arguing; I’m asking. Is it the Southern Oscillation Index? One can create an index from the sea level pressures in Hawaii and NW tropical Pacific that has a frequency and magnitude that’s very similar to the SOI. And NOAA created their equatorial SOI. Or is this a reference to the seasonal cycle in the sea surface temperatures of the tropical Pacific?
http://www.esrl.noaa.gov/psd/map/clim/aam.rean.shtml
These graphs help determine the environment from an atmospheric angular momentum perspective the probability of El Nino versus La Nina.
Negative or tendency toward negative AM (ANGULAR MOMENTUM) favoring La Nina conditions while positive AM or tendency in that direction favoring El Nino conditions.
Right now AM is in La Nina territory.
This info. below being combined with the graphs from the link I sent above to get more data on Angular Momentum versus ENSO.
The graphic above shows the tendency anomalies of the atmospheric angular momentum on the top panel, with the net tendency on the bottom panel. Notice how we’re currently recovering from a massive +AAM tendency spike, and are now in a net negative AAM tendency. The cause of this tendency is not the thing we will analyze; right now, we are noting that we’re in a +AAM state with -AAM tendencies.
This fits well into the four stage descriptions of the Global Wind Oscillation (GWO), which takes those above graphics and makes them into useful data. Here’s the descriptions of all four stages of the GWO; pay careful attention to the first and last sentences of each stage.
The four primary phases of the GWO are described below, along with generally cold season (November-March) probable weather impacts for the USA. The GWO recurrence interval, or “time it takes to make a circuit”, ranges from a broad 15-80 days. Two of the stages project strongly on El Nino and La Nina circulation states, which are also characterized by positive (Stage 3) and negative (Stage 1) global AAM anomalies, respectively. Stages 2 and 4 are transitional.
Stage 1 (La-Nina like) – the global relative AAM anomaly is negative. The negative anomaly is primarily due to easterly upper level wind anomalies that extend from the Eastern Hemisphere tropics to the Western Hemisphere mid-latitudes. A retracted Pacific Ocean jet stream is a key feature in the total field. Troughs are probable across the western USA with a ridge over the southeast. High impact weather is favored across the Plains.
Stage 2 – the global relative AAM tendency is positive. This means that negative AAM is being removed from the atmosphere by surface friction and mountains. At the same time, westerly wind anomalies are intensifying in equatorial regions of the Western Hemisphere. Fast Rossby wave dispersion events in both hemispheres are a coherent feature of this stage and Stage 4. A cold regime is probable across the central USA.
Stage 3 (El-Nino like) – the global relative AAM anomaly is positive. Westerly wind anomalies move into the Eastern Hemisphere, broaden in latitudinal extent and link up with deep westerly flow anomalies over the mid-latitude Western Hemisphere. An extended Pacific Ocean jet stream and southward shifted storm track is observed favoring high impact weather events along the USA west coast.
Stage 4 – the global relative AAM tendency is negative. Positive (westerly) AAM anomalies are being removed by surface friction in the Western Hemisphere mid-latitudes and through mountain torques across the Northern Hemisphere topography. The next phase of the oscillation (if there is one) is represented by easterly wind anomalies intensifying over equatorial regions of the Western Hemisphere. This stage has enhanced subtropical jets and closed lows in the subtropics favoring rainfall events over the southwestern USA.
What did you notice in each stage description? Did you notice how each description began with details on how the net (global relative) AAM or AAM tendency was positive or negative? Let’s apply that here.
We saw earlier how we are in a +AAM / -AAM tendency phase right now. Using those particular sentences in each description, it appears we’re in Stage 3 or Stage 4 of the Global Wind Oscillation. Let’s investigate each description closer. In Stage 3, among other details, the Pacific jet stream is extended (can stretch across the Pacific), and active weather impacts the West US. In Stage 4, the subtropical jet stream is strengthened, and closed lows in the subtropics can permit heavy rainfall over the Southwest.
What’s AAM? It can’t be anomalous angular momentum since you refer to “AAM anomaly” twice.
I agree Rick, not everyone knows all the acronyms so the terms with the acronym in parentheses is often a big help and makes the article or comment more valuable to many.
Solar EUV is approaching a minimum. Strong Solar EUV , via Walker Cells, drives westerly winds. There will be very weak Solar EUV.
No predictions, form your own opinion.
no and it’s not going to happen … .. 4 more yrs to wait .. a la nina
My post at 8:00am was from the web-site the Weather Centre. They use AM as a forecasting tool.
One has to be predicting an El Nino to develop based on the equatorial temperatures in the 100 metre deep Pacific Equatorial Under-current. The +4.0C and +5.0C above-normal water will start surfacing in the next few weeks and then one can see if the atmosphere partners in the ENSO either enhance it further or dampen it.
Equatorial Cross-section.
http://www.cpc.ncep.noaa.gov/products/GODAS/pent_gif/xz/movie.temp.0n.gif
Average temp anomaly in the top 300 metres.
http://www.cpc.ncep.noaa.gov/products/GODAS/pent_gif/xy/movie.h300.gif
Basically agree, but this warm water is forming the wrong place. It is supposed to be further west in the “warm pool” which is currently anomalously cold, ready to reflect back with the next reaction wave. This may be something akin to the “Chen and Tung” effect where super saline solar warmed and evaporated water just sinks a bit from haline density.
While anomaly makes some sense in the atmosphere by dampening diurnal and seasonal variation to something manageable, to my mind more is lost than gained using anomaly in the ocean. What will explain ocean density and vertical movement is absolute temperature and salinity, not anomaly.
To my eye the NH trades currently hark from some zonal energy that does not involve shear along the coast of North America but shear along the equator, while the source of the energy for the SH trades is strikingly meridional with lots of shear along the coast of South America and little along the equator.
How this plays to the fate of your central Pacific warm pool will be very interesting.
How can we believe that NOAA can make
any accurate prediction like the one shown
When their own predictions for the next year issued just 3 days later
shows NINO 3.4 over the coming year and next year as well. Varying
in the opposite direction to the predicted ocean temperatures.
That’s right NOAA show NINO 3/4 rising as sea temperatures are falling.
http://www.cpc.ncep.noaa.gov/products/predictions/90day/tools/briefing/unger.pri.php
Shome Mishtake Surely ?
Wun Hung Lo, no mistake. The NOAA CFS v2 model shows up as the purple curve on the first graph you linked:
http://www.cpc.ncep.noaa.gov/products/predictions/90day/tools/briefing/sstaa.gif
Cheers
So there will be reports of 2C global temperature anomaly as delegates arrive in Paris for ” the big one ” , the ultimate game- changing , economy- destroying , Gore- enriching climate change summit. Oh dear, bit of a nuisance that.
Gore-enrichiching? Well, since Gore made the vast majority of his money off of Apple stock and the sale of Current TV, what specific investments are you referring to?
re “Gore-enriching”:
http://www.fastcompany.com/60067/al-gores-100-million-makeover
“[..] $175,000 speaking fee [..] In addition to the steady flow of six-figure speaking gigs, he has become an insider at two of the hottest companies on the planet: at Google, where he signed on as an adviser in 2001, pre-IPO (and received stock options now reportedly worth north of $30 million), and at Apple, where he joined the board in 2003 (and got stock options now valued at about $6 million). [..] While Gore was struggling to launch his cable network in late 2003, he was also moving on another front: starting an investment firm [Generation Investment Management] based on a new definition of sustainability. Metropolitan West Financial, an L.A.-based asset-management outfit where he’d been vice chairman for two years, had just been sold [..] Gore had his hefty payout from the deal [..] The firm [Generation Investment Management] now has nearly $1 billion under management, from 15 institutions, plus a few individuals. [..]”
Watch and see what Mother Nature has in store for us! Are you insane? 97% of all scientists know that reality doesn’t matter, if it’s not a computer model it doesn’t count. Models uber alles!
When did the alarmists start to get interested in El Ninos? I thought their whole schtick was that CO2 drove climate conditions. The next thing you know they’ll start to look at solar variability, cosmic rays, clouds and all sorts of other variables that affect climate. Finally, they’ll have to admit that CO2 wasn’t that important after all. Welcome to the real world (sarc).
Their dilemma is that whatever they dictate causes climate to change, it has to be anthropological in nature and support the current swing toward world governance of energy resources. It may take some time to adjust the paradigm to include the facts and still retain the illusion of humanity’s guilt.
Yes they point to the Mauna Loa CO2 graph, the they point to an unfortunate April tornado tragedy in Illinois… then they say, “See!!! Told ya’ so.”
jbird,
Two meteorologists get credit: https://ams.confex.com/ams/annual2003/techprogram/paper_58909.htm
Two giants of 20th-century meteorology, Gilbert Walker and Jacob Bjerknes, are usually given credit for discovering the El Niño-Southern Oscillation phenomenon. During the early 1920s, Walker empirically identified a periodic variation in atmospheric pressure over the Indo-Pacific which he christened the “Southern Oscillation.” During the 1960s, Bjerknes posited a physical mechanism to explain the atmospheric features of this phenomenon over the equatorial Pacific which he christened the “Walker Circulation.” Both men deserve recognition since they opened the way for our present understanding of the global climate system.
Perhaps your thinking is incorrect: http://academic.evergreen.edu/z/zita/articles/climate/ModernGCC03KarlTrenberth.pdf
Modern climate change is dominated by human influences, which are now large enough to exceed the bounds of natural variability. The main source of global climate change is human-induced changes in atmospheric composition. These perturbations primarily result from emissions associated with energy use, but on local and regional scales, urbanization and land use changes are also important. Although there has been progress in monitoring and understanding climate change, there remain many scientific, technical, and institutional impediments to precisely planning for, adapting to, and mitigating the effects of climate change. There is still considerable uncertainty about the rates of change that can be expected, but it is clear that these changes will be increasingly manifested in important and tangible ways, such as changes in extremes of temperature and precipitation, decreases in seasonal and perennial snow and ice extent, and sea level rise. Anthropogenic climate change is now likely to continue for many centuries. We are venturing into the unknown with climate, and its associated impacts could be quite disruptive.
That’s not an atypical abstract.
https://www.ipcc.ch/publications_and_data/ar4/wg1/en/ch8s8-6-3-2.html
8.6.3.2 Clouds
By reflecting solar radiation back to space (the albedo effect of clouds) and by trapping infrared radiation emitted by the surface and the lower troposphere (the greenhouse effect of clouds), clouds exert two competing effects on the Earth’s radiation budget. These two effects are usually referred to as the SW and LW components of the cloud radiative forcing (CRF). The balance between these two components depends on many factors, including macrophysical and microphysical cloud properties. In the current climate, clouds exert a cooling effect on climate (the global mean CRF is negative). In response to global warming, the cooling effect of clouds on climate might be enhanced or weakened, thereby producing a radiative feedback to climate warming (Randall et al., 2006; NRC, 2003; Zhang, 2004; Stephens, 2005; Bony et al., 2006).
http://data.giss.nasa.gov/modelforce/RadF.gif
Yes, the Sun. As well, many other factors far more obvious than cosmic rays. It’s almost as if you’re not the only person thinking about this stuff.
Odd conclusion considering that these so-called “alarmists” are the ones mainly responsible for what little you apparently know of them or their research.
“Modern climate change is dominated by human influences, which are now large enough to exceed the bounds of natural variability. The main source of global climate change is human-induced changes in atmospheric composition. These perturbations primarily result from emissions associated with energy”
You forgot human induced post climate change?
Santa,
That’s quite an amazing assertion, isn’t it?
Modern climate change is dominated by human influences, which are now large enough to exceed the bounds of natural variability.
But that’s all it is: an assertion. It’s pretty much a baseless asserrtion, since the climate Null Hypothesis has never been falsified: nothing we observe now is either unusual, or unprecedented. All current climate parameters have been exceeded in the past, before human CO2 was a factor.
The truth is that we have been blessed with a real ‘Goldilocks’ climate for the past century. There is no credible evidence that human CO2 emissions have had any negative effect at all. The only real evidence we have shows that the rise in CO2 has been an unmitigated benefit to the biosphere. All the scare talk about runaway global warming has been debunked by Planet Earth herself.
The authors completely disregard reality. They disregard all contrary facts and evidence. Because if they told the truth – that nothing abnormal is occurring – they probably would not be able to parlay their paper into grant loot.
Government grant money has thoroughly corrupted science: Scientists have been trained with grant money like Pavlov’s dogs were trained with dog biscuits.
Santa Baby,
First things first.
dbstealey,
You’re killin’ me here, son.
Most “greenhouse gases” in the atmosphere (especially CO2) are NOT “well-mixed”, so even if the above curve showing the influence of “well-mixed” greenhouse gases were even remotely correct (which it is not), it wouldn’t be relevant anyway. Even H2O, the most abundant and most important “greenhouse gas” in the atmosphere is far from “well-mixed”.
So basically, there are 2 MAJOR flaws with the whole AGW theory. Flaw #1, CO2 is more important than H2O (no) and Flaw #2, greenhouse gases are well-mixed in the atmosphere (no).
Unless of course they start propagandising about a made-up (read: fantasist) link between CO2 emissions and El Nino behaviour…???? You know the cultists are capable of saying anything.
Andrew Richards,
A CO2 —> El Nino link is non-obvious to me, but then so are the workings of any ocean/atmospheric coupling. It’s a fiendishly complex system and I would not presume to know fantasy from fact by my own lay reasoning about it. For that I must turn to experts with specific training to the problem domain in question, and where I prefer to go first for that is to peer-reviewed primary literature. Speculating that prestige for-profit journals are part of some cult is the thing which smacks of propaganda to my eyes. YMMV.
Internal variability, of which El Nino is part, has been topical recently. One story generating some buzz is a comment from Andy Lacis of NASA GISS in response to an article by Steve Koonin over at Judith Curry’s: http://judithcurry.com/2015/04/08/are-human-influences-on-the-climate-really-small/#comment-691948
How can a physicist not comprehend that it is atmospheric CO2 that is the principal radiative forcing agent for the ongoing global warming? . . . and not be concerned that water vapor, as the climate system’s principal feedback agent, has an exponential dependence on temperature?
To be sure, there are other factors that contribute to climate change. But decades of measurements and analysis have shown that variations in solar irradiance, land use, aerosols, ozone, and other minor greenhouse gases, while making a contribution, are small by comparison to CO2.
Of greater interest is the “unforced” variability of the climate system on decadal time scales that arises from changes in ocean circulation patterns that are effectively un-influenced by changes in atmospheric radiative forcing. The deep ocean is a very large cold storage reservoir. An upwelling blob of cold ocean water can put a “pause” in the ongoing global warming, temporarily diverting the greenhouse “heat” to warming the ocean. But once that cold blob of ocean water has been warmed up to its equilibrium temperature, it is back to the business of continued global warming. And also note that the ocean cannot cause a decadal warming spurt – the deep ocean is colder than the surface biosphere, so it cannot be a source of heat.
Significantly, the key climate system components (water vapor, clouds, ocean) are not configured to respond to radiative and/or temperature perturbations on a sufficiently small enough incremental scale that would permit a monotonic approach to global energy balance equilibrium. Instead, there is always over-reaction such as when water vapor condenses en mass to produce storms, coupled with the similarly over-reactive responses by atmospheric and ocean dynamics to pressure-temperature and salinity differences, to produce the quasi-chaotic weather and the longer-term climate noise that characterizes the climate system.
Physicists should not be confused by these random-looking quasi-chaotic fluctuations about the local climate equilibrium point, and should instead focus more on the changing energy balance equilibrium point of the climate system. They should also pay attention to the geological record that points to an atmospheric CO2 level of 450 ppm as being incompatible with polar ice caps, a level that is expected to be reached by the end of this century. While it may take a thousand years for the polar ice to melt, the future course is being prepared for a 70 meter rise in sea level.
That is only part of his comment. It is one of the more succinct yet comprehensive summaries of the “problem” of internal variability I have ever read.
“They should also pay attention to the geological record that points to an atmospheric CO2 level of 450 ppm as being incompatible with polar ice caps”
They should pay more attention to the geographical record that points to a detached Antarctica, a northerly Greenland and an open Isthmus of Panama as being incompatible with ice-free poles. Cart before the horse.
Let’s try this the easy way: the reason you know about those things is because nobody paid attention to them.
Interesting graphs. Don’t forget this is not actual heat energy it is an “anomaly” from a four dimensional average condition. ( long,lat, depth,time).
The vertical cross-section is misleading because it does not show one of those dimensions. It does not account for N/S movement of water.
That is where the real heat anomalies come from. The equatorial anomalies come from a depression of the thermocline. The warmer surface water is lowered and appears as a warm anomaly. Much of what this plot shows is vertical displacement anomaly not an increase of heat energy.
Looking at the second graph, we see two bands at 40N and 40S and a third around the equator. I think much of this pattern is long term tidal effects.
I think it is Clarke that did a paper on thermocline movement but he did not make the tidal link.
On that cross section, how can so much temperature rise happen in just a few days, given that it is shown to be at depth and not particularly connected to the sunlit surface?
I was hoping, Mike, that you provided a reasonable answer, but then Bill Illis disagreed.
So, where is the energy coming from?
A giant lava lamp.
oops, that was supposed to reply to Bill Illis above
There is no North-South movement at the equator – until the water flow runs up against a continental shelf.
One should think of this cross-section as showing water at the surface moving east to west as it dragged along by the east-to-west trade winds.
The water travels to the west at the surface from the Galapagos Islands all the way across the Pacific until it runs into the continental shelf at Indonesia. The majority of this water is then actually pushed down from the momentum of all that water moving west behind it. (some gets pushed through the Indonesian Flow-through and some gets pushed north to become the Kurishio current but the majority of the water just gets pushed down.)
It then travels in the equatorial under-current (the Cromwell Current) at 100-150 metres depth back across the Pacific to the east. It then surfaces at Galapagos Island and the loop is complete.
The majority of the water in the equatorial Pacific is just recirculating in one long continuous loop.
Some of course is exiting the system through the Indonesian Flow-through and some is going into the North Pacific Gyre in the Kuroshio current. And then some is entering the loop pattern from the Humbolt current along the South American coast, and some is entering from the Tehuantepec upwells next to central America (but noone is really certain how this works here).
The whole ocean is full of these types of surface currents and under-water counter-currents going in the opposite directions and then just 8 degrees away latitude, all the currents now flow the same way but in the opposite directions again.
If the ocean water is moving, wherever it is going, some other water has to be moving away to make way for it. And wherever the water is coming from, some other water is moving in to take its place. Its all just circulating in short-term continuous loops and/or long-term continuous loops taking years or decades or centuries. The equatorial Pacific is actually the easiest place on the planet to understand as it a short-term one and not that complicated and it has great monitoring systems.
coming soon on PPV!
The Eastern Pacific Blob vs. El Nino in the meteorological grudge match of the year!
until then, would someone wake me up when a real El Nino gets here? i’d hate to drown in my sleep.
oops, that was supposed to reply to Bill Illis above
The thing is that water is drawn to the equator and thus depresses the thermocline. This shows as a warm “anomaly” in the vertical section.
Frankly, this el niño is not only supercalifragilistic, it’s supercalifragilisticexpialidocious.
(the Roman Empire only entered the abyss, because those Latin scholars never had a word like this)
kowabunga
There goes my coffee.
Thanks Bob. I notice a “cold” spot west of the Kelvin wave. Isn’t this supposed to be the source region for future warm water that would move eastward with westerly bursts?
R2Dtoo, yes, there are below-normal subsurface temperature anomalies in the western tropical Pacific. Phrased differently, yes, they’re showing that there is presently less warm water than normal to supply El NIno development. Two things to keep in mind. (1) Sea surface temperature anomalies in the eastern tropical Pacific are already elevated. And (2) El Nino events rely on the temperature difference (absolute) between the western tropical Pacific (warmer) and the eastern tropical Pacific (cooler). The below-normal subsurface temperatures in the western tropical Pacific we’re seeing now wouldn’t prevent an El Nino. It just has less fuel for development.