It's official: no global warming for 18 years 1 month

Global Temperature Update By Christopher Monckton of Brenchley

The RSS monthly satellite global temperature anomaly for September 2014 is in, and the Great Pause is now two months longer than it was last month. Would this year’s el Niño bite soon enough to stop the psychologically-significant 18-year threshold from being crossed? The official answer is No.

Globally, September was scarcely warmer than August, which was itself some distance below the 18-year trend-line. Therefore, taking the least-squares linear-regression trend on the RSS satellite monthly global mean surface temperature anomalies, there has now been no global warming for 18 years 1 month.

Dr Benny Peiser, our good friend at the Global Warming Policy Foundation in the UK, had anticipated the official crossing of the 18-year threshold by a day or two with an interesting note circulated to supporters on the ever-lengthening period without any global warming, and featuring our 17-years-11-months graph from last month.

The Great Pause is the longest continuous period without any warming in the global instrumental temperature record since the satellites first watched in 1979. It has endured for a little over half the satellite temperature record. Yet the Pause coincides with a continuing, rapid increase in atmospheric CO2 concentration.

clip_image002

Figure 1. RSS monthly global mean lower-troposphere temperature anomalies (dark blue) and trend (thick bright blue line), September 1996 to September 2014, showing no trend for 18 years 1 month.

The hiatus period of 18 years 1 month, or 217 months, is the farthest back one can go in the RSS satellite temperature record and still show a sub-zero trend.

RSS itself is now taking a serious interest in the length of the Great Pause. Dr Carl Mears, the senior research scientist at RSS, has a long and intriguing discussion of the Pause, and of the widening divergence between the models’ excitable predictions and the mundane reality in the RSS blog, at remss.com/blog/recent-slowing-rise-global-temperatures.

Dr Mears’ results are summarized in Fig. 2:

clip_image004

Figure 2. Output of 33 IPCC models (turquoise) compared with measured RSS global temperature change (black), 1979-2014. The transient coolings caused by the volcanic eruptions of Chichón (1983) and Pinatubo (1991) are shown, as is the spike in warming caused by the great el Niño of 1998.

Dr Mears writes:

“The denialists like to assume that the cause for the model/observation discrepancy is some kind of problem with the fundamental model physics, and they pooh-pooh any other sort of explanation.  This leads them to conclude, very likely erroneously, that the long-term sensitivity of the climate is much less than is currently thought.”

Dr Mears’ regrettable use of the word “denialists”, with its deliberate overtones of comparison with Holocaust deniers, reveals Dr Mears as what we may call a “liarist” – one who is prone to push the evidence in the profitable direction of greater alarm than is scientifically justified.

Interestingly, therefore, the RSS data, which show less recent warming than all other datasets, are under the management of a liarist, while the UAH data, which (until v. 6 becomes available at any rate) continue to show more warming than the others, are managed by sceptics.

Dr Mears admits the discrepancy between the RSS data and the models’ exaggerations, but he echoes various trolls here in alleging the supposed “cherry-picking” of the start-date for the global-temperature graph:

“Recently, a number of articles in the mainstream press have pointed out that there appears to have been little or no change in globally averaged temperature over the last two decades.  Because of this, we are getting a lot of questions along the lines of ‘I saw this plot on a denialist web site.  Is this really your data?’  While some of these reports have ‘cherry-picked’ their end points to make their evidence seem even stronger, there is not much doubt that the rate of warming since the late 1990s is less than that predicted by most of the IPCC AR5 simulations of historical climate.  … The denialists really like to fit trends starting in 1997, so that the huge 1997-98 ENSO event is at the start of their time series, resulting in a linear fit with the smallest possible slope.”

It is time to deal with this nonsense about start-dates very firmly. The spike in temperatures caused by the Great el Niño of 1998 is largely offset in the linear-trend calculation by two factors: the spike of the 2010 el Niño, and the sheer length of the Great Pause itself.

To demonstrate this, I replaced all the monthly RSS anomalies for 1998 with the mean anomaly value of 0.55 K that obtained during the 2010 el Niño. Then I recalculated the trend from September 1996 [not Dr Mears’ “1997”] to September 2014. All that happened is that the trend values “–0.00 C° (–0.00 C°/century)” shown in the unaltered data (Fig. 1) became “+0.00 C° (+0.00 C°/century)” in the recalculated graph. Not exactly a major difference. That is the end of that climate-liarist canard.

The length of the Great Pause in global warming, significant though it now is, is of less importance than the ever-growing discrepancy between the temperature trends predicted by models and the far less exciting real-world temperature change that has been observed.

IPCC’s First Assessment Report predicted that global temperature would rise by 1.0 [0.7, 1.5] Cº to 2025, equivalent to 2.8 [1.9, 4.2] Cº per century. The executive summary asked, “How much confidence do we have in our predictions?” IPCC pointed out some uncertainties (clouds, oceans, etc.), but concluded:

“Nevertheless, … we have substantial confidence that models can predict at least the broad-scale features of climate change. … There are similarities between results from the coupled models using simple representations of the ocean and those using more sophisticated descriptions, and our understanding of such differences as do occur gives us some confidence in the results.”

That “substantial confidence” was substantial over-confidence. A quarter-century after 1990, the outturn to date – expressed as the least-squares linear-regression trend on the mean of the RSS and UAH monthly global mean surface temperature anomalies – is 0.34 Cº, equivalent to just 1.4 Cº/century, or exactly half of the central estimate in IPCC (1990) and well below even the least estimate (Fig. 3).

clip_image006

Figure 3. Near-term projections of warming at a rate equivalent to 2.8 [1.9, 4.2] K/century , made with “substantial confidence” in IPCC (1990), January 1990 to August 2014 (orange region and red trend line), vs. observed anomalies (dark blue) and trend (bright blue) at less than 1.4 K/century equivalent, taken as the mean of the RSS and UAH satellite monthly mean lower-troposphere temperature anomalies.

The Great Pause is a growing embarrassment to those who had told us with “substantial confidence” that the science was settled and the debate over. Nature had other ideas. Dr Mears, rightly, says the Pause is probably attributable to several factors rather than one. But the one factor he hastily rules out is any major error in the physics of the models.

Though more than 50 more or less implausible excuses for the Pause are appearing in nervous reviewed journals, the possibility that the Pause is occurring because the computer models are simply wrong about the sensitivity of temperature to manmade greenhouse gases can no longer be dismissed.

Remarkably, even the IPCC’s latest and much reduced near-term global-warming projections are also excessive (Fig. 3).

clip_image008

Figure 4. Predicted temperature change, January 2005 to August 2014, at a rate equivalent to 1.7 [1.0, 2.3] Cº/century (orange zone with thick red best-estimate trend line), compared with the observed anomalies (dark blue) and zero real-world trend (bright blue), taken as the average of the RSS and UAH satellite lower-troposphere temperature anomalies.

In 1990, the IPCC’s central estimate of near-term warming was higher by two-thirds than it is today. Then it was 2.8 C/century equivalent. Now it is just 1.7 Cº equivalent – and, as Fig. 4 shows, even that is proving to be a substantial exaggeration.

On the RSS satellite data, there has been no global warming statistically distinguishable from zero for more than 26 years. None of the models predicted that, in effect, there would be no global warming for a quarter of a century.

The Great Pause may well come to an end by this winter. An el Niño event is underway and would normally peak during the northern-hemisphere winter. There is too little information to say how much temporary warming it will cause, though. The temperature spikes of the 1998, 2007, and 2010 el Niños are evident in Figs. 1-4.

El Niños occur about every three or four years, though no one is entirely sure what triggers them. They cause a temporary spike in temperature, often followed by a sharp drop during the la Niña phase, as can be seen in 1999, 2008, and 2011-2012, where there was a “double-dip” la Niña that is one of the excuses for the Pause.

The ratio of el Niños to la Niñas tends to fall during the 30-year negative or cooling phases of the Pacific Decadal Oscillation, the latest of which began in late 2001. So, though the Pause may pause or even shorten for a few months at the turn of the year, it may well resume late in 2015 . Either way, it is ever clearer that global warming has not been happening at anything like the rate predicted by the climate models, and is not at all likely to occur even at the much-reduced rate now predicted. There could be as little as 1 Cº global warming this century, not the 3-4 Cº predicted by the IPCC.

Key facts about global temperature

Ø The RSS satellite dataset shows no global warming at all for 217 months from September 1996 to September 2014. That is more than half the 429-month satellite record.

Ø The global warming trend since 1900 is equivalent to 0.8 Cº per century. This is well within natural variability and may not have much to do with us.

Ø The fastest measured warming trend lasting ten years or more occurred over the 40 years from 1694-1733 in Central England. It was equivalent to 4.3 Cº per century.

Ø Since 1950, when a human influence on global temperature first became theoretically possible, the global warming trend has been equivalent to below 1.2 Cº per century.

Ø The fastest warming rate lasting ten years or more since 1950 occurred over the 33 years from 1974 to 2006. It was equivalent to 2.0 Cº per century.

Ø In 1990, the IPCC’s mid-range prediction of near-term warming was equivalent to 2.8 Cº per century, higher by two-thirds than its current prediction of 1.7 Cº/century.

Ø The global warming trend since 1990, when the IPCC wrote its first report, is equivalent to below 1.4 Cº per century – half of what the IPCC had then predicted.

Ø Though the IPCC has cut its near-term warming prediction, it has not cut its high-end business as usual centennial warming prediction of 4.8 Cº warming to 2100.

Ø The IPCC’s predicted 4.8 Cº warming by 2100 is well over twice the greatest rate of warming lasting more than ten years that has been measured since 1950.

Ø The IPCC’s 4.8 Cº-by-2100 prediction is almost four times the observed real-world warming trend since we might in theory have begun influencing it in 1950.

Ø From August 2001 to August 2014, the warming trend on the mean of the 5 global-temperature datasets is nil. No warming for 13 years 1 month.

Ø Recent extreme weather cannot be blamed on global warming, because there has not been any global warming. It is as simple as that.

Technical note

Our latest topical graph shows the RSS dataset for the 217 months September 1996 to September 2014 – just over half the 429-month satellite record. This is as far back as it is possible to go in the global instrumental record and find a zero trend. The start-date is not “cherry-picked” so as to coincide with the temperature spike caused by the 1998 el Niño: it is calculated so as to find the longest period with a zero trend.

Furthermore, the length of the pause in global warming, combined with the offsetting effect of the 2010 el Niño on the calculation, ensures that the distortion of the trend caused by the proximity of the 1998 el Niño to the 1996 start date for the trend is barely discernible.

Terrestrial temperatures are measured by thermometers. Thermometers correctly sited in rural areas away from manmade heat sources show warming rates appreciably below those that are published. The satellite datasets are based on measurements made by the most accurate thermometers available – platinum resistance thermometers, which not only measure temperature at various altitudes above the Earth’s surface via microwave sounding units but also constantly calibrate themselves by measuring via spaceward mirrors the known temperature of the cosmic background radiation, which is 1% of the freezing point of water, or just 2.73 degrees above absolute zero. It was by measuring minuscule variations in the cosmic background radiation that the NASA anisotropy probe determined the age of the Universe: 13.82 billion years.

The graph is accurate. The data are lifted monthly straight from the RSS website. A computer algorithm reads them down from the text file, takes their mean and plots them automatically using an advanced routine that automatically adjusts the aspect ratio of the data window at both axes so as to show the data at maximum scale, for clarity.

The latest monthly data point is visually inspected to ensure that it has been correctly positioned. The light blue trend line plotted across the dark blue spline-curve that shows the actual data is determined by the method of least-squares linear regression, which calculates the y-intercept and slope of the line via two well-established and functionally identical equations that are compared with one another to ensure no discrepancy between them. The IPCC and most other agencies use linear regression to determine global temperature trends. Professor Phil Jones of the University of East Anglia recommends it in one of the Climategate emails. The method is appropriate because global temperature records exhibit little auto-regression.

Dr Stephen Farish, Professor of Epidemiological Statistics at the University of Melbourne, kindly verified the reliability of the algorithm that determines the trend on the graph and the correlation coefficient, which is very low because, though the data are highly variable, the trend is flat.

5 1 vote
Article Rating
307 Comments
Oldest
Newest Most Voted
Inline Feedbacks
View all comments
angech
October 2, 2014 9:33 pm

“El Niños occur about every three or four years, though no one is entirely sure what triggers them. They cause a temporary spike in temperature,”
El Nino’s do not “cause a temporary spike in temperature”
They are associated with a temporary spike in temperature.
El Nino is itself an observation of a temperature rise.
The cause for the heat is currents and cloud and sun, as always.
Otherwise spot on.

Editor
Reply to  angech
October 3, 2014 1:38 am

angech says: “El Nino is itself an observation of a temperature rise. The cause for the heat is currents and cloud and sun, as always.”
That’s a limited definition. You’re also shifting topics between temperature and heat.
A more complete definition would be, An El Niño is part of coupled ocean-atmosphere processes—involving winds, currents, clouds, sun, etc.—that cause temporary spikes in surface and lower troposphere temperatures. Strong El Niños (not all El Niños) can also cause long-term warming of surface and lower troposphere temperatures in some parts of the globe, a result of residual (leftover) warm waters from those strong El Niños.
More to follow.

Editor
Reply to  Bob Tisdale
October 3, 2014 2:03 am

Angech, and here’s the more that follows
Angech says: “El Nino’s do not ’cause a temporary spike in temperature’ They are associated with a temporary spike in temperature.”
Your statements contradict decades of research by meteorologists and climatologists.
In the real world, El Niño events do cause temporary spikes in the surface temperatures of the East Pacific, as warm waters from below the surface of the West Pacific Warm Pool flood into the eastern tropical Pacific and rise to the surface.comment image
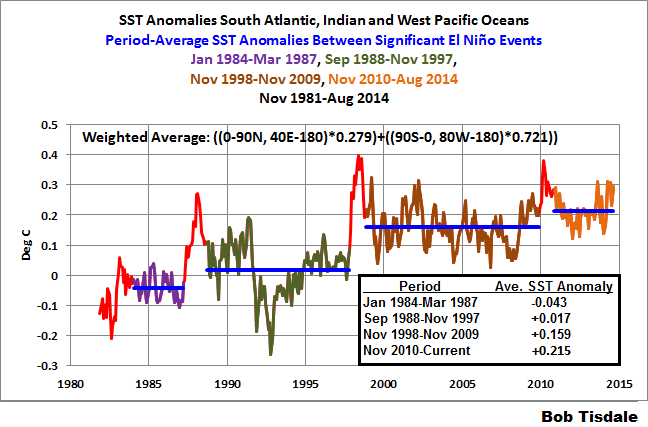
And the instrument temperature records show that the residuals (the leftover warm waters) of strong El Niño events (like those in 1986/87/88 and 1997/98) caused the long-term warming of the sea surfaces of the South Atlantic, Indian and West Pacific Oceans (aka Trenberth “Big Jumps”).comment image
But this post is a discussion of lower troposphere temperatures (TLT). In the tropics, an El Niño causes a temporary spike in TLT. When all of that warm water floods into the eastern tropical Pacific, evaporation and convection cause vast amounts of moisture to rise into the atmosphere. When that moisture condenses, it releases latent heat to the lower troposphere, temporarily raising its temperature. Atmospheric circulation carries that heat poleward, raising the temperatures at higher latitudes.
You can watch the temporary increase in TLT in the tropics in the following animation. The top cell is sea surface temperature. The bottom cell is TLT. The graph to the right is of East Indian-West Pacific SSTa and scaled (0.15) NINO3.4 SSTa. You’ll note that there is a temporary warming of tropical TLT that lags the rise in sea surface temperatures.
http://bobtisdale.files.wordpress.com/2012/02/with-tlt2.gif
Note: To simplify this reply, I’ve overlooked teleconnections.
The graphs are from the August sea surface temperature update:
http://bobtisdale.wordpress.com/2014/09/08/august-2014-sea-surface-temperature-sst-anomaly-update/
And the gif animation is Animation 6.6 from this post:
http://bobtisdale.wordpress.com/2012/09/03/animations-discussed-in-who-turned-on-the-heat/
Cheers. Gotta go upload a post about the California drought for later this morning.

Reply to  Bob Tisdale
October 3, 2014 2:25 pm

Very grateful to Bob Tisdale for his distinguished and profoundly knowledgeable contributions to this thread on the ENSO phenomenon.

Reply to  angech
October 3, 2014 10:17 am

http://www.king5.com/story/tech/science/environment/2014/10/02/arctic-warming-study/16615409/
KING5 news in Seattle did not get the memo: “It’s official: no global warming for 18 years 1 month
SEATTLE – A mission to the Arctic is now underway aboard a sophisticated high tech weather plane to continue study of the melting of ice and the warming of the Arctic Ocean.
The mission aboard a Lockheed P-3 Orion aircraft will be based out of Fairbanks, Alaska, for the next three weeks. On board are some of the nation’s top scientists on climate change.
“There’s a continuous loss of ice,” said Dr. James Overland, a research oceanographer with the Pacific Marine Environmental Laboratory in Seattle. Overland, the P-3 and its crew are with of the National Oceanic and Atmospheric Administration, under the U.S. Department of Commerce.
The problem is a simple one. Ice reflects rays from the sun. Open water absorbs those rays as heat, and Overland says temperatures measured in exposed sections of the Arctic Ocean have increased about nine degrees Fahrenheit. The ice is also becoming thinner.
“We’ve actually lost 60 percent of the total amount of ice that used to be there 15 to 20 years ago,” he said, in large part because what ice there is, is also thinner. And he fears the process of less ice and warming Arctic water is accelerating.
Overland has been at this a long time. He says where he walked on ice floes 20 years ago, there is now open ocean. Not only does the atmosphere transmit that heat as it passes over the warmer or less cold waters of the Arctic Ocean, but he says the warming of the Arctic Ocean also alters ocean currents.
“Unless you take direct measurements, we can’t really evaluate our models and fully understand what’s going on,” said Dr. Nick Bond of the University of Washington and JISAO- the Joint Institute for Study of the Atmosphere and Ocean.
The weather plane known as Kermit is equipped to perform those direct measurements. For much of the year the Tampa, Florida,-based Lockheed P-3 flies as a hurricane hunter using those instruments to gather data as it flies through the big storms.
Far from the hurricane belt, the plane will drop special buoys into the ocean that will measure temperature and salt content. Disposable tubes called drop sonds will be ejected from the bottom of the plane at altitude, and report back air temperatures, direction and other weather data as they float by parachute down to the ocean surface.
Other instruments can measure and photograph snow and ice crystals; a large radar in a dome below the plane can see out 250 miles in all directions. And there is a lot more.
“The work we’re doing now is understanding the effects of the Arctic on the whole climate system,” said Bond.

Jim O
October 2, 2014 9:39 pm

Ha! Liarist, that’s perfect.

Brute
Reply to  Jim O
October 2, 2014 11:54 pm

Unfortunately, no. The term “denier” is repugnant and Mears wears a suit of intellectual excrement by using it. That said, “liarist” is simply a childish way to avoid using the word liar.

latecommer2014
Reply to  Brute
October 3, 2014 3:11 am

Why avoid the word liar? I can’t see it being used in this manner here, as I see no blatant lie, but avoiding the word “liar”, when appropriate is just political correctness ( which is more detestable than lying IMO)

Paul Milenkovic
Reply to  Brute
October 3, 2014 2:52 pm

Chill, dude, chill. I think Monckton of Brenchley our guest commentator is serving as a “witist.”

Tim Groves
Reply to  Brute
October 3, 2014 10:02 pm

A “liar” is someone who tells one or more lies. A “liarist” is someone who makes a career or follows an ideology based on or necessitating the telling of lies. It’s an important distinction that, among other things, helps us to more easily discern the the existence of the pseudoscientific field of climate liarism, which is such an important feature of today’s world that deserves its own annual prize.

Werner Brozek
October 2, 2014 9:39 pm

RSS for September came in at 0.206. This lowers the average to 0.252 so 2014 would rank as 7th warmest if it stayed this way.

RockyRoad
Reply to  Werner Brozek
October 2, 2014 9:55 pm

I hope it stays warm, Werner. It’s the cold that kills. Ask my tomatoes.

Magicjava
October 2, 2014 9:56 pm

Love the “liarist” line. 🙂
Temperature has never followed CO2, it’s not following it now, and it never will. The “climate sensitivity” of the doubling of CO2 is, has been, and always will be zero.

Big D in TX
October 2, 2014 10:08 pm

There are now people of voting age in the United States who have never experienced global warming.
I think it’s an interesting thought.

Jimbo
Reply to  Big D in TX
October 3, 2014 1:33 am

18 year old adults don’t know what global warming is.

Old Goat
Reply to  Jimbo
October 3, 2014 1:49 am

I’m nearly four times that age, and I can honestly say that I’ve never experienced “global warming” either. What is it? How would I know? And does it really matter anyway?

Paul
Reply to  Jimbo
October 3, 2014 5:21 am

“18 year old adults don’t know what global warming is.”
Because of the efforts to “educate” them, they certainly know what it is AND what causes it.
Global warming IS real, just ask young person or late night “news comedian.

Just an engineer
Reply to  Jimbo
October 3, 2014 6:28 am

Be careful Paul, you should add a “/sarc” as there are CAGW believers that would think you are one of them.

Jimbo
Reply to  Jimbo
October 3, 2014 11:55 am

Let me re-phrase.
18 year old adults have never experienced global warming (except in school).

TYoke
Reply to  Big D in TX
October 6, 2014 6:04 pm

Up until 1999, when James Hansen started “adjusting” the historical U.S. temperature record, there was NO historical warming for the continental U.S. So for those of us who are American and dubious about GISS machinations, there has been no warming regardless of our age.
http://www.giss.nasa.gov/research/briefs/hansen_07/

Clay Marley
October 2, 2014 10:08 pm

Recent extreme weather cannot be blamed on global warming, because there has not been any global warming. It is as simple as that.

True, but what “recent extreme weather”? More hurricanes? No. More tornadoes? No. More wildfires, floods, droughts? No trends there. Sea ice? Seems to be increasing slightly. I don’t see anything in the last few decades that would indicate there are increasing trends in extreme anything. Well, at least not related to climate.
Time to put that myth to bed too.

Admad
Reply to  Clay Marley
October 3, 2014 1:52 am

More Niceweather perhaps?

latecommer2014
Reply to  Clay Marley
October 3, 2014 3:17 am

We always have ” extreme weather” . A particularly big storm qualifies.
It is an increase in number or severity of same that we don’t have. Technically he is correct.

October 2, 2014 10:12 pm

I have just skipped through Dr Mears paper. Can somebody please explain to me why under the heading “internal variability ” he states that the hiatus could be caused by “bad luck” . Bad luck for what? That the planet hasn’t warmed for 18 years? What have I missed?

jorgekafkazar
Reply to  Billy NZ
October 2, 2014 10:23 pm

Bad luck for delusional believers in AGW.

Reply to  jorgekafkazar
October 2, 2014 10:34 pm

Thanks for that,so I did have it right. They are praying for warming to say “we told you so” but not oh,that’s good news,we aren’t going to fry to death,because the planet isn’t warming.

Reply to  Billy NZ
October 2, 2014 10:57 pm

Bad luck for what? That the planet hasn’t warmed for 18 years? What have I missed?
The same thinking that lead Trenberth to say in the climategate emails that they couldn’t find the missing heat and that it was a “tragedy” that they couldn’t. So invested are they in their belief system, that they would actually prefer the catastrophe of global warming to being wrong.

NZ Willy
Reply to  davidmhoffer
October 2, 2014 11:07 pm

Trenberth said “travesty”, not tragedy.

JJ
Reply to  davidmhoffer
October 3, 2014 8:19 am

And the same thinking that led Phil Jones to state that only after 15 years of no warming would they have to “worry”.
When no global warming is your “bad luck”, and when no global warming is your reason to “worry”, it is pretty clear that you consider the threat of catastrophe to be desirable.

DirkH
Reply to  Billy NZ
October 3, 2014 12:54 am

Bad luck for wannabe technocrat rulers of the planet. Obviously Mears is more concerned about him dominating the planet than about humanity. Freudian slip; haul him to the science communication re-education seat immediately.

mpainter
Reply to  DirkH
October 3, 2014 2:10 am

And buckle him in.

garymount
Reply to  Billy NZ
October 3, 2014 2:07 am

And I know that some thing or things caused temperature to take the values it did. I also know that “chance” or “randomness” weren’t the causes.

http://wmbriggs.com/blog/?p=13721

Reply to  Billy NZ
October 3, 2014 3:00 am

Mears has used the “bad luck” line before…and apparently his bad luck in finding the missing “heat flux” continues!
“Bad Luck. By Bad Luck, I mean that the last decade is cooler than normal due to the random occurrence of some pattern of unforced internal variability. Most climate model simulation exhibit decade-long periods of little or no warming, as shown by Eastering and Wehner (2009). And in general, climate models, even though they tend to have too much year-to-year variability (as mentioned by John in his initial post), often show too little variability on multidecadal on longer scales. There is an interesting discussion of this topic in a recent issue of the AGU newsletter (Lovejoy, 2013). So, for multidecadal time periods, I would expect the real world to be bumpier (on multidecadal time acales) than a typical model simulation, and much bumpier than the mean of many simulations. Thus I think that there is some possibility part of the cause the current discrepancy may be just bad luck. Though the time period is getting long enough, and the discrepancy is getting large enough that we should be able to begin to understand something about what is going on. In other words, even if it is due to a random fluctuation, we should be able to see the fluctuation in other variables or parts of the system, such as heat flux into either the ocean or into space.” http://www.climatedialogue.org/the-missing-tropical-hot-spot/

latecommer2014
Reply to  Tom Moran
October 3, 2014 3:23 am

I have often seen the term ” most climate models have not predicted…..” Isn’t it more accurate to say ” NO climate models have predicted…”?
A vain attempt to save something from the disaster ” climate science” has become?

Owen in GA
Reply to  Tom Moran
October 3, 2014 7:54 am

Using that logic,would it not be correct to say that the initial warming period observed and wiggle matched to train the models was not also a pattern of unforced internal variability?
It seems to me that the excuse simply reinforces the null hypothesis that all this is normal and not anthropegenic at all.

Patrick Maher
Reply to  Billy NZ
October 3, 2014 10:34 pm

When questioned by the BBC about the pause Dr. Phil Jones of the CRU kept replying “we won’t worry until the pause reaches…” What was he worried about? The concept behind the CRU was to mitigate the effects of global warming! Why would evidence that it wasn’t warming worry him? By the way, the pause has exceeded the length before they’d worry.

tomwys1
October 2, 2014 10:18 pm

“It doesn’t matter how beautiful your theory is, it doesn’t matter how smart you are. If it doesn’t agree with experiment, it’s wrong.” – Richard Feynman.
The above quote should be required reading for climate modelers and AGW pundits. Sic Semper Ignoti.

thegriss
October 2, 2014 10:35 pm

A brief look at UAH and RSS side by side gives an interesting comparison
1. UAH started lower than RSS, and was barely climbing before 1997, while RSS, climbed a bit faster.
2. both took approximately the same jump at the 1998 EL Nino event, that settled down by about the beginning of 2001.
3 Since then, RSS has cooled slightly and UAH has warmed slightly to bring them to about the same current anomaly.
http://woodfortrees.org/plot/uah/from/plot/rss/from/plot/uah/from:2001/trend/plot/rss/from:2001/trend/plot/uah/from:1979/to:1997/trend/plot/rss/from:1979/to:1997/trend

Eyes Wide Open
Reply to  thegriss
October 3, 2014 11:31 am

But wait for UAH v6.0. Apparently it will track closer to what RSS shows.

jorgekafkazar
October 2, 2014 10:46 pm

If Dr Mears doesn’t like 1997 for a start-date, why don’t we make him happy by using 1998, instead?

michael hart
Reply to  jorgekafkazar
October 3, 2014 1:13 am

Slartibartfast: I’d much rather be happy than right any day.
Arthur Dent: And are you?
Slartibartfast: Ahh… No.

You gotta feel a bit sorry for him, but it’s more important that he continue his work without the kind of ‘adjustments’ we see in some places.

Reply to  jorgekafkazar
October 3, 2014 6:22 am

Surely the start date is now.
We are counting backwards, aren’t we?
Back to when there was significant warming – then we stop counting.

David Ball
October 2, 2014 10:47 pm

Even if it were only 1 year of cooling, it still flies in the face of what we were told to expect.
I love mother nature. She, too, hates Al Gore.

October 2, 2014 10:55 pm

The discrepency with UAH is pretty eye-catching, though:
http://i1172.photobucket.com/albums/r565/Keyell/from-1995_zps917dc537.png
Something is clearly happening in the latter half of 2005. Before, the two curves follow each other remarkably well. And after, they do the same, only now with UAH tracking 0.1 degree above RSS. There is no gradual deviation, no ‘drift’. There is only the sudden shift in late 2005. Check it out for yourself …

thegriss
Reply to  Kristian
October 3, 2014 12:13 am

Read my post above. Only your offset makes it seem like there is an issue.
In actual fact, UAH was playing catch-up.

Reply to  thegriss
October 3, 2014 3:58 am

Yes, but it’s much simpler than your graph suggests. There is no ‘catch-up’ involved.
RSS and UAH track each other tightly from the start (1979) till 1992. Then UAH makes a sudden step down of about 0.07 degrees Celsius relative to RSS. If you realign the two datasets after this time, you will see that they once again follow each other without any real deviation down to late 2005. Then there’s a new abrupt step change. UAH all of a sudden lifts up relative to RSS, this time by 0.1 degree. Realign the two once more, and they track intimately a third time around all the way down to today.
http://woodfortrees.org/graph/rss/to:2005.67/plot/rss/from:2005.67/offset:0.1/plot/uah/to:1992/offset:0.07/plot/uah/from:1992/offset:0.14
So between 1979 and 2014, there is but two sudden shifts separating the two major global satellite datasets: one in the beginning of 1992 and one in the second half of 2005.
Apart from these two step changes – clearly of methodological origin – the RSS and UAH timeseries are actually remarkably congruent. The only thing that needs to be sorted out to fully align them is to determine which of the two is up for adjustment. Or maybe they both are …? (The figure above is just a suggestion.)

Reply to  Kristian
October 3, 2014 8:46 am

They are aware of the divergence,

Anyway, my UAH cohort and boss John Christy, who does the detailed matching between satellites, is pretty convinced that the RSS data is undergoing spurious cooling because RSS is still using the old NOAA-15 satellite which has a decaying orbit, to which they are then applying a diurnal cycle drift correction based upon a climate model, which does not quite match reality. We have not used NOAA-15 for trend information in years…we use the NASA Aqua AMSU, since that satellite carries extra fuel to maintain a precise orbit.
Of course, this explanation is just our speculation at this point, and more work would need to be done to determine whether this is the case. The RSS folks are our friends, and we both are interested in building the best possible datasets. On the Divergence Between the UAH and RSS Global Temperature Records

too bad the keepers surface station data weren’t as conscientious.

Reply to  Paul Jackson
October 3, 2014 11:20 am

They’re aware of ‘something’, but seemingly not of what the discrepancy in fact boils down to: just two methodological step changes, one in 1992 and one in 2005. Nothing of import happens at any other time from Jan 1979 to Sep 2014.
They talk about ‘decaying orbits’. That’s not it. UAH and RSS track each other impressively close all the way since 2005/6. There is no gradual divergence at all. The only reason why UAH has a positive trend and RSS a negative since 2001 is that abrupt 0.1 degree shift taking place in 2005:
http://woodfortrees.org/graph/rss/from:2001/offset:-0.14/plot/uah/from:2001/plot/rss/from:2001/offset:-0.14/trend/plot/uah/from:2001/trend
http://woodfortrees.org/graph/rss/from:2001/offset:-0.04/plot/uah/from:2001/plot/rss/from:2001/offset:-0.04/trend/plot/uah/from:2001/trend

Reply to  Kristian
October 3, 2014 11:39 am

Kristian’s graph is well observed. I’ll ask Roy Spencer about it.

Patrick Maher
Reply to  Monckton of Brenchley
October 3, 2014 10:48 pm

I had the good fortune to meet you very briefly two years ago. You were most gracious and went out of your way to introduce yourself to everyone who wanted to meet you. You treated everyone with the same level of respect whether they agreed with you or not. I was very impressed. Needless to say you made a very good first impression. Please keep up the good work.

Reply to  Monckton of Brenchley
October 5, 2014 10:08 am

Mr Maher is very kind. I very much regret that this subject has become as politicized as it has. Science should – as far as possible – be free of politics: and the defiance of rational argument on the part of the climate liarists is a denial of that which marks us out most plainly from the beasts and brings us most closely in resemblance to our Creator: the faculty of reason.

October 2, 2014 11:02 pm

I was just thinking….
First the tree rings diverged from the temperatures.
Then, the temperatures diverged from the models.
Are the temps and the tree rings hooking up somewhere? Is that what has gotten the models hot? They’ve been scorned?

richard verney
Reply to  davidmhoffer
October 3, 2014 12:26 am

The trees had it right all along; it was not warming.
The apprent warming, in the land based temperature record, was an illusion of the homogenisation adjustments, station drop outs, and UHI etc.
The satellite data between say 1979 and 1997 was also essentially flat with no warming.
Accordng to the satellite data, there has been only one isolated warming event, namely in and around the 1998 Super El Nino, which resulted in a step change. If you remove that event (and no one seriously claims that that was caused by CO2) the temperatures have been approximately flat throughout the satellite period. Certainly no first order correlation with CO2 is apparent.

Vince Causey
Reply to  richard verney
October 3, 2014 12:58 am

Are you implying that the trees are smarter than Mann?

RACookPE1978
Editor
Reply to  richard verney
October 3, 2014 11:43 am

The trees are smart enough to grow faster BECAUSE of the extra CO2 in their atmosphere since 1945 …
Thereby making Mann-made global warming since 1945 appear in tree rings at ever-increasing tree-growth rates!
Ergo, ifso fatso, the trees are smarter than Mann-made global warming!

Editor
October 2, 2014 11:27 pm

> Big D in TX
> October 2, 2014 at 10:08 pm
>
> There are now people of voting age in the United States who have
> never experienced global warming.I think it’s an interesting thought.
Our children will grow up not knowing what global warming looks like. Won’t someone please think of the children?
When I was a kid, and there was a cold snap, there would always be some old codger telling us that it was nothing compared to the winter of 19-whatever.. Now that I;m starting to approach the old codger stage, I’ll have to tell today’s kids that the heat they’re seeing is nothing compared to the summer of 19-whatever. Speaking of old codgers, who remembers these ads…
http://www.popandroll.com/coke-art/Coca-Cola_Art_Pause2.jpg

John F. Hultquist
October 2, 2014 11:29 pm

From just the quotes on this post I think Dr. Carl Mears is not well informed about the argument regarding “global warming” that causes him to describe folks as de—–sts. The issue is whether or not people that believe liberty is important should allow that liberty to be taken away and handed to the UN based on an idea, namely catastrophic anthropogenic global warming, that isn’t happening.
Beyond that, those of us that believe in life, liberty, and the pursuit of happiness believe others on Earth that do not share this sort of existence should be allowed, encouraged, and aided in achieving it. Why does Dr. Mears wish for people’s lives to be poor, nasty, brutish, and short?

Reply to  John F. Hultquist
October 3, 2014 11:42 am

That ad is definitely a keeper. Reminds me of the German “Mach mal Pause”.

stargazer
October 2, 2014 11:34 pm

“Denialists .”
1 Corinthians 13:11 King James Version (KJV)
11 When I was a child, I spake as a child, I understood as a child, I thought as a child: but when I became a man, I put away childish things.
Somebody needs to grow up. stop throwing temper tantrums and accept observed truths.
Like a serious, adult scientist should.

Kohl
Reply to  stargazer
October 3, 2014 1:36 am

Don’t you mean ‘temperature’ tantrums?

DC Cowboy
Editor
Reply to  stargazer
October 3, 2014 3:45 am

Unfortunately Lord Monkton is responding in kind and that only legitimizes Dr Mear’s childish behavior. Instead of being two educated men discussing an issue, they both appear to be no better than elementary school boys exchanging insults and observers can’t tell the difference.

Reply to  DC Cowboy
October 3, 2014 11:43 am

Jeez! Lighten up, dude.

James Allison
October 2, 2014 11:40 pm

Our children won’t know what climate change is.

Brute
Reply to  James Allison
October 2, 2014 11:58 pm

Well, as it has been redefined, no one does.

The Ghost Of Big Jim Cooley
October 2, 2014 11:41 pm

Have the liarists come up with a mechanism (serious question, as I must have missed it) how the oceans are storing up temperature? If I fill a bath with cold water, and the room is heated to 20 degrees c, the water will absorb that heat energy (from the air in the room) and slowly warm the water. However, it does require the room to be topped up with heat that it has just lost to the water. So the water temp is lagging behind the room temp. But, if the room doesn’t receive heat, then the water temp won’t increase. Do I have that right? So, how can oceans continue to absorb warmth, when the air above the ocean isn’t increasing in warmth?

Vince Causey
Reply to  The Ghost Of Big Jim Cooley
October 3, 2014 1:20 am

If the air in the room was continually circulated then eventually both the water and air would reach the same temperature as dictated by the second law of thermodynamics (entropy always increases). However, more realistically, the air above the bath would remain cooler than the air above due to cooler air being denser.
The scenario you describe bares little relationship to the world since it is receiving energy from the sun and it is this radiant energy that warms the oceans not the air above it. A better question is if global warming only increases ocean heat content by 1/100 of a degree how can this hidden heat then come out and warm the air multiple degrees? IMO, that would be impossible.

The Ghost Of Big Jim Cooley
Reply to  Vince Causey
October 3, 2014 4:13 am

Vince, thanks, but if it is the Sun (radiation) that is warming the oceans, why is the ocean heat content (OHC) increasing? Surely, the ocean would have reached a temperature and remained pretty stable? Atmospheric and land surface temps showed a rise that is now stable. But OHC is still on the up. How so?

Crispin in Waterloo
Reply to  Vince Causey
October 3, 2014 9:20 pm

In practical terms, in a real room with a real bathtub, the water would always be cooler than the average room temperature.
Heat would leave the room by conduction. Especially at the top. It would be heated by condensation of water vapour. The water vapour would be replaced by evaporation of water from the tub. Condensed water would run down the walls.
This can be witnessed in a real bathroom. For a long time, the floor would gain water, the air would be in circulation transporting water vapour from the tub and the tub water would be cooler than the air.
If a light was on in the room the process would continue with the water now on the floor always being cooler than the air. Warm oceans heat air very effectively. Hot air warms water really poorly, from above

steveta_uk
Reply to  The Ghost Of Big Jim Cooley
October 3, 2014 1:38 am

As long as the atmosphere is warmer (due to the sun) then since the oceans are very big I don’t see a problem with them continuing to take up heat for years, perhaps 100’s of years, as they in fact have done for the 200-300 years.

Richard Verney
Reply to  steveta_uk
October 3, 2014 3:04 am

Don’t you mean about 4 billion years?
Even after all that time the ocean temp is only about an average of approximately 3 degC.

The Ghost Of Big Jim Cooley
Reply to  steveta_uk
October 3, 2014 4:19 am

steveta, this isn’t what Vince is saying. He’s saying it is radiation, not conduction. Personally, I have an understanding-problem with this. Surely, it’s both, isn’t it?

GeeJam
October 2, 2014 11:46 pm

Excellent as ever M’Lord. My wife and I will crack open the bubbly tonight to celebrate (and release lots of lovely CO2 into the kitchen in the process). Love the ‘liarist’ term. Brilliant.
Here’s a thought. In about one month from now (and lasting about a week), many gullible ‘liarists’ and their families will attend various organised bonfire events in the UK. They will go ‘ooh and ahh’ to incredibly expensive pyrotechnical displays and enjoy being almost deafened by the ‘boooof’ of mortar rockets. They’ll stand around watching huge bonfires burn all that carbon, their children will breath in all the smoke and sooty particulates – and they’ll all go home agreeing that they had a fabulous time and must do the same thing again next year. Am I being obtuse or are ‘liarists’ a bunch of complete hypocrites when it comes to 5th November?

Konrad.
Reply to  GeeJam
October 3, 2014 12:16 am

5th of November? Oh I remember –
Guy Fawkes — “The Only Man Ever To Enter Parliament With Honest Intentions”
How many opposed the bill on “climate fools day” as the first October snow in 70 years blanketed the House? Not may honest folk were there…

Mr Green Genes
Reply to  Konrad.
October 3, 2014 1:27 am

3 in fact.
Mr. Christopher Chope
Mr. Peter Lilley
Mr. Andrew Tyrie
according to Hansard

Konrad.
Reply to  Konrad.
October 3, 2014 4:23 am

And in our cups freshly remember’d those happy (3) few on St. Crispin’s day.
For the rest? Vicious and sustained public floggings. You know it’s the only solution…

Paul Nottingham
October 2, 2014 11:47 pm

Sorry to ask a stupid question but I notice that the temperatures per the models dip at the time of the El Chichon and Pinatubo eruptions and seem to be generally more accurate up to around 1997 than afterwards. Does this indicate that many of the models have been adjusted in light of reality or is this what they were showing before the various events?

Reply to  Paul Nottingham
October 3, 2014 1:11 am

In response to Mr Nottingham, the models (after adjustment for hindsight factors) seem uncannily brilliant at backcasting, but uncommonly useless at forecasting. Cant’ think why.

Reply to  Monckton of Brenchley
October 3, 2014 5:06 am

I can accurately predict the results of every Superbowl back to the first. But I am lousy at predicting the future ones,.

AndyL
October 2, 2014 11:50 pm

Thanks for this
You have carried out an experiment where you replaced the 1998 peak with figures from teh 2010 peak, Can you say how long the pause would have been with those figures, usign the same calculation basis?

Reply to  AndyL
October 3, 2014 1:14 am

In answer to AndyL, the period without warming would have been exactly 18 years if the 1998 el Nino had been no warmer than the 2010 el Nino. The Pause is real, and is not a mere artefact of the 1998 outlier.

AndyL
Reply to  Monckton of Brenchley
October 3, 2014 5:05 am

Thanks Christopher,
I didn’t think the pause was an artifact of 1998, but had guessed that the pause would be of the order of 16 years with a lower 1998 peak.

Richard M
Reply to  AndyL
October 3, 2014 6:55 am

A good way to see that 1998 has little impact is to show the trend from both the start of the pause and the year 2000. The trends are almost identical.
http://www.woodfortrees.org/plot/rss/from:1996.66/plot/rss/from:2000/trend/plot/rss/from:1996.66/offset:0.01/trend

Reply to  Richard M
October 3, 2014 11:48 am

That’s an admirable test. If only the liarists would do science by asking questions like this.

mark from socal
October 2, 2014 11:56 pm

My grand daughter is a victim of this. She is 10 and believes the crap her teachers tell her. Even though global warming stopped before she was born. My only recourse is to say just believe grandpa, The propaganda is hard to overcome.. When you are just learning science,, how do you overcome Climate Science inc?This is a big problem and will not go away soon.

RACookPE1978
Editor
Reply to  mark from socal
October 3, 2014 11:44 am

Show her the graph. Print it and have her color it with her crayons.
Make it “her” graph each month.

Patrick Maher
Reply to  RACookPE1978
October 3, 2014 11:29 pm

Great idea! Better still, let her go on the woodfortrees website and let her run the numbers herself. One run through with the parents’ help should be enough to start her thinking. Let her print the chart and let her color it. Running the data herself is far more convincing than having someone hand her a chart. Convincing her is the first problem. All the students at her school have been indoctrinated as well. Dealing with her classmates may pose yet another problem.

Mike McMillan
October 3, 2014 12:02 am

Your lordship has the “start date” backwards. The start date is the latest month with complete data, always, and therefore cannot be cherry picked because its selection follows a rule. The end date is the earlier, since we’re going backwards to get our Pause length. No cherry picking argument possible.

thegriss
Reply to  Mike McMillan
October 3, 2014 12:14 am

Precisely. !

Pat Kelly
October 3, 2014 12:03 am

The pause is now old enough to vote.

DC Cowboy
Editor
Reply to  Pat Kelly
October 3, 2014 3:46 am

and serve in the military

Reply to  DC Cowboy
October 3, 2014 11:50 am

And get married. And drive a car.

Patrick Maher
Reply to  Pat Kelly
October 3, 2014 11:30 pm

In my home town it’s old enough to drink.

October 3, 2014 12:03 am

“Terrestrial temperatures are measured by thermometers. Thermometers correctly sited in rural areas away from manmade heat sources show warming rates appreciably below those that are published. The satellite datasets are based on measurements made by the most accurate thermometers available – platinum resistance thermometers, which not only measure temperature at various altitudes above the Earth’s surface via microwave sounding units but also constantly calibrate themselves by measuring via spaceward mirrors the known temperature of the cosmic background radiation, which is 1% of the freezing point of water, or just 2.73 degrees above absolute zero. It was by measuring minuscule variations in the cosmic background radiation that the NASA anisotropy probe determined the age of the Universe: 13.82 billion years.”
This paragraph is filled with gross errors.
Below find the real description of how its done. Please note the adjustments and corrections to the raw data
http://www.remss.com/measurements/brightness-temperature
when you finish that you will understand what RSS themselves say
“A similar, but stronger case can be made using surface temperature datasets, which I consider to be more reliable than satellite datasets “

Reply to  Steven Mosher
October 3, 2014 1:20 am

The quotation given by Mr Mosher does not appear anywhere in the reference he cites. Since he is, as usual, nit-picking, he should have started by making it clear that the quotation did not come from the reference given.

Reply to  Monckton of Brenchley
October 3, 2014 8:32 am

The quote come from the ARTICLE YOU LINKED TO! did you not read it!
http://www.remss.com/blog/recent-slowing-rise-global-temperatures
Measurement Errors:
As a data scientist, I am among the first to acknowledge that all climate datasets likely contain some errors. However, I have a hard time believing that both the satellite and the surface temperature datasets have errors large enough to account for the model/observation differences. For example, the global trend uncertainty (2-sigma) for the global TLT trend is around 0.03 K/decade (Mears et al. 2011). Even if 0.03 K/decade were added to the best-estimate trend value of 0.123 K/decade, it would still be at the extreme low end of the model trends. A similar, but stronger case can be made using surface temperature datasets, which I consider to be more reliable than satellite datasets (they certainly agree with each other better than the various satellite datasets do!). So I don’t think the problem can be explained fully by measurement errors.
NEXT,
Every time you publish this you repeat the same nonsense
“Terrestrial temperatures are measured by thermometers. Thermometers correctly sited in rural areas away from manmade heat sources show warming rates appreciably below those that are published. The satellite datasets are based on measurements made by the most accurate thermometers available – platinum resistance thermometers, which not only measure temperature at various altitudes above the Earth’s surface via microwave sounding units but also constantly calibrate themselves by measuring via spaceward mirrors the known temperature of the cosmic background radiation, which is 1% of the freezing point of water, or just 2.73 degrees above absolute zero. ”
That is NOT how it is done. The temperatures are the result of a RTM. a radiative transfer model.
First the calibration
“Only some of the radiometers need hot load thermal gradient corrections. The determination of TB from counts for microwave radiometers is completed using two known temperatures to infer the Earth scene temperature. For each scan, the antenna feedhorns view a mirror that reflects cold space (a known temperature of 2.7 K) and a hot absorber measured by several thermistors. Assuming a linear response, the Earth scene temperatures are then determined by fitting a slope to these two known measurements (hot and cold). This 2-point calibration system continuously compensates for variations in the radiometer gain and noise temperatures. This seemingly simple calibration methodology is fraught with subtle difficulties. The cold mirror is relatively trouble-free as long we note when the moon intrudes on the cold space view and remove moon-affected values. The hot absorber has been more problematic. The thermistors often do not adequately measure thermal gradients across the hot absorber. For example, a hot load correction is required for AMSR-E because of a design flaw in the AMSR-E hot load. The hot load acts as a blackbody emitter and its temperature is measured by precision thermistors. Unfortunately, during the course of an orbit, large thermal gradients develop within the hot load due to solar heating making it difficult to determine the average effective temperature from the thermistor readings. The thermistors themselves measure these gradients and may vary by up to 15 K. Several other radiometers have had similar, but smaller, issues.”
and
“Calculating TB from raw radiometer counts is a complex, multi-step process in which a number of effects must be accurately characterized and adjustments made to account for them. These effects include radiometer non-linearity, imperfections in the calibration targets, emission from the primary antenna, and antenna pattern adjustments. RSS TB are consistently calibrated so that the TB measurements for all sensors can be used to construct a multi-decadal time series. A rain-free ocean is used as the absolute calibration reference and our state-of-the-art radiative transfer model (RTM) of the ocean and intervening atmosphere in the absence of rain can predict the top-of-the-atmosphere TB to a high degree of accuracy. A complete description of the calibration of all SSM/I is available. Though the document describes on SSM/I sensors, the approach applies to the other radiometers.”
RTM is a radiative transfer model.
More here in the calibration report
http://images.remss.com/papers/rsstech/2012_011012_Wentz_Version-7_SSMI_Calibration.pdf
Your description of the accuracy of this platform is wrong. I refer you to page 2 of the calibration report.
Mears, rightly, gives precedence to the surface measurments. he should know. All the documentation on the accuracy supports this. The RSS temperatures are the result of a model. RTM without a model of radiative physics, there is no temperature there is only brightness at the sensor. Brightness at the sensor is TRANSFORMED into temperature at the troposphere by applying a physics model.

Reply to  Monckton of Brenchley
October 3, 2014 9:13 am

Actually my understanding is that the satellites measure the temperature using a microwave sensing radiometer, the radiometer is calibrated by having it measure the temperature of an onboard reference whose temperature is measured by the Pt wire thermometer, and the Cosmic background. The Onboard temp being the Hot target, the Cosmic background being the Cold traget,

Satellite passive microwave radiometers measure raw antenna counts from which we determine the antenna temperature and then calculate the brightness temperature of the Earth. Large antennas are used for the various channels of the radiometer, and during operation, each antenna feedhorn passes a hot and cold target in order to provide consistently calibrated raw counts. Brightness temperature (also referred to as TB) is a measure of the radiance of microwave radiation traveling upward from the top of Earth’s atmosphere. The conversion from radiometer counts to top-of-the-atmosphere TB is called the calibration process. Several calibration processing steps are required to derive the TB values. Microwave radiometer TB are considered a fundamental climate data record and are the values from which we derive ocean measurements of wind speed, water vapor, cloud liquid water, rain rate, and sea surface temperature. Brightness Temperature

I just hate it when Steven Mosher is right, but this is one of those times.

Reply to  Monckton of Brenchley
October 4, 2014 2:00 am

Mears, rightly, gives precedence to the surface measurments. he should know.

LMAO, only because RSS has not been showing any warming. Are you really that naive? I am sure the longer Monckton stays on this, the more energy they will invest in an “adjustment” to make the pause disappear from RSS.

michael hart
Reply to  Steven Mosher
October 3, 2014 1:26 am

Reliable in what sense?
Accurate?
Precise?
Representative?

Reply to  michael hart
October 3, 2014 8:35 am

Start by reading more and commenting less.
1. Start by reading the ATBD for all of the platforms used in RSS.
2. read RSS documents– especially the calibration report.
3. When you finish your homework you can ask a question.

Reply to  Steven Mosher
October 4, 2014 1:45 am

when you finish that you will understand what RSS themselves say
“A similar, but stronger case can be made using surface temperature datasets, which I consider to be more reliable than satellite datasets “

No says “Carl Mears” a team member of RSS,
http://www.remss.com/blog/recent-slowing-rise-global-temperatures
Didn’t you read the page?
Obviously they don’t want anyone using their data (RSS) to make a skeptic argument since they have invested so much time in attacking UAH and Dr. Christy.
Not to mention Mears second favorite co-author is alarmist Ben Santer,
http://www.remss.com/about/profiles/carl-mears
Yeah, I think we are going to keep using RSS data to make our point.

Vince Causey
Reply to  Steven Mosher
October 3, 2014 3:11 am

It would be useful to give the paragraph number you are quoting from – this is quite weight tome.

Reply to  Vince Causey
October 3, 2014 8:15 am

read the whole document. I did.

Keitho
Editor
Reply to  Steven Mosher
October 6, 2014 10:34 am

Hi Steven, thanks for the precision in your contributions. A question for you, is the resolution of the RSS measurements sufficient to show UHI effects?
Thanks.

October 3, 2014 12:12 am

I am quite prepared to accept that the physics in the models is correct. It’s the physics that’s NOT in the models that is the problem imo. Those “unknown unknowns” in other words.

Konrad.
Reply to  rogertil
October 3, 2014 12:45 am

I am quite prepared to accept that the physics in the models is correct. It’s the physics that’s NOT in the models that is the problem

Roger in this you are 100% correct, the physics used is valid in modelling some systems, but for climate modelling it was not fit for purpose. However as to unknowns, there is considerable evidence that some of the climastrologists knew what was missing and went to great length to hide it.
There are two main errors in the “basic physics”, both are sufficient to invalidate the hypothesis.
The first is radiative subsidence of air masses from altitude. This plays a critical role in tropospheric convective circulation. Ie: the speed of this circulation must increase for increased radiative gas concentration. If you don’t include this, you end up modelling increased near surface temps for increased radiative gases.
The second critical error is that while basic SB equations work fine for many surfaces, they should never, ever, ever be applied to transparent materials let alone materials that evaporatively cool. That would be about 71% of our planets surface. Any guesses what the Church of Radiative Climastrology went and did? (no prizes for this one…) Model the solar heating of the oceans correctly and you find that the net effect of our 1 bar atmosphere is cooling of the oceans. And how could the atmosphere then cool? Radiative gases. Yes, the error is that bad…it’s a “fist-biter”.
So, you are correct, all the climate models are failing because of what they didn’t include. When you go back over the history of the AGW players and papers, it is clear that some worked it out. Faced with the fact that including the correct physics would end the hoax, they chose to do the wrong thing. I’ve got a little list of names…

Reply to  Konrad.
October 3, 2014 7:09 am

Name them… give them the right to reply.

Rud Istvan
Reply to  rogertil
October 3, 2014 6:41 am

Actually, mostly known unknowns. Owing to computational limitations, the smallest grid cells are an order of magnitude larger than convection cells. So they cannot simulate a version of Lindzens adaptive iris. Convection cells form tstorms which release latent heat at altitude, making it easier to escape, and produce precipitation which lowers the water vapor feedback. That is why the models produce the tropical upper troposhere hotspot that in reality does not exist. The problem is not the physics. Its that the models cannot simulate the physics. So they are parameterized instead. And the parameter tuning was to a natural uptick in temperature. So they now run obviously hot. Akasofu first pointed this out in (IIRC) 2007.

David Schofield
October 3, 2014 12:20 am

Phil Jones said we should be worried if it doesn’t warm. Says a lot about them.

DC Cowboy
Editor
Reply to  David Schofield
October 3, 2014 3:49 am

Maybe he meant ‘he’ rather than ‘we’?

October 3, 2014 12:24 am

“…. and the correlation coefficient, which is very low because, though the data are highly variable, the trend is flat.”
That is not correct. If the data was flat as well the linear trend would have a high correlation.
What this tells us is that there is very little resemblance between temperature and a straight line.

Reply to  climategrog
October 3, 2014 1:23 am

“Climategrog” should perhaps have read what I wrote a little more closely. I gave two conditions for the zero correlation coefficient: not only the flat trend but also the highly variable data.

Gareth Phillips
October 3, 2014 12:41 am

Have a look at various data from outside the eighteen year period. You can choose your own starting date. It may not have significantly warmed over the last eighteen years, but is sure has if any dates over the last 100 years prior to that are chosen. The other critical point is that the temperature rose, but it did not go down over the last eighteen years, it has levelled off. That is puzzling, but not a cause for celebration. http://www.ncdc.noaa.gov/cag/time-series/global

Cold in Wisconsin
Reply to  Gareth Phillips
October 3, 2014 1:51 am

But going back to a period before “man made Co2” is pertinent means that any warming is based upon natural causes. Then why not go back 200, 300, 500 years, or all the way back to the MWP? Is it still warming, and is it caused by humans and their evil fossil fuels?

Gareth Phillips
Reply to  Jimbo
October 3, 2014 3:05 am

I can’t personally Jimbo, I’m just commenting on the fact that overall 20th century temps rose and have not gone back down. I suspect rapid industrialisation is a factor, but I’m happy to look at other reasons.

Richard Verney
Reply to  Jimbo
October 3, 2014 3:18 am

Jimbo is right to question the cause of the ~1910 to ~1940 warming.
But also, who seriously considers that we know the temperature back in 1880 to +/- 0.2degC?
Where were these reliable global thermometers actually sited, when and how calibrated, and how could they have measured temperature to such precision and accuracy?
When appropriate and realistic error bars are included, the truth is that we do not know (for sure0 whether it is warmer today than it was in the late 1930s or the 1880s. Period.

nicholasmjames
Reply to  Jimbo
October 3, 2014 4:52 am

Lord Monckton.
If we use the above Gl-OTI temperature trend, then
1). from 2000 to 2015. Anomaly = 0.6 C. dT= 0. No net warming in 15 years.
Then going backwards in time.
2) 1970 to 2000. dT= 0.6 C. anomaly rises from 0 C to 0.6 C. A .6 C rise in 30 years.
Coincides with the rise in power of global warming theory.
3) 1940 to 1970. Anomaly = 0 C. dT= 0 C. The previous 30 year pause!
4) 1910 to 1940. dT = 0.4C anomaly rises from -0.4C to 0 C. A 0.4 C rise in 30 years.
The previous ‘warming’ cycle.
5) 1880-1910. DT = -0.2 C. anomaly falls from 0 C to -0.2 C. A -0.2 C fall in 30 years.
I relaxed the eyeball fit of the trends slightly in favor of an overall fixed time interval (30 years) for the periods. We have 4.5 thirty year periods of data available in this plot.
Should these overall short term cycles continue, then we will have another 15 years of flat or falling slightly temperatures for the current 30 year period.

Jimbo
Reply to  Jimbo
October 3, 2014 12:06 pm

Gareth Phillips, please note that about half the temperature rise people are screaming about took place between ~1910 to 1940.

knr
Reply to  Gareth Phillips
October 3, 2014 2:52 am

The claimed relationship between CO2 levels and temperature , was very simple CO2 goes up temperature goes up and that was ‘settled science ‘ that could not be questioned . While CO2 levels have gone up , no disputes that , but temperatures have not despite the ‘settled science ‘ that could not be questioned. In any other area of science you look to see if there is a problem in the original idea as its clear the relationship is not working as it claimed it would do. But this is ‘settled science ‘ that could not be questioned, so need to think of magic missing heat etc was created because has ‘settled science ‘ that could not be questioned it cannot be that the fault is in the ‘settled science ‘ that could not be questioned in the first place.
As there every before been anyone or anything , outside Jesus , that was born or originated so unquestionable perfect that it simple could never be wrong , has climate ‘science’?

Reply to  knr
October 3, 2014 3:30 am

knr,
Thanks for that. They disregard the finding that ∆CO2 follows ∆temperature.
That by itself deconstructs the conjecture that CO2 is the cause of global warming.

beckleybud@gmail.com
Reply to  knr
October 4, 2014 6:05 am

..
.
∆CO2 has not been following temperature for the past 15/16/17/18 years.

beckleybud@gmail.com
Reply to  knr
October 4, 2014 6:08 am


.
∆CO2 has not been “following” temperature for the past 18 years.

Reply to  beckleybud@gmail.com
October 6, 2014 10:53 am

Thiotimoline

Reply to  knr
October 4, 2014 8:54 am

beckleybud,
As a matter of fact, CO2 does follow temperature:
http://cyclesresearchinstitute.files.wordpress.com/2011/06/co2-temperature-roc.png
Thus, the entire “carbon” scare is debunked.

Reply to  knr
October 4, 2014 9:06 am

Another view showing that ∆CO2 follows ∆T:
http://www.woodfortrees.org/plot/esrl-co2/isolate:60/mean:12/scale:0.26/plot/hadcrut3vgl/isolate:60/mean:12/from:1958
Clearly, CO2 follows temperature.
The alarmist crowd got causation backward, therefore it’s original premise was wrong. With a wrong premise, naturally their conclusion was wrong.

beckleybud@gmail.com
Reply to  knr
October 4, 2014 1:10 pm

@dbstealey…

Sorry, but your ” ∆CO2 follows ∆temperature.” is falsified by the fact that in the past 18 years, ∆T is zero, but ∆CO2 is non-zero.
∆CO2 should have been zero for the past 18 years if it “follows temperature”

Reply to  knr
October 4, 2014 6:10 pm

Bud,
Can you really not understand? This is not about comparinfg T from 18 years ago with current temperature. This is showing that when T rises, CO2 follows. When T falls, CO2 follows.
Look closely at the graphs, please: temperature goes up. Then CO2 goes up — afterward.
We see that it happens repeatedly, and in that order. But not in the reverse order! Therefore, ∆T causes ∆CO2.
Most people, at least all rational people, would describe that cause-and-effect as CO2 following temperature. See?
And that has happened over the past 18 years. The most recent chart I posted ends in 2014. [This chart shows the same cause-and-effect going back hundreds of thousands of years.] ∆CO2 follows ∆T.

beckleybud@gmail.com
Reply to  knr
October 4, 2014 6:25 pm


..
It is obvious that you don’t know what your “graph” is saying. You have lost the trends in the data by using “rates of change instead of absolute value” Also your graphic is using GHCN data which is anomaly data, not raw temperature. A clear case of apples and oranges. Effectively, all you are doing is comparing the noise in one data set with the noise in another data set
..
You yourself have said “global warming has STOPPED” Since warming has stopped, your ∆T is zero.

If ∆CO2 follows temperature, then ∆CO2 should ALSO be zero.
This is the relationship you need to address….
..
http://www.woodfortrees.org/plot/esrl-co2/offset:-360/plot/hadcrut4gl/from:1960

Reply to  beckleybud@gmail.com
October 6, 2014 12:50 pm

^How to lie with graphs.^ Make sure the axes are set to not show any changes on the variable you are trying to hide.

Reply to  knr
October 4, 2014 7:15 pm

beckleyB,
How many charts do I have to post?
Here’s another.
And another one.
Another one here.
And another.
And another one.
They ALL show the same thing: ∆CO2 follows ∆T.
But the chart you just posted is simply a variant of this chart. The reason I didn’t use it is because it is a simple overlay. It does not show cause-and-effect, like the others I posted.
So you posted a chart that does not show causation, while I posted numerous charts showing that CO2 follows T.
I know exactly why you will not admit it. It is because if you do admit that ∆T is the cause of ∆CO2, then it follows that your “carbon” scare is debunked — by you! But you have now painted yourself into a corner. If you had been smart, you would never have started. Sometimes it’s best to keep quiet.
I have more charts. Want to see them? Just say the word.

beckleybud@gmail.com
Reply to  knr
October 4, 2014 7:29 pm


..
Chart number 1…….doesn’t show CO2 today at 400 ppm
Chart number 2…….doesn’t show CO2 today at 400 ppm
Chart number 3…….doesn’t show anything
Chart number 4…….doesn’t show CO2 today at 400 ppm
Chart number 5…….shows rates of change, doesn’t show the trend relationships.

None of your “charts” show the current CO2 level of 400 ppm. None of your charts show the temperature RISE that should allow the CO2 to FOLLOW the temp change. Please show me the temperature rise in the past 18 years that caused CO2 to rise from 365 ppm to 400 ppm.

As you have said, there has been no global warming in the past 18 years. Zero. zilch.
..
∆T = zero for 18 years, ∆CO2 = 35 ppm for 18 years.

By your own admission of “no global warming” ∆CO2 is not following ∆T

beckleybud@gmail.com
Reply to  knr
October 4, 2014 7:40 pm


..
Your own chart ..
http://www.woodfortrees.org/plot/rss/from:1997/plot/rss/from:1997.9/trend/plot/esrl-co2/from:1997.9/normalise/offset:0.68/plot/esrl-co2/from:1997.9/normalise/offset:0.68/trend

Proves that CO2 does NOT follow temperature.
The chart shows temperature dropping and CO2 rising.
..
When ∆T is negative and ∆CO2 positive, it’s obvious that ∆CO2 is NOT FOLLOWING ∆T

Thanks for proving my point !!

Reply to  knr
October 4, 2014 8:55 pm

Yo, buddy,
I was beginning to think you were just giving me a hard time. Now it appears that you’re simply confused.
You say:
None of your “charts” show the current CO2 level of 400 ppm.
So? They show that CO2 follows T — something you deny, even though it is staring you in the face.
And:
None of your charts show the temperature RISE that should allow the CO2 to FOLLOW the temp change.
Again: So what? They show causation: T causes CO2, not vice-versa.
If it were not for your constantly moving the goal posts, we could conclude this discussion. But as soon as I hold your feet to the fire, you re-frame your argument. That is disingenuous. You lost the original argument, and I have no interest in chasing your ever-morphing arguments all over the thread. You simply cannot hold one thought in your head from one comment to the next.
Next, you say that my last chart:
Proves that CO2 does NOT follow temperature.
Yo, Buddy! I told you right above here:
…the chart you just posted is simply a variant of this chart. The reason I didn’t use it is because it is a simple OVERLAY. It does not show cause-and-effect, like the others I posted. It was never intended to show cause and effect. It was intended to show you that your chart was nothing but an overlay.
Finally, when I posted that there has been no global warming for almost twenty years, even the most dense readers here know that what is meant by that is the fact that global T is now the same as it was 18 years ago. It does not mean that temperatures have been in an unmoving stasis for 18 years. It means that global T is not rising. Everyone but you seems to get that.
Come on back when you get up to speed on the subject.

beckleybud@gmail.com
Reply to  knr
October 4, 2014 9:32 pm


You can provide 2,500 charts and pieces of evidence in support of your hypothesis.
All I need is one counterexample to falsify it.
Your hypothesis that ∆CO2 follows ∆T has been falsified.
The evidence is in the past 18 years.
∆T is zero for the past 18 years, while ∆CO2 is 36 ppm.

IF ∆CO2 followed ∆T, ∆CO2 would be zero in the past 18 years, since ∆T for the past 18 years has been zero.
.
That’s how science works. Time for you to find a hypothesis that cannot be falsified.

Reply to  beckleybud@gmail.com
October 6, 2014 12:58 pm

No, all you have done is show your inability to grasp what temperature has done in the last 18 years.
it has NOT remained static. It has gone up and down, but the AVERAGE is a zero trend.
Only someone living in the tropics would be so foolish as to deny temperature changes.

beckleybud@gmail.com
Reply to  knr
October 4, 2014 9:47 pm


..
You posted ” They show causation: T causes CO2, not vice-versa. ”

Please show me the change in T in the past 18 years that CAUSED the 36 ppm rise in CO2 that occurred in the past 18 years.

Reply to  knr
October 5, 2014 3:27 am

Since you said “please”…
First, I already gave you charts showing the cause. There is no reasonable dispute about that; charts based on raw data do not lie.
The general answer to your question is that if we had all the answers, we could move on to something else.
One possibility for you to consider is this:
There is extensive evidence that ∆CO2 results from changes in temperature up to ≈800 years prior. Eight hundred to 1200 years ago was the approximate time of the MWP. Thus, the current overall rise in CO2 is likely due to global warming during the MWP. I have charts showing that specific cause and effect.
CO2 also reacts on shorter time scales. I have charts of monthly cause and effect between ∆T and CO2. It happens on time scales from months to hundreds of years. Even small fluctuations in T cause subsequent fluctuations in CO2.
Just like a warming Coke outgases CO2, a warming ocean emits CO2, per Henry’s Law and Beer’s Law. The fact — as shown in numerous instances — is that ∆CO2 follows ∆T, on all time scales. But I have found no charts showing the reverse despite much searching. There is no dispute about which comes first; it is an empirical fact that on all time scales, T leads CO2. The conclusion is what matters.
Since changes in CO2 follow changes in temperature, global warming will produce a rise in atmospheric CO2. That is what we are observing. The great mistake of the climate alarmist crowd was to mistakenly assume that it was CO2 causing a rise in temperature, when in fact it was a rise in temperature causing a rise in CO2. They got their causation backward, and it has led them down the wrong path ever since.

Reply to  dbstealey
October 5, 2014 6:32 am

Whenever CO2 lagged warming, CO2 & water vapor were positive feedback to an initial warming due to their physicochemical properties. Thus after an initial solar forcing (Milankovitch cycle),  the resulting warming was amplified by the release of GHG (increased humidity and ocean CO2 degassing) from the oceans. The fact that the initial solar forcing alone could not explain the relatively sharp rise in global temperature shows that the GHG effect is significant.
However, there are also examples of paleoclimate change that was caused by a sudden release of GHG, which caused a warming that is further amplified by increased water vapor. An example is the PETM extinction event that resulted in a temperature 6K over 20,000 years (0.8 K over 2667 years). By comparison, anthropogenic emissions (~2000 Gt of CO2) have caused a warming of 0.8 K within just a century. 
“The PETM has become a focal point of considerable geoscience research because it probably provides our best past analog in which to understand impacts of global warming and massive carbon input to the ocean and atmosphere, including ocean acidification.”
http://en.m.wikipedia.org/wiki/Paleocene–Eocene_Thermal_Maximum#Evidence_for_carbon_addition
Hanzo

beckleybud@gmail.com
Reply to  knr
October 5, 2014 6:01 am


..
Absent a graphic that shows the ∆T that CAUSED the ∆CO2 in the past 18 years, your hypothesis has been falsified. No amount of spin will change the fact that you don’t have the data to prove your hypothesis. You have repeatedly said that “global warming has stopped.” Monckton shows us that this has happened for the past 18 years. ∆T is zero for the past 18 years.
..
∆CO2 for the past 18 years is 36 ppm.
..
These two data points prove that ∆CO2 does not follow ∆T.
..
If the “pause” continues as it is doing, and CO2 continues to rise, you seriously need to toss your claim out.
..
Obviously SOMETHING ELSE BESIDES TEMPERATURE IS MAKING CO2 RISE

Reply to  knr
October 5, 2014 12:49 pm

BuddyB says:
“∆CO2 does not follow ∆T.” <–that, despite a mountain of evidence showing conclusively that CO2 does, in fact, follow T.
The IPCC's sensitivity number has been steadily ratcheted down, until now it is in the ballpark first put forth by Prof Richard Lindzen a long time ago. Originally the sensitivity was supposed to be ≈3 – 6ºC. When the planet itself debunked that preposterous number, the IPCC's climbdown began.
Now it has been 10 – 18 years [or more] of no global warming, depending on the database used. Any rational person who is not emotionally invested in the debate would look at that, and conclude that CO2 has no measureable effect. Only those whose egos, or whose jobs are dependent on the 'carbon' narrative still cling to the belief that CO2 will cause runaway global warming. So common sense is beginning to prevail.
Where are the measurements showing the fraction of a degree of global warming putatively caused by human emissions, out of the total global warming of ≈0.7ºC? Quantify the part of that warming which is caused by human activity. That is a challenge. Up to now, AGW has amounted to nothing more than an assertion. We need measurements.
Any physical process can be quantified and measured. [Any other processes are under the purview of witch doctors. So, please, no juju; no "what-ifs", no computer models, and no opinion papers. Verifiable, quantified measurements are necessary. But strangely, I have been able to find no such measurements.]
Please post quantified, testable, empirical measurements, showing just how much global warming is caused by human CO2 emissions. If you can. That should be easy peasy — if human-caused global warming is enough to be measureable. I say it is not.
I have posted reams of links showing conclusively that ∆CO2 is caused by ∆T. I have challenged Buddy to post any chart he can find, showing the reverse: that CO2 drives temperature. [I would use the *crickets* analogy here, but it is over-used.]
No one has ever been able to post any verifiable evidence showing that a rise in global T is caused by CO2. All we ever get are overlay charts, where the rise in CO2 is overlaid on top of a temperature chart. But that does not show cause-and-effect.
Buddy’s response: “Nuh-uh! No way! None of that counts! Uh uh.”
I was willing to take beckleybud seriously, and discuss the issue with him. But because of his response, he is wearing me down. So at this point, my reply is:
Pff-f-f-ft.
Find a wacko to argue with, buddy. Arguing with you isn’t worthwhile to me. Maybe another time.

beckleybud@gmail.com
Reply to  knr
October 5, 2014 1:24 pm


..
You posted, ” I have posted reams of links showing conclusively that ∆CO2 is caused by ∆T ”

And I have falsified your claim. I’m still waiting for you to post evidence that ∆T has caused ∆CO2 IN THE PAST 18 YEARS”

You posted: ” I already gave you charts showing the cause. ” except you have not posted one for the past 18 years.
..
You posted, “CO2 also reacts on shorter time scales. I have charts of monthly cause and effect between ∆T and CO2.” …….OK, so lets see the one that shows the past 18 years.
..
We have had ∆T equal zero in the past 18 years.
We have had ∆CO2 equal to 36 ppm in the past 18 years.
..
Your claim has been falsified.

Reply to  beckleybud@gmail.com
October 7, 2014 12:04 pm

No, you just have a one dimensional mind.
He never said the lag was INSTANTANEOUS.

Reply to  knr
October 5, 2014 1:47 pm

Buddyb sez: [” … “]
And I repeat:
Pff-f-f-ft.
Your single-minded, reality impaired assertions make you look like a lunatic. All you do is emit pixels — while I post verifiable, empirical, testable facts. You wouldn’t know a scientific fact if it bit you on the a… nkle.
Someone on the Sou thread wrote:
If there was a revolt in the climate science community and they collectively admitted that the anthropogenic portion of global warming and climate had been grossly overblown, the Miriams of this world would still argue.
The science community collectively admits that CO2 follows global T. But you still argue like a tedious lunatic, despite being repeatedly shown that your crazy world view is flat wrong. I think I know the reason:
For some reason, you are fixated on me. Or at least, on my posts. You are unable to decouple. I’m not a psychiatrist, but I am sure there’s a label for your malady. Your On/Off switch is permanently wired around, so it is always On.
Since you cannot accept the numerous charts from many different sources that I posted — all of them showing conclusively that CO2 follows temperature on all time scales out to hundreds of thousands of years — then maybe your health plan covers your affliction. I can’t help you. It is impossible to educate you.
As I said before, I give up. Your logic-free mind has worn me down. You win. I can’t compete with crazy. So now, will you please go away? Then I can have a rational discussion with others.

beckleybud@gmail.com
Reply to  knr
October 5, 2014 2:00 pm


Fact #1 ∆T for the past 18 years is zero.
Fact #2 ∆CO2 for the past 18 years is 36 ppm

These two facts taken together falsifies your claim that ∆CO2 follows ∆temperature.

You have yet to produce a chart that shows T versus CO2 in the past 18 years.

You are displaying the behavior of a person desperately clinging to a “religious belief.” in the face of FACTS that prove your assertion false. You need to adhere to the scientific method and abandon your falsified claim.
Since ∆T is zero for the past 18 years , and ∆CO2 is 36 ppm for the past 18 years, something other than temperature has caused CO2 to rise in the past 18 years.

It is amusing to see facts and logic wear you down. It’s fun to post facts that you are unable to dispute. You need to abandon your falsified claim. The problem is you are incapable of disputing the two facts I have presented at the top of this post.

Reply to  knr
October 5, 2014 2:13 pm

Buddy,
Take your nuttiness elsewhere. You are fixated, and it’s not healthy. Unhook your On switch. Your view of reality is upside down.
Look at this [for whatever good it will do]:
http://www.woodfortrees.org/plot/rss/from:1997/plot/rss/from:1997.9/trend
Can you see the ≈0.9º spread between low and high T? If so, good.
That means that while there has been no global warming from 1997, global T has fluctuated by about 0.9º.
Next, you say:
You have yet to produce a chart that shows T versus CO2 in the past 18 years.
Since you are crazy, this chart will mean nothing to you; your mind is made up and closed tighter than a submarine hatch.
But other readers can clearly and easily see that it covers the past 18 years, and they see that it clearly shows the cause-and-effect of T/CO2: ∆T causes ∆CO2.
It is not a simple overlay, like this chart:
http://www.woodfortrees.org/plot/hadcrut4gl/from:1958/to:1977/plot/hadcrut4gl/from:1958/to:1977/trend/plot/esrl-co2/from:1958/to:1977/normalise/plot/esrl-co2/from:1958/to:1977/normalise/trend
Rather, the first chart conclusively shows causation.
So do these charts:
http://theinconvenientskeptic.com/wp-content/uploads/2010/09/Vostok-CO2.png
And:comment image
They all show causation: ∆CO2 follows ∆T.
From your past comments, I know you are not capable of understanding any of that. But for the benefit of other readers, that is plenty of empirical evidence — compared with your baseless opinion.
…and you know what they say about opinions…

beckleybud@gmail.com
Reply to  knr
October 5, 2014 2:29 pm

.

It’ is time to educate you. You posted a link to this chart. http://www.woodfortrees.org/plot/esrl-co2/isolate:60/mean:12/scale:0.26/plot/hadcrut3vgl/isolate:60/mean:12/from:1958
..
You don’t know what the “isolate” function on WFT does. Here is a description of what it does.
“Does the same running mean as ‘mean’, but then subtracts this from the raw data to leave the ‘noise'”

You are ignorant of what the graph is saying. You have used a function that de-trends the data. Comparing the “noise” of one data item to the “noise” of another data item ignores the trends. ( http://www.woodfortrees.org/help )
..
That chart does not show cause and effect. It shows that the noise in T and the noise in CO2 are simiilar.

Your other graph shows the disconnect between temperature an CO2. It does not show causation, but it does show that your claim of ∆CO2 follows ∆T is incorrect.
..
http://www.woodfortrees.org/plot/rss/from:1997/plot/rss/from:1997.9/trend/plot/esrl-co2/from:1997.9/normalise/offset:0.68/plot/esrl-co2/from:1997.9/normalise/offset:0.68/trend

That chart PROVES your claim of causation is bogus.

beckleybud@gmail.com
Reply to  knr
October 5, 2014 2:49 pm
Reply to  knr
October 5, 2014 4:53 pm

Beckley Bud,
As I said, I’m no longer commenting in order to teach you anything. It is not possible to educate you; your mind is closed. This is for other readers who may be interested in verifiable, testable facts.
So far, in this thread alone I have posted eight or nine different charts, from the past 18+ years out to hundreds of thousands of years, and every one of them shows exactly the same thing: ∆T causes ∆CO2. This occurs on all time frames, from years to hundreds of millennia.
There are no exceptions that I am aware of, which show the reverse causality. Despite my numerous requests, neither buddy nor anyone else has ever posted a chart showing that changes in CO2 are the cause of subsequent changes in global temperature. That claim is nothing but an assertion.
buddy b is continually nitpicking whatever he believes will “falsify” or “debunk” my well-documented position. As usual, he has failed, and failed miserably: all he has are words. No verifiable facts. No charts showing his imagined causation.
buddy’s last chart shows how out to lunch he is. It is only a chart of atmospheric CO2 on Mauna Loa, nothing more. It says nothing whatever about global temperature, or what causes changes in temperature. It is just more impotent rambling by someone who lost the debate a long time ago.
Now, if buddy can do one of two things, I will sit up straight and pay attention:
First, he needs to produce a verifiable, cause-and-effect chart showing that temperature rises are caused by rises in CO2. I have repeatedly asked for such a chart, but buddy goes off on his own tangents, and never produces one. That is because he cannot produce such a chart.
Second, I will start to look closely if buddy produces testable, verifiable measurements, showing the specific quantity of human-caused global warming. Either a fraction of a degree quantity, or a percentage of total global warming. Either one would be fine.
But so far, neither ‘b. bud’ nor anyone else has ever been able to produce either of those things. What does that mean?
That means that the AGW conjecture has no verifiable, empirical measurements to support it. Thus, it is simply a baseless conjecture.
Now, a conjecture is legitimate in science. It is the first step in the hierarchy: Conjecture, Hypothesis, Theory, Law. I personally think that CO2 has a small warming effect. But that effect is too small to measure with current instruments. So for all practical purposes, the AGW conjecture is merely speculation. Anyone wanting to prove otherwise needs to produce measurements.
And I’m still waiting for buddyb, or anyone else, to produce a chart showing that a rise in CO2 causes global temperature to rise. Because that is the assertion.
I produce evidence. Testable, verifiable, quantifiable evidence; charts that record real world observations. But all buddy and hanzo produce are… words. That’s all.
But their assertions are not nearly good enough.
If Buddy produces one or both of the items I requested above, he will regain his absent credibility. But emitting more words does nothing. Baseless words are not convincing. Only real world facts and observations are convincing. That is why the global warming scare is falling apart: Planet Earth flatly contradicts it.

beckleybud@gmail.com
Reply to  knr
October 5, 2014 6:37 pm


..
Just one. One little chart. Start the chart at 1996, and make it go up until today. Show temperature. Show the ∆T that caused the 36 ppm of CO2 increase in the past 18 years.
..
Come on [Snip ~mod.], you can do it. You said ∆T causes ∆CO2. Show all of us the ∆T in the past 18 years that CAUSED the increase of 36 ppm of CO2 in the air.

Was the ∆T in the oceans? Did you discover the “missing heat????” Did the ∆T hide under the ice in Antarctica? Where is it? Please, we need to know where the cause of the past 18 years of CO2 increase is.

Better go through your charts and find that missing ∆T.

beckleybud@gmail.com
Reply to  knr
October 5, 2014 6:45 pm

.

PS….when you find that missing ∆T that is the cause of the 36 ppm rise in CO2, please send an email to Monckton. He says that ∆T for the last 18 years is zero….
..
http://wattsupwiththat.com/2014/10/02/its-official-no-global-warming-for-18-years-1-month/

Reply to  knr
October 5, 2014 6:56 pm

B buddy,
You are a worse pest than a Jehovah’s Witness. You will never convert me to your mindless nonsense. Look at all your endless posts. Who wouldn’t be fed up with your 5th grade silliness? Now you’re doubling up on your comments!
There are blogs that cater to religious fanatics. You really belong on one of those, not here.
Wake me if you ever decide to respond to one of my specific questions or challenges. Otherwise, take your CAGW religion elsewhere. Pester someone else. I’m tired of your irrational pseudo-science.
In the mean time, try to understand this: the charts I posted show conclusively that CO2 follows temperature…
…oh, just forget it. You can’t understand those charts.

beckleybud@gmail.com
Reply to  knr
October 5, 2014 7:03 pm


What’s the matter? Can’t produce the data? You said you based all your posts on hard data. Just post the data for the past 18 years that shows the ∆T that CAUSED the ∆CO2 of 36 ppm.

Prove it…just post the chart. Don’t try and pass off the “isolate” chart that plots noise. Just temperature data.

I’m not trying to “convert” you to anything. I’m just challenging you to post the data that proves your “claim.”
..
You do know in science, you have to be able to produce the data that supports your hypothesis. Where is your data? I need to see the ∆T in the past 18 years. Show us all the ∆T that was the cause of the 36 ppm CO2.

Reply to  knr
October 5, 2014 7:52 pm

buddybeckley says:
You do know in science, you have to be able to produce…&blah, blah, etc.
What would you know about science?? From your comments, the answer is: nothing.
Your side has been claiming that CO2=CAGW. That is your conjecture. Skeptics don’t have a conjecture. Our job is to try and falsify conjectures. Whatever is left standing after all attempts at falsification fail is considered currently accepted science.
Therefore, you have the onus of supporting that conjecture. But you have failed. Repeatedly. Totally. Global warming has stopped. As you admit, it stopped a long time ago. Thus, your conjecture has been falsified by the only authority that matters: Planet Earth.
Scientific skeptics have nothing to prove. But as usual, the alarmist cult tries to turn the Scientific Method on it’s head, and that is exactly what you are impotently attempting here. Skeptics have nothing to prove, bud. The onus is completely on the alarmist clique:
Ei incumbit probatio, qui dicit, non qui negat; cum per rerum naturam factum negantis probatio nulla sit. — ‘The proof lies upon him who affirms, not upon him who denies; since, by the nature of things, he who denies a fact cannot produce any proof.’
Therefore, as to the hypothesis that human-emitted CO2 is causing “unprecedented” global warming: the onus lies on those who say so. That’s you.
As to the proposition that there has been an alarming twentieth-century spike in global temperatures: the onus lies on those who say so. That’s you.
Skeptics merely question your climate alarmism — and you have shown that you have no credible response.
Scientific skeptics [the only honest kind of scientists] question your CO2=CAGW conjecture. That is the job of skeptics. So the onus is on you, pal. CO2=CAGW is yours to prove. And you know what? You have failed miserably in proving anything of the sort.
So now you are trying to turn the Scientific Method on it’s head, and demanding that skeptics must prove what is, in effect, a negative. It doesn’t work that way, bud. No wonder you’re so confused. You know nothing of the Scientific Method, or of the climate Null Hypothesis, or of Occam’s Razor. From the lack of knowledge you exhibit here, I would be very surprised if you had any more than a high school degree. You just don’t understand much.
And once again, you hide out from trying to answer my questions, or reponding to my challenges. I’ll give you another chance to fail, since you are so good at that:
a) Produce a verifiable, testable, cause-and-effect, real world chart, showing that temperature rises are the result of rises in CO2. So far, I am the only one producing T/CO2 charts showing cause-and-effect — and I’ve posted a lot of them.
b) Produce testable, verifiable measurements, showing the specific quantity [either in fractions of a degree, or in a percentage of total global warming] of human-caused global warming.
Once more, since you still don’t understand: skeptics do not have a global warming hypothesis. We are questioning your CO2=CAGW conjecture [which cannot be a hypothesis, since AGW has failed to make any accurate predictions]. But you always tuck tail and run away from trying to defend your globaloney. That’s not surprising, because CAGW is indefensible.
Finally, your juvenile infatuation with one part of one of the many charts I posted, is just your way of avoiding the questions above. I have posted plenty of charts, and they decisively falsify your conjecture. So why are you fixated on just one part of one chart? Your argument about that one chart, such as it is, is nonsense anyway. It clearly shows cause-and-effect. That is enough to refute your belief. Noise has nothing to do with which is the cause, and which is the effect.
Finally, your question: “where is the hidden heat?” is the skeptics’ question to the alarmist cult. That is the very same question skeptics have asked here repeatedly of Kevin Trenberth, for the past several years. So now you play the chameleon, and pretend that the question applies to skeptics. Listen up: it doesn’t. That is the question we have been asking of the alarmist cult all along. But you cannot find that ‘hidden heat’. skeptics know this: it isn’t there.
Wise up, bud. Read the WUWT archives [keyword: CO2] for a few months. You really do have a lot to learn, because you are far from being up to speed on the subject.

beckleybud@gmail.com
Reply to  knr
October 6, 2014 4:48 am


..
I know enough about science to see that you are incapable of backing up your assertion that CO2 follows temperature in these past 18 years. I know enough science to recognize the fact that you lack the evidence that in the past 18 years with zero temperature change CO2 has risen.
..
This is not about “sides.” This is me holding your feet to the fire and watching you fail. You’ve been caught making a claim which you cannot back up with data.
..
You post: “Scientific skeptics have nothing to prove.” but you do have to “prove” your claim that CO2 follows temperature in the past 18 years. If you are unable to prove it, you must stop making your baseless claim.

Produce the chard, the data, your evidence that in the past 18 years, CO2 has followed temperature. You can’t. You’ve failed. ∆T is zero for the past 18 years. ∆CO2 is 36 ppm for the past 18 years. These two facts falsifies your claim that CO2 follows temperature.
..
Real science can explain where this CO2 is coming from. Even you know where it is coming from. Too bad you can’t face reality.

Reply to  knr
October 6, 2014 5:20 am

I know enough about science to see that you are incapable of backing up your assertion that CO2 follows temperature in these past 18 years.
OBVIOUSLY you know nothing about science, or the Scientific Method, or how to read a simple chart. The numerous charts I posted show conclusively that CO2 follows temperature. You are the only jamoke here who says it doesn’t, despite the real world evidence staring you in the face. Everyone else can clearly see the cause-and-effect displayed in the numerous charts I posted. Everyone, except you.
Take your nonsense to Hotwopper, or Skepticalscience [same-same]; they love the stupid things you post. Here, wackos who can’t read simple charts are only good for amusement.
It is really astonishing, if you actually do believe the nonsense you write. No one can be that stupid, and your lack of formal education is no excuse. The answer can only be that you are borderline insane.
Heck, did I just say ‘borderline’? Strike that. You are batshit crazy, a real nutcase. No one takes you seriously, least of all me. But I must say, I do enjoy pointing out how deluded you are. You’re at the end of a long, long tail on the wrong end of the curve.
Take this good advice: start reading the archives, keyword: “CO2”. Get up to speed. Learn something, instead of displaying your psychopathic ignorance. Learn to read a simple chart. And quit fixating on me. It’s unhealthy. Normal people don’t do that.

beckleybud@gmail.com
Reply to  knr
October 6, 2014 5:31 am


..
I can read a chart. All you need to do is provide one that shows temperature versus CO2 for the past 18 years. The scientific method requires you to dispose of a hypothesis when it has been falsified. Your “CO2 follows temperature” has been falsified by the EVIDENCE of these past 18 years.

Explain why in the past 18 years temperature rise has been zero, yet CO2 has risen 36 ppm. That’s not “following”….. What is the cause of the CO2 rise? Can’t be temperature, because there hasn’t been a rise in temp in the past 18 years.
..
Time for you to formulate a new hypothesis.

richardscourtney
Reply to  knr
October 6, 2014 6:13 am

beckleybud@gmail.com
I have no intention of again getting locked-in by your lunatic idiocy, which is clearly intended to troll any thread from its subject.
However, one of your egregious falsehoods is so blatant that it needs to be addressed.
You assert to dbstealey

I can read a chart. All you need to do is provide one that shows temperature versus CO2 for the past 18 years. The scientific method requires you to dispose of a hypothesis when it has been falsified. Your “CO2 follows temperature” has been falsified by the EVIDENCE of these past 18 years.
Explain why in the past 18 years temperature rise has been zero, yet CO2 has risen 36 ppm. That’s not “following”….. What is the cause of the CO2 rise? Can’t be temperature, because there hasn’t been a rise in temp in the past 18 years.
Time for you to formulate a new hypothesis.

That is yet another proclamation by you that you are an idiot. There has been no rise in temperature over the last 18 years but that is NOT the same as saying there have been no changes in global temperature during the last 18 years.
Your post is a blatant attempt to revert the thread back to before here where in this thread dbstealey provided you with what you ask for.
He there wrote saying to you

Since you are crazy, this chart will mean nothing to you; your mind is made up and closed tighter than a submarine hatch.
But other readers can clearly and easily see that it covers the past 18 years, and they see that it clearly shows the cause-and-effect of T/CO2: ∆T causes ∆CO2.

Also, in that same post dbstealey shows you that at longest time scales ∆CO2 follows ∆T by 800 years. The “past 18 years” is less than 800 years and ∆T has been rising from the Little Ice Age (LIA) for centuries.
Those two graphs completely refute your mad assertions, and the only available explanation for your demanding that dbstealey again provide them is that you are “crazy”.
Richard

beckleybud@gmail.com
Reply to  knr
October 6, 2014 7:48 am

Courtney
..
You just like Mr Dbstealey are making the same mistake with this chart: http://www.woodfortrees.org/plot/esrl-co2/isolate:60/mean:12/scale:0.26/plot/hadcrut3vgl/isolate:60/mean:12/from:1958

I suggest you read up on what the WFT help page says the “isolate” function does to a data set.
..
http://www.woodfortrees.org/help It says: “Isolate……. Does the same running mean as ‘mean’, but then subtracts this from the raw data to leave the ‘noise'”

That chart is comparing noise to noise. It’s been de-trended.

richardscourtney
Reply to  knr
October 6, 2014 8:29 am

beckleybud@gmail.com
Firstly, thankyou for the laugh you gave me by you suggesting I should “read up”.
Secondly, I want it to be clear that I am only answering your trolling so onlookers are informed that your nonsense is not being ignored. However, I would not want you or any other to be unaware of my great distaste at interacting with you.
Thirdly, your point about detrending is wrong. It seems you don’t know what noise is (although you make a lot of it).
Fourthly, you have conveniently forgotten to mention the ~800 year lag which completely demolishes the idiocy you spouted.
Richard

beckleybud@gmail.com
Reply to  knr
October 6, 2014 8:39 am

@ Mr. Courtney.

Not only should you learn what the “isolate” function is at the WFT web site, I suggest you also read Mr. Dbstealey’s post……
..
http://wattsupwiththat.com/2014/10/02/its-official-no-global-warming-for-18-years-1-month/#comment-1754939
..
Where he says…..“CO2 also reacts on shorter time scales. I have charts of monthly cause and effect between ∆T and CO2.”

I have been asking him for an 18 year chart that shows T versus CO2, and he has yet to respond. This discussion has nothing to do with your “800 year” deflection.

beckleybud@gmail.com
Reply to  knr
October 6, 2014 8:44 am

@ Mr Courtney
..
PS….. 800 years ago the MWP ENDED …so please explain to us all how FALLING TEMPS at the end of the MWP is causing a rise in CO2 TODAY

richardscourtney
Reply to  knr
October 6, 2014 9:03 am

beckleybud@gmail.com
You clearly have as much difficulty with memory as you do with reading comprehension.
In response to my writing to you

you have conveniently forgotten to mention the ~800 year lag which completely demolishes the idiocy you spouted.

you have replied

This discussion has nothing to do with your “800 year” deflection.

That is a lie.
In his first reply to you where he first gave you the 18-year plot (which you pretend he has not provided for you) he also posted two graphs titled “CO2 follows Temperature Change” and “Vostock ice core” which each shows the ~800 year lag.
That post is here.
Now please scrape up enough decency for you to clear off.
Richard

beckleybud@gmail.com
Reply to  knr
October 6, 2014 9:12 am

@ Mr Courtney…
..
Yes, the charts clearly show that the MWP ended 800 years ago. You can tell it ended by the DROP in temperatures. So, tell me why is CO2 RISING today, 800 years after they dropped?

Reply to  knr
October 6, 2014 10:08 am

The problem with this debate is that the abstract construct we call climate is a function of an indeterminate number of variables. The concentration of carbon dioxide in the atmosphere is only one factor of unknown relative contribution. Climate always changes because the variables always change.
If you heat water that includes dissolved CO2, some of it comes out of solution, and we know the oceans have been warming for more than 12 thousand years. If you add CO2 to the atmosphere some of it goes into solution, and we know we are adding CO2 to the atmosphere. Both are occurring, but so are many other changes. No one knows how the climate would change if humans did not burn hydrocarbons. This is why Dr. Judith Curry calls this a wicked problem.
Over most of the Earth, the changing atmospheric concentration of carbon dioxide is a very minor variable contributing to climate change. Natural sources of CO2, including the oceans, overwhelm anthropogenic sources, and water overwhelms all sources of CO2 in its impact on climate or climate change. The fact that global temperature has not increased in 15 to 25 years has very little to do with carbon dioxide.
In the past, humans adapted to climate change. I expect we will continue to do so.

richardscourtney
Reply to  knr
October 6, 2014 10:25 am

beckleybud@gmail.com
I am going to provide some concepts so this will be hard for you to understand.
Firstly. ~800 years does not mean exactly 800 years. This is because “~” means “approximately” so ~800 years could be 900 years or 600 years.
Secondly, the temporal resolution of ice cores is decades because the fern takes decades to seal (the IPCC says 83 years).
I know this is hard for you to understand but it is simply true that these two facts make your assertions plain wrong.
Your grasping why these facts make your assertions plain wrong requires that you understand that 18 years is less than 200 years and that you are capable of subtracting one number from another, so I have no hope that anybody can explain it to you.
Richard

beckleybud@gmail.com
Reply to  knr
October 6, 2014 10:38 am

@ Mr Courtney
..
Excellent point. So, according to you the MWP ended 900 years or 600 years ago. So, tell me two things. First, since the MWP was ending how come CO2 isn’t going down? I thought you were trying to prove that CO2 follows temp?

Secondly, and most importantly, can you posit a mechanism that is causal for the 600/700/800/900 year time period? Or are you merely using “correlation” as a causal explanation?

Reply to  knr
October 6, 2014 10:44 am

docstephens,
You are correct when you say that CO2 has very little effect [“…a very minor variable…”]. I am still waiting for someone to post a measurement showing just how much of an effect CO2 has. But despite my repeated requests, no one seems able to post any measurements. Any physical process of sufficient amplitude can be measured and quantified, so why won’t they post one?
The reason is simple: there are no such measurements. Warming due to human-emitted CO2 is simply too small to measure with current instruments. But if that one fact was admitted by the alarmist industry, their entire argument would collapse. Because the public is not going to pay to fix something that is too small to measure, and which has no discernable effect. So they always fall back on their baseless, measurement-free assertions.
Or, like beckleybud, they deliberatly try to confuse the issue: the lieist is still posting nonsense and confusion here. He is now cutting and pasting his previously debunked comments, as if that could make them legit:
Explain why in the past 18 years temperature rise has been zero, yet CO2 has risen 36 ppm. That’s not “following”…
Is beckley insane? He apparently cannot understand that the question is:
what came first: temperature, or CO2?
The temperature “rise” has nothing to do with it. Rational folks here are discussing cause-and-effect, which clearly shows that ∆T is the cause, and ∆CO2 is the effect. That has been shown on all time scales, from 18 years to hundreds of thousands of years, and it is always the same: ∆CO2 is caused by ∆temperature. Not vice-versa. [Not measurably, anyway.]
But if the alarmist crowd admitted that verifiable, empirical and well established fact, their argument would be completely deconstructed. Because they have always argued that a rise in human-emitted CO2 will cause runaway global warming.
Now they are being ridiculed, because the ultimate Authority — Planet Earth — is showing them that they are flat wrong: global warming stopped many years ago. The reason is simple: they got causation wrong. They got it backward. They thought a rise in CO2 would cause measurable global warming, but it hasn’t. Reality is that a rise in temperature has caused the rise in CO2. Just like a warming Coke outgases CO2, oceans warming from the LIA outgas CO2. Simples.
So they obfuscate. That is what buddy B is doing. He is either deliberately insisting on confusing the facts, or he is simply nuts. It is getting harder and harder to tell. At first I though he was deliberately misunderstanding, as a rhetorical tactic. But now I’m not so sure…

richardscourtney
Reply to  knr
October 6, 2014 10:47 am

beckleybud@gmail.com
No. I told you that I cannot explain it to you because it requires subtracting one number from another and that is clearly beyond your intellectual capability.
Please stop wasting space on the thread with your nonsense.
Richard

beckleybud@gmail.com
Reply to  knr
October 6, 2014 10:49 am


..
You post: “That has been shown on all time scales, from 18 years, ”

No, you have yet to post the T versus CO2 chart for 18 years. The chart you passed off as 18 years is a comparison of noise with noise (as per the definition on WFT for “isolate” )

Please post a T vs CO2 for the past 18 years.

beckleybud@gmail.com
Reply to  knr
October 6, 2014 10:54 am

Courtney
..
Subtracting one number from another number is not a physical mechanism. Do you need me to explain to you what a “physical mechanism” is? For example Henry’s Law or Beer’s Law would be considered a “physical mechanism” except that the two laws I just mentioned do not have a 600-900 year delay built into their equations.

What causes the 600-900 year delay?

Reply to  knr
October 6, 2014 11:13 am

It gets tedious for everyone to scroll up and down, so I’ve made my latest reply under Richard M’s below.

richardscourtney
Reply to  knr
October 6, 2014 11:16 am

beckleybud@gmail.com
I was politely informing you that I have no interest in further interaction with you because you make short planks look intelligent.
I often interact with trolls because it is a useful way to inform onlookers. In your case I have learned that your pretense of idiocy is so great that any interaction with you is a total waste of time. As I told you in another thread, I refuse to believe you are as stupid as you pretend to be. I am convinced that your pretense of stupidity is merely an offensive ploy to disrupt threads.
Richard

beckleybud@gmail.com
Reply to  knr
October 6, 2014 11:47 am

@ Mr Courtney
..
If it is true as you say that you have no way to explain the 600-900 year lag, then say so. It’s OK to admit you can’t explain something, as much as it might bruise your ego doing so.

If you have no interest in interacting, then I suggest you stop replying. Each reply you post is a display of your desperate need to interact.

beckleybud@gmail.com
Reply to  knr
October 6, 2014 11:54 am


..
If you don’t know how to use the internet, then you need to learn about “bookmarks” for your browser. They are a predominant feature that many people use to relieve themselves of “tedious” operations.
..
Since you are unable to explain the 600-900 year delay, please stop using “correlation” as a causal explanation. If you want to use correlation as an explanation, I can show you how the rise of CO2 correlates with the rise in temperature of the past 100-150 years.

You post: “First, temperature changed. Then, CO2 followed. ”

Please tell us what happens when temperature stays constant like it has for the past 18 years.

beckleybud@gmail.com
Reply to  knr
October 6, 2014 12:13 pm


..
Here you go

Now you post your 18 year chart of T versus CO2

beckleybud@gmail.com
Reply to  knr
October 6, 2014 12:15 pm


..
As per your request
.
http://decarboni.se/sites/default/files/imagecache/620xH/publications/22562/advanced/fig01.jpg

Now you post the T versus CO2 for the past 18 years.

Reply to  beckleybud@gmail.com
October 7, 2014 1:42 pm

Congratulations! You proved yourself a liar and wrong with one graph.
Now show us the graph from the last 800k years.

Richard M
Reply to  Gareth Phillips
October 3, 2014 7:20 am

The other critical point is that the temperature rose, but it did not go down over the last eighteen years, it has levelled off.
Not quite true. If you break the data at the point the PDO went negative you’ll see the flat trend is actually an end to warming and the beginning of cooling.
http://www.woodfortrees.org/plot/rss/from:1996.66/plot/rss/from:1996.66/to:2005/trend/plot/rss/from:2005/to/trend

Reply to  Richard M
October 6, 2014 11:11 am

Buddybeckley says:
What causes the 600-900 year delay?
Good question, which a lot of reasearchers are investigating. But it has nothing to do with the discussion of: what came first, CO2 or temperature?
First, temperature changed. Then, CO2 followed. You cannot understand that simple fact. But everyone else seems to understand it.
Go read the WUWT archives, until you have a grasp of the issues. Right now, you don’t.

Reply to  Richard M
October 6, 2014 12:04 pm

BuddyB says:
I can show you how the rise of CO2 correlates with the rise in temperature of the past 100-150 years.
Please do. This should be good, if your prior comments are any indication.
And:
Please tell us what happens when temperature stays constant like it has for the past 18 years.
That comment just goes to show: You can’t fix stupid.

richardscourtney
Reply to  Richard M
October 6, 2014 12:31 pm

dbstealey
In response to beckleybud@gmail.com having written the outrageously daft statement

Please tell us what happens when temperature stays constant like it has for the past 18 years.

you said

That comment just goes to show: You can’t fix stupid.

You are right, of course. However, I am convinced that this particular troll is pretending to be stupid as a wind-up to disrupt threads.
He/she/they/it makes ludicrously daft comments such as “when temperature stays constant like it has for the past 18 years” knowing the comments are so outrageously wrong that any response drags discussion down Alice’s rabbit hole.
I am of the sincere opinion that it is time to ignore the troll. Nothing useful results from engagement with it.
Richard

beckleybud@gmail.com
Reply to  Richard M
October 6, 2014 12:44 pm

@ Mr Courtney
..
Thank you for your input, but Mr Dbstealey is doing a wonderful job of discrediting his claim without your help.

richardscourtney
Reply to  Richard M
October 6, 2014 12:55 pm

dbstealey
I wrote saying to you of beckleybud@gmail.com

I am convinced that this particular troll is pretending to be stupid as a wind-up to disrupt threads.
He/she/they/it makes ludicrously daft comments such as “when temperature stays constant like it has for the past 18 years” knowing the comments are so outrageously wrong that any response drags discussion down Alice’s rabbit hole.
I am of the sincere opinion that it is time to ignore the troll. Nothing useful results from engagement with it.

If you needed proof of that opinion then I draw your attention to the troll’s response to my stating it.
Richard

Reply to  Richard M
October 6, 2014 1:11 pm

buddyB says:
As per your request
I just knew he would post something like that! It’s wrong, of course.
BuddyB’s chart is nothing but an overlay. Like this.
It does not show causation. It just overlays CO2 and temperature. This chart shows causation — AND it includes the past 18 years. You can see that T came first, followed by CO2. And this chart shows causation. This chart also shows causation. This one shows causation, too. So does this one. And this one.
But buddyB’s chart, just like this one that he posted earlier, is only an overlay. It does not show causation. It is simply CO2 overlaid on top of T. There is no indication of which came first.
Even for a high school grad, buddy doesn’t know much. He needs to study the archives for several months. Even then, I doubt whether he would understand. BuddyB says:
It’ is time to educate you.
That sounds just like a dog saying it’s time to educate Einstein. For an even better analogy: it’s harder teaching BuddyB about causation than it is teaching a dog trigonometry.☺

mikewaite
October 3, 2014 12:44 am

Looking at the graphs that Kristian provided above, both RSS and UAH show a sharp minimum in temperature anomaly in 2012 , the same year that the Arctic ice was at a minimum . Is there not some contradiction in those 2 observations , which are based on official , impeccable, data.

mikewaite
Reply to  mikewaite
October 3, 2014 12:51 am

Thinking about it , whether there is contradiction depends on which event came first . I suppose melting of a large expanse of ice would cool the atmosphere , in NH at least . But if the drop in global temperature preceded the melting , then what promoted the latter event?

Steve Keohane
Reply to  mikewaite
October 3, 2014 8:32 am

I think of a lack of ice at the Arctic as cooling, it allows the ocean to dump heat to the atmosphere and off to space. Ice traps the heat of the water. So I’m guessing that the heat loss from from the water by melting the ice is less than having open water exposed to atmosphere.

October 3, 2014 12:48 am

“The hiatus period of 18 years 1 month, or 217 months, is the farthest back one can go in the RSS satellite temperature record and still show a sub-zero trend.”
Figure 1 shows a zero trend, not a sub-zero trend, m’lord.

Mr Green Genes
Reply to  Joe Public
October 3, 2014 1:44 am

When rounding a figure just below zero to 2 significant figures, spreadsheets show that rounded figure as -0.00 which is as stated on Fig. 1 and I therefore conclude that Lord M of B is correct. Further down, he mentions that he “replaced all the monthly RSS anomalies for 1998 with the mean anomaly value of 0.55 K that obtained during the 2010 el Niño“. Recalculating the trend from September 1996 to September 2014 changes the trend value to +0.00 C° (+0.00 C°/century), in other words, very slightly above zero but rounded to zero to 2 sig. figs. As he points out, “Not exactly a major difference.

NZ Willy
Reply to  Joe Public
October 3, 2014 1:47 am

Zero when rounded to .01C, presumably sub-zero unrounded, else you are right.

Jimbo
October 3, 2014 1:02 am

It looks like the pause / plateau / plateaupause is now longer than the discernible temperature rise between 1979 to 1996?

Reply to  Jimbo
October 3, 2014 2:15 am

Counting the prominent spike of the 1998 el Nino, it’s a duck-billed plateau-pause. A lot more interesting and scientific than a hockey stick, any day.

rogerknights
Reply to  Monckton of Brenchley
October 3, 2014 8:09 am

I view it as a flipped hockey stick that looks like this: /”
I like to imagine that as a poster, with the caption, “Who’s in denial now?”

Richard M
Reply to  Jimbo
October 3, 2014 7:26 am

If you look closely at multiple data sets you can see the warming actually went from around 1975 to 2005 (RSS only gives 1979 as that is when it starts) in conjunction with the +PDO. We then started to cool with the -PDO. The cooling has essentially cancelled the warming back to Sept 1996 which is why the trend appears flat from that point.
http://www.woodfortrees.org/plot/rss/from/plot/rss/from/to:2005/trend/plot/rss/from:2005/trend

Jimbo
October 3, 2014 1:19 am

Above Monckton states…..

By Christopher Monckton of Brenchley
…..Figure 1. RSS monthly global mean lower-troposphere temperature anomalies (dark blue) and trend (thick bright blue line), September 1996 to September 2014, showing no trend for 18 years 1 month……

On Dr Carl Mears’ blog page he says…..

Dr Carl Mears, senior research scientist, RSS – Monday, September 22, 2014
(The de*ialists really like to fit trends starting in 1997, so that the huge 1997-98 ENSO event is at the start of their time series, resulting in a linear fit with the smallest possible slope.)
http://www.remss.com/blog/recent-slowing-rise-global-temperatures

[My star]

Reply to  Jimbo
October 3, 2014 3:35 am

Jimbo,
Mears doesn’t understand. The year 1997 was chosen specifically by Phil Jones as the start year for statistically determining whether global warming had stopped.
Thus 1997 is the year chosen by the Warmist clique themselves, not by skeptics.

Green Sand
October 3, 2014 1:22 am

RSS “Climate Analysis”
http://www.remss.com/research/climate

“……..The reasons for the discrepancy between the predicted and observed warming rate are currently under investigation by a number of research groups. Possible reasons include increased oceanic circulation leading to increased subduction of heat into the ocean, higher than normal levels of stratospheric aerosols due to volcanoes during the past decade, incorrect ozone levels used as input to the models, lower than expected solar output during the last few years, or poorly modeled cloud feedback effects. It is possible (or even likely) that a combination of these candidate causes is responsible…….”

Reply to  Green Sand
October 3, 2014 1:27 am

In response to “Green Sand’s” quotation from RSS, it is also possible – tell it not in Gath, publish it not in the streets of Ashkelon – that the models have been profitably overestimating climate sensitivity.

Reply to  Green Sand
October 3, 2014 3:11 am

To paraphrase Oscar Wilde:
“For 10 models to be wrong may be regarded as a misfortune; for 20 models to be wrong looks like carelessness; but 32??

Editor
October 3, 2014 1:46 am

Figure 1 shows a zero trend, not a sub-zero trend, m’lord

I follow the stats as a hobby, and calculated the slope() function for that time period. It comes out to -3.4E-05 degrees per year, or -0.0034 degrees per century. So yes, it is negative.

Berényi Péter
October 3, 2014 1:51 am

“Nevertheless, … we have substantial confidence that Ptolemaic models can predict at least the broad-scale features of celestial positions of planets. … There are similarities between results from geocentric models using only a few epicycles and those using more sophisticated descriptions, and our understanding of such differences as do occur gives us some confidence in the results.”

That’s it, fixed.

Village Idiot
October 3, 2014 1:57 am

More of Moncktons monthly monkey business.
I do have better things to do than read the entire screed (is this man paid by the word?) but noticed that after the glaring, attention seeking tabloid-esque headline: “It’s official: no global warming for 18 years 1 month” and the unsubstantiated claim in paragraph 2 “there has now been no global warming for 18 years 1 month”, the reality check comes in paragraph 5. The ‘pause’ is in fact “the farthest back one can go in the RSS satellite temperature record and still show a sub-zero trend”
One could picture the sweat breaking on Sir Christopher’s brow as he furiously back pedelled.
Of course comparing short term (from the climate perspective) satellite data with climate model surface temperature simulations is itself a bit end-of-the-pier. But when the satellite data set of choice used is looking more and more like an outlier (probably due in part to incorrect data adjustment), the whole excercise takes on the guise of attention seeking at the climate skeptic trough.

Reply to  Village Idiot
October 3, 2014 2:13 am

More sour grapes from the relentlessly unconstructive “Village Idiot”. Over the period of the RSS graph, the trends shown by the five datasets are not much different from one another, particularly when measurement, coverage, and bias uncertainties are allowed for. RSS is indeed an outlier in that is not constantly readjusted upward like most of the others. It is an honest enough dataset, and it reflects the magnitude of the great el Nino better than the others.
One appreciates that the climate liarists are wriggling like stuck pigs as the Great Pause lengthens. But if “Village Idiot” really wants to argue about whether RSS should be relied upon, let it take the matter up not with me but with Railroad Engineer Pachauri of the collapsing IPeCaC: he said last year in Melbourne (where I shall be for the rest of this month) that by then there had been no global warming for 17 years. Now it’s 18 years. Don’t whine: get over it, and learn to live with the Pause: it will become considerably longer.

Patrick
Reply to  Monckton of Brenchley
October 3, 2014 2:34 am

Melbourne is OK I guess. Trouble is millions of Melbourneites live there and is largely the home city dwelling latte sipping climate change alarmists. Go get ’em!
PS. If I recall, Melbourne University is not too far away from South Yarra. Plenty of nice cafes along Chapel St.

Village Idiot
Reply to  Monckton of Brenchley
October 3, 2014 3:39 am

RSS ‘adjustments’ which inflate the pause can be viewed here:
http://www.climate4you.com/
-Global Temperatures
-Temporal stability of global air temperature estimates

mpainter
Reply to  Village Idiot
October 3, 2014 2:35 am

“Better things to do” you say. But instead, you put one long, unpleasant sneer here. Go do your better things, I pray you.

Konrad.
Reply to  Village Idiot
October 3, 2014 2:52 am

is this man paid by the word?)

No. His Koch brothers cheque is not in the mail It only exists in your crazed imagination.
And speaking of cheques, the warmulonian propaganda funds are about to dry up. Every vaguely intelligent national leader avoided the latest UN climate scam fund-raiser. All you got was hollow man Obarmaclese talking to a room full of sorry mendicants. All you have left is the propaganda funding from Big Wind, but even they know the gig is up. Good money after bad in the dying days of the hoax? You’re sucking on fumes now…
I spent a few grand running those empirical experiments. Money well spent, power at a point and above all a free pubic service. Sceptic websites run on tip-jars, and sceptics work on their own dime. What can be said of you and yours? Hand in the till every time. Sceptics never forgive and the Internet never forgets.
PS. While I may be a better empiricist than Viscount Monckton, the idea that you are a better mathematician than Christopher is truly, truly laughable.

Amatør1
Reply to  Konrad.
October 3, 2014 3:54 am

Every vaguely intelligent national leader avoided the latest UN climate scam fund-raiser.

The trouble is that some of us don’t have intelligent national leaders. The following link is to the official Norwegian government website. It contains the speech (in english) made by the conservative (?) Prime Minister Erna Solberg at the UN Climate Summit 2014, 23 september.
http://www.regjeringen.no/en/dep/smk/Whats-new/speeches-and-articles/statsministeren/talerogartikler/2014/Statsministerens-innlegg-pa-klimatoppmotet.html?id=767882
It starts like this
“Co-chairs, Excellences, Ladies and gentlemen,
The international response to climate change is lagging far behind what is necessary.
The effects of climate change are being felt on all continents. Unmitigated climate change poses great risks to human health, global food security and economic development.
We have no choice but to act now.
[…]”

This is from a government which is as “conservative” as it is possible to get. The alternative, labour, is even worse. Btw., the former Norwegian labour PM is now head of NATO. You don’t know what you have done….

Reply to  Konrad.
October 3, 2014 7:28 pm

On what evidence does “Konrad” consider himself a better empiricist than Monckton of Brenchley?

Alan Robertson
Reply to  Village Idiot
October 3, 2014 2:59 am

Hello Village Idiot,
Didn’t you read the recent thread about anonymous trolls?

Reply to  Alan Robertson
October 3, 2014 7:28 am

His name is consistent and descriptive.
He’s not a troll.
He just lacks a good grip on reality.
The Pause is real regardless of the Apocalyptic Visions of his Church.

Berényi Péter
Reply to  Village Idiot
October 3, 2014 3:07 am

One could picture the sweat breaking on Sir Christopher’s brow as he furiously back pedelled.

That’s what pops into your mind, it is telling. In fact one way to get the 217 months figure is like this.
ber@errno:/tmp/rss$ wget ftp://ftp.remss.com/msu/monthly_time_series/rss_monthly_msu_amsu_channel_tlt_anomalies_land_and_ocean_v03_3.txt
--2014-10-03 11:48:54-- ftp://ftp.remss.com/msu/monthly_time_series/rss_monthly_msu_amsu_channel_tlt_anomalies_land_and_ocean_v03_3.txt
=> `rss_monthly_msu_amsu_channel_tlt_anomalies_land_and_ocean_v03_3.txt'
Resolving ftp.remss.com... 173.167.106.241
Connecting to ftp.remss.com|173.167.106.241|:21... connected.
Logging in as anonymous ... Logged in!
==> SYST ... done. ==> PWD ... done.
==> TYPE I ... done. ==> CWD /msu/monthly_time_series ... done.
==> SIZE rss_monthly_msu_amsu_channel_tlt_anomalies_land_and_ocean_v03_3.txt ... 39317
==> PASV ... done. ==> RETR rss_monthly_msu_amsu_channel_tlt_anomalies_land_and_ocean_v03_3.txt ... done.
Length: 39317 (38K)
100%[==============================================================================>] 39,317 58.6K/s in 0.7s
2014-10-03 11:48:58 (58.6 KB/s) - `rss_monthly_msu_amsu_channel_tlt_anomalies_land_and_ocean_v03_3.txt' saved [39317]
ber@errno:/tmp/rss$ for i in `seq 2 429`; do (echo $i; tail -$i rss_monthly_msu_amsu_channel_tlt_anomalies_land_and_ocean_v03_3.txt | perl -e 'while (<>) {chomp; ($y,$m,$t)=split; $d=$y+$m/12-1/24; printf "%.3f %s\n",$d,$t;}' | ~/climate/lin.pl) | xargs echo; done | grep " -" | tail -1
217 -0.000034
ber@errno:/tmp/rss$ cat ~/climate/lin.pl
#!/usr/bin/perl
while (<>) {
chomp;
($d,$t)=split;
$n++;
$x+=$d;
$xx+=$d**2;
$y+=$t;
$xy+=$d*$t;
}
$C=$n*$xx-$x**2;
$A=$n*$xy-$x*$y;
$a=$A/$C;
printf "%.6f\n",$a;

Konrad.
Reply to  Berényi Péter
October 3, 2014 3:19 am

Well, while a mathematical disproof of “sweat” is highly unusual, I think the judges are going to have to accept this one….

Reply to  Berényi Péter
October 3, 2014 5:37 am

Thanks for that. I did not know the utility ‘seq’ existed.

Vince Causey
Reply to  Village Idiot
October 3, 2014 3:17 am

What trough are you talking about? Is this the “skeptics funded by big oil” meme again?

Reply to  Village Idiot
October 3, 2014 3:38 am

So Village Idiot didn’t read the article, but he pontificates on it?
He is truly an idiot…

Richard M
Reply to  Village Idiot
October 3, 2014 7:35 am

Another alarmist who denies the science. According to Knight et al the 95% criteria for falsifying models is 15 years. So, 18 years is, in fact, not “short term”. It is much longer than necessary to demonstrate dangerous AGW is not happening.
Knight et al … “Near-zero and even negative trends are common for intervals of a decade or less in the simulations, due to the model’s internal climate variability. The simulations rule out (at the 95% level) zero trends for intervals of 15 yr or more”

Reply to  Richard M
October 4, 2014 12:27 pm

You should read the articles you cite, you have conveniently left out the part which points out that the simulations referred to are “ENSO Adjusted”. If you apply ENSO adjustment to the recent period you will find that there is no 18yr pause.

Richard M
Reply to  Richard M
October 5, 2014 5:16 pm

No one truly knows how to adjust for ENSO. It’s just a scapegoat.

knr
October 3, 2014 2:41 am

‘the possibility that the Pause is occurring because the computer models are simply wrong about the sensitivity of temperature to manmade greenhouse gases can no longer be dismissed.’
You would think so but you be dead wrong , indeed their are plenty who still deny any ‘pause ‘ at all
As for Cheery Picking dates , that seems an odd accusation as that is standard procedure for climate ‘science’ to ensure you pick the ‘right dates ‘ as part of data torturing that will always get you the results you ‘need ‘ no matter what the facts are.

Gareth Phillips
October 3, 2014 3:07 am

I rather like the phrase ‘cheery picking dates” It makes researchers sound like a happy bunch!

October 3, 2014 3:42 am

knr says:
You would think so but you be dead wrong , indeed their are plenty who still deny any ‘pause ‘ at all
Their are, are their?
There are those who deny that man landed on the moon, too. Both have equal credibility.

Alan Robertson
October 3, 2014 3:47 am

El Niño indicators are currently trending positive and not a moment too soon. Not only could an El Niño event bring rain to a parched California, but Northern Hemisphere snow cover is already at great extent, signalling a very cold winter is just ahead. A large release of stored heat energy could help negate a severe winter’s devastation.
http://home.comcast.net/~ewerme/wuwt/cryo_compare.jpg
An El Niño event this fall would be an answer to the climate fearosphere’s most fervent prayer, but not just to give them a talking point that “the pause” has ended. Last winter saw the US northern states electric grid strained to the very limit. With President Obama’s EPA shutting down ever more coal- fired generating stations, another severely cold winter could cause the Northern US power grid to experience widespread blackouts, with many cold- related deaths sure to follow. Such an event could well turn the tide of public sentiment against the climate fear mongers and they know it.

MarkW
Reply to  Alan Robertson
October 3, 2014 10:32 am

Hate to say it, but having such an event this year would be better than having it happen next year.
By next winter even more coal plants will be shut down, and the deaths from a cold spell would be even higher.

Rob
October 3, 2014 4:16 am

Something is now terribly wrong with the physical assumptions of the ocean/atmosphere as regards to the man made “global warming” theory. Clearly, unknown factors are at work here.
A complete reevaluation of our understanding (lack thereof) is called for.
Nature controls. History will judge!

Bill Illis
October 3, 2014 4:39 am

Let’s remember several years ago when all the heavy-weights of climate science produced a paper that said the lower troposphere pause had to be at least 17 years long before a clear signal that human-made CO2 warming theories should start to be questioned.
Carl Mears was the second author on that paper along Ben Santer (lead) [and Tom Wigley, Susan Solomon, Tom Karl, Gerald Meehl, Peter Stott, Peter Thorne, Frank Wentz].
Well, that time has now been exceeded and they all have egg on their face.
http://nldr.library.ucar.edu/repository/assets/osgc/OSGC-000-000-010-476.pdf
Alhough, if you read Carl Mears article carefully, he is starting the discussion that maybe the theories need to be revised. His use of the d’word may be needed just to keep him in the club and not being shown the door by his other compatriots who accept no questioning at all.

Steve from Rockwood
Reply to  Bill Illis
October 3, 2014 8:14 am

And he continues to use the weasel words “very likely” which allows him to be never completely wrong.

Jimbo
Reply to  Bill Illis
October 6, 2014 6:19 am

If not a 17 year pause then how long? Expect a paper out soon stretching it out to “at least 25 years or more” After that expect at “least 35 years or more”.

Weekend Australian – 22 February, 2013
‘Nothing off-limits’ in climate debate
THE UN’s climate change chief, Rajendra Pachauri, has acknowledged a 17-year pause in global temperature rises, confirmed recently by Britain’s Met Office, but said it would need to last “30 to 40 years at least” to break the long-term global warming trend.
http://www.theaustralian.com.au/news/nothing-off-limits-in-climate-debate/story-e6frg6n6-1226583112134

The only thing “off-limits” is Santer’s 17 year minimum record to show the human influence. Which can’t be found after just over 18 years and counting. If you look at what Pachauri said closely he said 30 years to 40 years. Yet we know that 30 years is the IPCC’s accepted minimum for climate. Why did he indicate more?

Kenny
October 3, 2014 4:43 am

“Yet the Pause coincides with a continuing, rapid increase in atmospheric CO2 concentration”.
To me, this is the money quote. We have been told for years that CO2 caused the rapid warming of the planet. This is just not true. Whenever I get the chance to talk to someone about the climate, this is the one thing I always bring up and it is the one thing that they cannot explain away. CO2 has gone up….temps have not.

John Finn
Reply to  Kenny
October 3, 2014 6:25 am

To me, this is the money quote. We have been told for years that CO2 caused the rapid warming of the planet.

To be fair – this is not completely true. It’s well recognised that natural variability can offset CO2 warming over a ‘short’ period of time, e.g. a decade. The CO2 increase over 10 years is ~20 ppm. Currently, that would result in a forcing of ~0.27 w/m2 at TOA. Even using the high IPCC sensitivity figure (3 deg per 2xCO2) this would only result in an increase of 0.2 degrees C which could be comfortably negated by natural variability. That said, we are now approaching the point where serious questions are being raised about CO2 climate sensitivity.

Kenny
Reply to  John Finn
October 3, 2014 9:10 am

Got it John….Thanks

KevinM
October 3, 2014 5:57 am

Still waiting on the 1998 downward revisions to demolish the 18 years flat argument.

Patrick B
October 3, 2014 6:25 am

When were the 33 models used in Figure 2 created? I’m curious because it seems that if they were created after say 1995, any graph they generated should start in that year. To show a long period of congruence with measured temperatures prior to the creation of the model suggests it has some validity whereas all it is was the modeler made sure his model could hindcast known data.

Alan Robertson
Reply to  Patrick B
October 3, 2014 7:48 am

Curve fitting elegance.

David Ramsay Steele
October 3, 2014 7:14 am

It is best to avoid calling people liars or liarists. A lie is telling an untruth in a deliberate attempt to deceive; that is, the liar knows that what he’s saying is untrue. I see no proof that Mears or other catastrophists know that what they’re saying is untrue. It looks very much as if they sincerely believe it. It is quite reasonable to say that they are deluded; that is (to take one main dictionary definition) they believe something which is untrue, or (to take the other main dictionary definition) they believe something which is untrue despite strong evidence against it.

mpainter
Reply to  David Ramsay Steele
October 3, 2014 7:23 am

Mears knows the truth but he chooses to avoid it. I do not believe that he is so obtuse that he does not understand his own data. You are making a case for stupidity.

Gordon Ford
Reply to  mpainter
October 3, 2014 1:39 pm

A better description is “novelist ” for those who take a few facts and add fiction. It is a polite term for “Liarist”.

knr
Reply to  David Ramsay Steele
October 3, 2014 8:01 am

If not a liar then a crap ‘scientist’ that needs to back to school .
Why is it OK for someone who is professional with a PhD to have worse academic standards than a student at undergraduate level ? It’s a trick question really its not , expect it would seem in special climate ‘science’ were all you need is not love but faith.

JJ
Reply to  David Ramsay Steele
October 3, 2014 9:37 am

Idiot or liar, either way call the spade a spade.

TRM
October 3, 2014 7:23 am

“liarist” – Man you just kill me sometimes with your highly accurate but dry sense of humour! Well played sir, very well played.

October 3, 2014 7:48 am

It’s time to start another trend line “No Sea Ice Loss for xYears yMonths. That will be pretty cool also!

Richard M
October 3, 2014 7:54 am

As I’ve pointed out before the pause is actually a period where warming has ended and cooling has begun. The trend looks flat because a portion of the previous warming has been canceled out by the cooling. I think from a scientific view this is more important. The change in slopes is actually right around the time the PDO moving from its positive phase into its negative phase.
http://www.woodfortrees.org/plot/rss/from:1996.66/plot/rss/from:1996.66/to:2005/trend/plot/rss/from:2005/to/trend
Given we have now passed by the cycle 24 peak as well as the AMO peak, all the of indicators now point toward future cooling. Once the current El Niño conditions fade away the cooling should begin in earnest if AGW is a weak effect or completely false.

babetheke
October 3, 2014 8:19 am

Perhaps “Liarist” is a bit harsh a word and would certainly provoke angry retorts. Therefore I would suggest “Modelcrat”…. as in bureaucrats who adhere strictly to their models and prefer them over real data.

Reply to  babetheke
October 3, 2014 12:06 pm

A liarist is one who uses the word “denialist” while pushing conclusions to extremes beyond the evidence for profit.

Reply to  Monckton of Brenchley
October 3, 2014 4:05 pm

I think apologist is a better term because it suggests defending a religious-like POV.

October 3, 2014 8:41 am

Its quite fun to play around with the regressions on RSS, particularly trying to be objective and not cherry picking anything. The Psc = probability of spurious correlation, based on standard T test. 5% or lower value corresponds to 95% confidence interval ie significant.
As a starting point, a regression through the entire series from 1979 to date gives:
1929 – 2014.67 Slope = +1.23 deg/century (Significant, Psc = 0.0%)
To avoid cherry picking, the mid point of the RSS data set is month 1996.83. If you split the data in half at this point and regress on each half (the month 1996.83 is in each half) then you get:
1979 – 1996 Slope = +0.72 deg/century (Significant, Psc = 0.1%)
1996 – 2014 Slope = -0.00 deg/century (Not significant, Psc = 89.6%, therefore no slope)
These correspond nicely to the well known 17 years data requirement for reliable estimation, cited by both Jones and Santer.
Interestingly, if you reverse the calculation shown by his lordship and work forwards from 1979, and just look at the Psc becoming significant at the 95% confidence level, then in fact the upward trend in the earlier half of the data does not stay statistically significant until you get to the period:
1979 – 1995.42 Slope = +0.48 deg/century (Significant, Psc = 4.3%)
If you then continue regressing increasing lengths of data forwards from the beginning in 1979 the result is always significant (as you would expect) and the slope increases substantially as the big el nino of 1998 comes into the regression. The peak slope is then:
1979 – 2004.25 Slope = +1.68 deg/century (Significant, Psc = 0.0%)
Finally, if you take the view that two different periods with different slopes are evident, where would the crossover point be such that the two regressions on the first segment and latter segment of the data have (almost) the same Psc? That occurs most closely at 1995.08 where we find:
1979 – 1995.08 Slope = 0.36 deg/century (not significant, Psc = 14.0%)
1995.08 – 2014 Slope = 0.29 deg/century (not significant, Psc = 13.3%)
Finally, looking at the June 1988 date of Hansen’s famous congressional meeting, its worth pointing out that at that time the satellite data shows that, using all the RSS data from 1979 onwards, there was no statistically significant warming detectable at that time (Psc = 61.5%!) and for the preceding 3.5 years since the beginning of 1985 there had in fact been statistically significant cooling indicated continually!

October 3, 2014 9:12 am

I think it is far enough down the thread to ask a question.
Does anyone know WHY there has been no warming for 18 years? Or WHY there has been no Climate Change for over 18 years? We know the WHY can’t be CO2, or Solar radiation changes.
I think the WHY is because all of the historical paleontology and land based temperature reconstructions have been local and that the Global temp hasn’t changed. El and La Nino’s are local temperature changes.
So my prediction is no Global temperature changes. The Global energy balance is invariant.

RACookPE1978
Editor
Reply to  Genghis
October 4, 2014 3:06 am

Genghis
October 3, 2014 at 9:12 am
Does anyone know WHY there has been no warming for 18 years? Or WHY there has been no Climate Change for over 18 years?

No.

Chip Javert
Reply to  Genghis
October 4, 2014 9:38 pm

One presumes that every fool running around claiming CAGW is settled science has at least 52 (at last count) explanations for 18 years of no warming.

Robert W Turner
October 3, 2014 9:12 am

All the volcanic activity this year, including one eruption that sent ash into the stratosphere, and the waning activity of the sun leads me to believe 2015 will be a very alarming year for climate alarmists.

John Whitman
October 3, 2014 9:37 am

{strike through and bold emphasis mine – JW}
Dr Mears writes:
“The d€nia£ists like to assume that the cause for the model/observation discrepancy is some kind of problem with the fundamental model physics, and they pooh-pooh any other sort of explanation. This leads them to conclude, very likely erroneously, that the long-term sensitivity of the climate is much less than is currently thought.”

– – – – – – –
Dr Mears,
Do you realize people who choose to talk like that have chosen unwisely, as in a loss of professional ethics unwisely.
Your apologies, when sincere, will restart a process toward rebuilding some trust in climate focused science.
Note: my premise is that you chose to talk like that on your own volition without being pressured to do so from alarm peddling rabble in the climate focused science community.
John

Pamela Gray
October 3, 2014 10:01 am

One only has to measure the amount of energy required to raise T from one level (T1) to another (T2) in a column of air directly over a surface sensor. Then go looking for a source that has that energy. We can calculate how much additional LW heat energy would be directed downward to that sensor due to the also known amount of additional CO2 that was added to that column of air during the time span between T1 and T2. Anyone with grade school knowledge of ordinality and “sign” would deduce that the additions of CO2 molecules to that column of air between T1 and T2 would not carry sufficient energy to produce such a rise. One would have to look elsewhere for a source of heat that would be sufficient.
This basic calculation is why card carrying AGW scientists know that they must now say that the anthropogenic heat is currently being sucked into and hiding in the oceans thus will soon recycle the El Nino meme as being enhanced by this additional anthropogenic downwelling longwave infrared heat energy as it comes back out of the oceans. All they have to figure out now is how air temperatures can add additional warmth to sea temperatures using only LW infrared as that additional heat source.
To card carrying AGW scientists, good luck with that.

Reply to  Pamela Gray
October 3, 2014 10:14 am

Pamela Gray said; “One only has to measure the amount of energy required to raise T from one level (T1) to another (T2) in a column of air directly over a surface sensor.”
It isn’t that simple. Energy that goes into surface evaporation doesn’t raise the temperature directly, it may even lower the temperature. Temperature is tricky and not particularly meaningful.

Pamela Gray
Reply to  Genghis
October 3, 2014 2:14 pm

I understand that. Nonetheless, under this calculation, you simply are required to measure the energy needed to raise the mercury (or whatever fluid you use) in the surface sensor thermometer which then is used to measure air temperature, whatever temperature raising mechanism you choose to use. Next, calculate whether or not the added amount of anthropogenic CO2 produces enough downwelling longwave radiation energy to do that job. If there isn’t enough energy, you must move on in your search of a mechanism that does have sufficient energy to make that mercury rise.

bw
October 3, 2014 10:03 am

Putting RSS temps into a longer term perspective by adding BEST surface temps.
http://www.woodfortrees.org/plot/best/scale:3/plot/rss-land
The BEST temps are scaled by 3 to show a larger perspective, and to give a relative “error” estimate of at least three times worse than satellite temps. Older temps are more uncertain than later.
The satellite temp plots should always include some estimate of error, such as confidence intervals. From reading the underlying methodology papers it seams that the anomaly “data” would have error bars of at LEAST 0.2 degrees.
Remember that the global ocean holds much more thermal energy than the atmosphere. At the surface interface the ocean holds 3200 kJ per cubic meter. The atmosphere holds 1 kJ per cubic meter. Ocean temps control global temps.
Once suggestion for an obvious global temperature proxy would be Antarctic sea ice extent. The Antarctic is less affected by anthro-influences, such as surface soot.
BTW, the temperatures recorded at scientific stations Amundsen-Scott, Vostok, Halley and Davis have been recording quietly for over 50 years, they all show zero warming.

Mike Smith
October 3, 2014 11:28 am

You guys make it all so complicated.
In the past 18 years, we’ve pumped an additional 40ppm of CO2 into the atmosphere and the global temperature record has risen by zero, nada, zip.
THEREFORE, all of the old climate models are hopelessly broken.
SO, let’s have the scientists start over by doing some real science and see if we can figure out how this climate system really works.
As for the policy makers, the CO2 reduction policies don’t work, even if the scientists were right, which they weren’t. So, forget CO2 and go find something else to tax.

Richard Barraclough
October 3, 2014 11:50 am

The satellite datasets are really on the ball this month. I see the latest UAH figures for September are also available. They show a slight increase in the anomaly to 0.294 C, up from 0.2 in August, and pretty close to the levels seen between May and July.
Doing the same analysis as Christopher Monckton has done for RSS, you can find a negative slope in the UAH anomalies going back only to September 2008. Despite the recent slight negative trend, the rolling 10-year average remains at an all-time high – and by “all-time”, of course I mean since this satellite analysis started in 1979!

NZ Willy
October 3, 2014 1:59 pm

I’m concerned about the method of “least-squares linear regression” used to calculate the Pause. The problem is that it doesn’t take into account where the data is below the trendline and where it is above. To show that it’s GIGO, simulate temperature data which goes linearly from -10C to +10C across the entire Pause chart, with a drop to 0C for the last data point. The last point is thus the right-hand anchor for the trendline, and the trendline is zero across the chart by the least-squares linear regression. But the result is an obvious nonsense when you look at the chart with its monotonically rising slope.
To say that Phil Jones endorses the method may be a help to show what invalid methods they use, but it doesn’t help to calculate the Pause correctly — assuming the underlying data is correct, of course. The most obvious glaring fault is that the current temperature is used to position the vertical placement of the trendline, therefore the “Pause” is held hostage to the latest month’s temperature and the length of the Pause can wildly fluctuate from month to month, depending on the latest month’s temperature. This is no way to run a “Pause”.
The correct method is to use the method of beams, as in civil engineering, where the trendline is treated as a solid beam suspended by its midpoint, and the temperature graph represent the forces acting on the beam. Note that a temperature offset at an endpoint has a greater effect than one in the middle, because the torque of each point is (the temperature offset from the trendline) times (the time offset from the midpoint month) — in other words, vertical offset times horizontal offset. When the total torques on each side of the beam are identical, then the beam hangs level. Now that is a correct Pause.
Looking at the Pause chart at top, it is clear that the low-temperature points at the left edge would drag the left edge of the trendline down, so you are overreporting the Pause. Not by much, it is true, but still overreporting.

Reply to  NZ Willy
October 3, 2014 2:41 pm

Unfortunately, NZ Willy is misunderstanding how least-squares regression works. But if he prefers, he can do his own calculation using any reasonable method and report the results. Or he can use Matt Briggs’ method: just use the Mk 1 eyeball. meanwhile, science will continue to use least-squares regression because it is well understood and provides a standard benchmark. If he disagrees with Professor Jones about this, he should complain not to me but to him.

John Finn
Reply to  Monckton of Brenchley
October 4, 2014 3:58 am

Got to agree with CM here. NZ Willy’s description (and example) of LS regression is nonsense.

Reply to  Monckton of Brenchley
October 5, 2014 12:17 pm

Dear Mr. Guest Blogger. I just have a quick question to gain some perspective.
Whereas this WUWT article is fulminating about a least-squares linear regression on a 11% of the total instrumental temperature record of the component of the climate system with the least heat capacity and which constitutes 0.4 % by mass of the total…
Why are we NOT discussing the 99.6% of the climate system that’s gaining heat content as demonstrated unambiguously by empirical evidence of continual sea level rise and accelerated decrease in global ice mass?  Can you show me nice zero-slope trendlines in any of the global climate parameters without leaving out data?
Calculations: 
2014-1850 = 164 years
2014-1996 = 18 years
% of instrumental temperature record = 11.0 %
Mass of oceans: 1.37 x 10^21 Kg
http://hypertextbook.com/facts/1998/AvijeetDut.shtml
Mass of the atmosphere=  5.1480×10^18 kg
http://en.m.wikipedia.org/wiki/Atmosphere_of_Earth#Density_and_mass
Antarctic ice sheet: 26.5 million cubic km of ice
http://en.m.wikipedia.org/wiki/Antarctic_ice_sheet
Ice density: 9.17 x10^8 Kg/km^3
Mass of Antarctica Ice:  9.17 x10^8 Kg/km^3 x 26.5 x 10^6 km^3 
= 243 x 10^14 Kg ice 
Calculate Total mass of climate components:
Oceans: 1.37 x 10^21 Kg
Air: 5.1480×10^18 kg = 0.005148 x 10^21
Antarctica ice: 243 x 10^14 Kg = 0.0000243 x 10^21
Total mass of climate components: 1.3751723 x 10^21
% air = 100 x 0.005148 / 1.37517 = 0.37 %
% ocean = 100 x 1.37 / 1.37517 = 99.6 %
% ice = 100 x 0.0000243 / 1.37517 = 0.002 %
Hanzo

Reply to  Monckton of Brenchley
October 5, 2014 1:13 pm

Hanzo,
Instead, let’s discuss the fact that it has been anywhere from 10 – 18 years [or more] of no global warming [depending on the database used].
See, you are doing the “fulminating” over mythical warming.
You routinely cherry-pick non-facts, like “accelerating” global ice decline, and accelerating sea level rise. But in fact, global ice volume/cover is right at it’s long term average [the red graph line]
Also, Antarctica has been steadily cooling. Any rational person who knows that understands that ice doesn’t melt from global warming, when the continent is cooling. Who do you think you’re kidding?
Furthermore, sea level rise is not accelerating. Asserting that it is makes you look like a propagandist for the g;lobal warming scare. Maybe you are.

Reply to  NZ Willy
October 3, 2014 6:59 pm

Yes nz
A linear regression on temperature is non physical.
However it’s customary to ignore this

Reply to  Steven Mosher
October 3, 2014 9:07 pm

All statistical analyses are, properly speaking, “non-physical”. However, the fact that there has been no global warming for approaching a couple of decades is a physical reality of which the least-squares linear-regression trend on the RSS data is an indicator.

Reply to  Steven Mosher
October 3, 2014 9:27 pm

not exactly
There has been no increase in RSS records. Hint, they are not global warming.
Put another way, RSS estimates, does not measure, the temperature several kilometers above the surface of the planet. This is one slice. It doesnt tell you much.
RSS doesnt measure global warming.

Reply to  Steven Mosher
October 4, 2014 2:58 am

Steven Mosher says:
RSS estimates, does not measure, the temperature several kilometers above the surface of the planet. This is one slice. It doesnt tell you much.
It tells you the trend. Trend = zero.
And:
RSS doesnt measure global warming.
That’s because there isn’t any…

Reply to  Steven Mosher
October 4, 2014 4:16 am

Mr Mosher seems to be in Pause Denial. The RSS and UAH satellite records show near-global temperature anomalies at various altitudes in the atmosphere. My graphs show the temperature changes for the lower troposphere (TLT). The mean of the two satellite records shows warming over the past quarter of a century at half the rate predicted by the IPCC in 1990. No amount of quibbling is going to change that.

Reply to  Steven Mosher
October 4, 2014 10:57 am

Pause denial? Not at all. The rss records show a pause if you apply a
Linear model.
And Monkton really needs to look at other pressure levels. For example the stratosphere shows cooling which means there is global warming.
But tlt ain’t global. And the atmosphere ain’t global.

richardscourtney
Reply to  Steven Mosher
October 6, 2014 2:32 am

Steven Mosher
You say

For example the stratosphere shows cooling which means there is global warming.
But tlt ain’t global. And the atmosphere ain’t global.

Well, there never has been GLOBAL warming according to your assertion: some regions have warmed while some have cooled but the global average surface temperature anomaly (GASTA) has risen.
It is rise in GASTA which is asserted – e.g. by IPCC – as being so-called global warming.
I am surprised that you did not know this.
Richard

Jimbo
Reply to  Steven Mosher
October 6, 2014 6:30 am

Here you go.

Dr. Phil Jones – CRU emails – 5th July, 2005
The scientific community would come down on me in no uncertain terms if I said the world had cooled from 1998. OK it has but it is only 7 years of data and it isn’t statistically significant….”
Dr. Phil Jones – CRU emails – 7th May, 2009
‘Bottom line: the ‘no upward trend’ has to continue for a total of 15 years before we get worried.’
__________________
Dr. Judith L. Lean – Geophysical Research Letters – 15 Aug 2009
“…This lack of overall warming is analogous to the period from 2002 to 2008 when decreasing solar irradiance also countered much of the anthropogenic warming…”
__________________
Dr. Kevin Trenberth – CRU emails – 12 Oct. 2009
“Well, I have my own article on where the heck is global warming…..The fact is that we can’t account for the lack of warming at the moment and it is a travesty that we can’t.”
__________________
Dr. Mojib Latif – Spiegel – 19th November 2009
“At present, however, the warming is taking a break,”…….”There can be no argument about that,”
__________________
Dr. Jochem Marotzke – Spiegel – 19th November 2009
“It cannot be denied that this is one of the hottest issues in the scientific community,”….”We don’t really know why this stagnation is taking place at this point.”
__________________
Dr. Phil Jones – BBC – 13th February 2010
“I’m a scientist trying to measure temperature. If I registered that the climate has been cooling I’d say so. But it hasn’t until recently – and then barely at all. The trend is a warming trend.”
__________________
Dr. Phil Jones – BBC – 13th February 2010
[Q] B – “Do you agree that from 1995 to the present there has been no statistically-significant global warming
[A] “Yes, but only just”.
__________________
Prof. Shaowu Wang et al – Advances in Climate Change Research – 2010
“…The decade of 1999-2008 is still the warmest of the last 30 years, though the global temperature increment is near zero;…”
__________________
Dr. B. G. Hunt – Climate Dynamics – February 2011
“Controversy continues to prevail concerning the reality of anthropogenically-induced climatic warming. One of the principal issues is the cause of the hiatus in the current global warming trend.”
__________________
Dr. Robert K. Kaufmann – PNAS – 2nd June 2011
“…..it has been unclear why global surface temperatures did not rise between 1998 and 2008…..”
__________________
Dr. Gerald A. Meehl – Nature Climate Change – 18th September 2011
“There have been decades, such as 2000–2009, when the observed globally averaged surface-temperature time series shows little increase or even a slightly negative trend1 (a hiatus period)….”
__________________
Met Office Blog – Dave Britton (10:48:21) – 14 October 2012
“We agree with Mr Rose that there has been only a very small amount of warming in the 21st Century. As stated in our response, this is 0.05 degrees Celsius since 1997 equivalent to 0.03 degrees Celsius per decade.”
Source: metofficenews.wordpress.com/2012/10/14/met-office-in-the-media-14-october-2012
__________________
Dr. James Hansen – NASA GISS – 15 January 2013
“The 5-year mean global temperature has been flat for a decade, which we interpret as a combination of natural variability and a slowdown in the growth rate of the net climate forcing.”
__________________
Dr Doug Smith – Met Office – 18 January 2013
“The exact causes of the temperature standstill are not yet understood,” says climate researcher Doug Smith from the Met Office.
[Translated by Philipp Mueller from Spiegel Online]
__________________
Dr. Virginie Guemas – Nature Climate Change – 7 April 2013
“…Despite a sustained production of anthropogenic greenhouse gases, the Earth’s mean near-surface temperature paused its rise during the 2000–2010 period…”
__________________
Dr. Judith Curry – House of Representatives Subcommittee on Environment – 25 April 2013
” If the climate shifts hypothesis is correct, then the current flat trend in global surface temperatures may continue for another decade or two,…”
__________________
Dr. Hans von Storch – Spiegel – 20 June 2013
“…the increase over the last 15 years was just 0.06 degrees Celsius (0.11 degrees Fahrenheit) — a value very close to zero….If things continue as they have been, in five years, at the latest, we will need to acknowledge that something is fundamentally wrong with our climate models….”
__________________
Professor Masahiro Watanabe – Geophysical Research Letters – 28 June 2013
“The weakening of k commonly found in GCMs seems to be an inevitable response of the climate system to global warming, suggesting the recovery from hiatus in coming decades.”
__________________
Met Office – July 2013
The recent pause in global warming, part 3: What are the implications for projections of future warming?
………..
Executive summary
The recent pause in global surface temperature rise does not materially alter the risks of substantial warming of the Earth by the end of this century.”
Source: metoffice.gov.uk/media/pdf/3/r/Paper3_Implications_for_projections.pdf
__________________
Professor Rowan Sutton – Independent – 22 July 2013
“Some people call it a slow-down, some call it a hiatus, some people call it a pause. The global average surface temperature has not increased substantially over the last 10 to 15 years,”
__________________
Dr. Kevin Trenberth – NPR – 23 August 2013
They probably can’t go on much for much longer than maybe 20 years, and what happens at the end of these hiatus periods, is suddenly there’s a big jump [in temperature] up to a whole new level and you never go back to that previous level again,”
__________________
Dr. Yu Kosaka et. al. – Nature – 28 August 2013
Recent global-warming hiatus tied to equatorial Pacific surface cooling
Despite the continued increase in atmospheric greenhouse gas concentrations, the annual-mean global temperature has not risen in the twenty-first century…”
__________________
Professor Anastasios Tsonis – Daily Telegraph – 8 September 2013
“We are already in a cooling trend, which I think will continue for the next 15 years at least. There is no doubt the warming of the 1980s and 1990s has stopped.”
__________________
Dr. Kevin E. Trenberth – Nature News Feature – 15 January 2014
“The 1997 to ’98 El Niño event was a trigger for the changes in the Pacific, and I think that’s very probably the beginning of the hiatus,” says Kevin Trenberth, a climate scientist…
__________________
Dr. Gabriel Vecchi – Nature News Feature – 15 January 2014
“A few years ago you saw the hiatus, but it could be dismissed because it was well within the noise,” says Gabriel Vecchi, a climate scientist…“Now it’s something to explain.”…..
__________________
Professor Matthew England – ABC Science – 10 February 2014
“Even though there is this hiatus in this surface average temperature, we’re still getting record heat waves, we’re still getting harsh bush fires…..it shows we shouldn’t take any comfort from this plateau in global average temperatures.”

Jimbo
Reply to  Steven Mosher
October 6, 2014 6:41 am

Here is one in June.

Jana Sillmann et al – IopScience – 18 June 2014
Letters
Observed and simulated temperature extremes during the recent warming hiatus
“…This regional inconsistency between models and observations might be a key to understanding the recent hiatus in global mean temperature warming.”
http://iopscience.iop.org/1748-9326/9/6/064023

Surface global warming has stopped. It is now playing “Heat hide and seek” [Nature Climate Change].

Frank
October 3, 2014 2:12 pm

Sorry, the pause is not statistically significant. As Doug Keenan eventually got the Met Office to admit, you can’t assign statistical significance to a time series by arbitrarily assuming an AR1 linear process. Yes, temperatures haven’t risen, but it is impossible to assign any statistical significance to that. It doesn’t prove that global warming has stopped – just look at the steady (though small) in ocean heat content. If doesn’t prove that the GHE is wrong. The observation that IS important is the discrepancy between models and observations.

NZ Willy
Reply to  Frank
October 3, 2014 2:28 pm

Frank: By your own words, global warming itself is “not statistically significant” and yet you assume it as a prior. Your statement is a self-parody.

Reply to  Frank
October 3, 2014 2:50 pm

Frank need not apologise that the Pause is not statistically significant. No claim was made that it was. However, like it or not the Pause is significant in itself. It was not predicted. It has provoked dozens of attempted explanations. The simplest of these is that the models overestimate climate sensitivity.

rd50
Reply to  Frank
October 3, 2014 3:26 pm

Statistical significance is not the issue here. There is NO change up or down during this period. There is no increase or decrease from one end to the other. The issue is, simply, “does CO2 increases drives the temperature”. If yes, then we should (must?) act to reduce it or at least keep it from increasing since apparently “warming” will be bad.
Not sure that I agree that it would be bad to have higher CO2 (CO2 is an essential plant fertilizer as we all know) and very slightly higher temperature may not be very bad (talk to the Canadians), but this IS the issue and it is a political issue. We must reduce fossil fuels use for energy because the CO2 emitted from burning them will create global warming, this is the claim.
But what if CO2 does not drive up temperature?
So, look at this site for the correlations between CO2 and temperature.
http://www.climate4you.com/
CO2 has been increasing, around 290 ppm in 1990 to 400 ppm now, just one of many examples presented there.
So, temperature should have been increasing. It did from 1980 to 2001. However, no more increase in temperature after this. See Figure item 20080927 at the above site as well as several other figures.
You will see that increases in CO2 had negative, neutral or positive influences on temperature at various time intervals. No statistical analysis needed! It is obvious. Just look at the graphs. However, because we see negative, neutral or positive “influences” these correlations are interesting but not much more since CO2 cannot be a major driver of temperature, we all know this.
Also at this site there is an interesting plot of CO2 (Mauno Loa ppm) vs HadCRUT4 temperature anomalies presented with a polynomial fit:degree =5. Read how the author interpreted this graph, very interesting (yes there is quite a bit of variation). Again it seems that CO2 had different effects (as noted above in other graphs).
So the bottom line now is that CO2 does not look to be very important in producing global warming. However it is very important for food production and reforestation, this issue was settle long ago.

Patrick Maher
Reply to  rd50
October 4, 2014 12:14 am

Well said.

October 3, 2014 8:19 pm

Thanks, Christopher, Lord Monckton.
And the pause goes on …
And now I’m thinking that Dr. David Evans is on to something. But, being an electronics engineer I could be suffering from “affinity bias”. But, I don’t like the cold.

CodeTech
October 3, 2014 9:52 pm

It’s not a “pause”.
Unfortunately, it’s a Peak. And that means that most likely for the rest of my life I will be descending into the next cold phase. And yet, I am 100% certain that these same people will be telling me it’s caused by human activity, and the only way to save the planet will be to stop using fossil fuels.

Patrick Maher
October 4, 2014 12:04 am

It’s clear looking at recent and historical records that temperature does not follow changes in co2.
In fact, there is no scientifically significant evidence demonstrating that co2 is either a primary or even a secondary factor in climate change. Any argument that doesn’t raise the question of conclusive scientific evidence is extraneous. Unless or until someone can provide conclusive, empirical evidence that co2 is a major driver of climate, AGW remains an unproven hypothesis at best. It certainly does not qualify as settled science. Considering the massive amounts of time, effort and money that have been spent trying to find proof without result, it doesn’t even qualify as a proper theory.
Show us conclusive evidence directly linking co2 and AGW and we’ll go away. The burden of proof is on you to prove your hypothesis. It does not rest with others to disprove it.
You can call me names and make fun of me now. That’ll show me who knows best. I’m easy to find. After the flat earth society meeting I’ll be at the moon landing denier convention. That’s if the “I prefer having a dentist operate” meeting doesn’t run long.

October 4, 2014 2:53 am

RSS and UAH are direct competitors for government dollars. Therefore, take what each says about the other with a big grain of salt.
And satellite data is the most accurate, because it measures most of the planet. Land based measurements only cover 29%.

RACookPE1978
Editor
Reply to  dbstealey
October 4, 2014 3:11 am

dbstealey
October 4, 2014 at 2:53 am
RSS and UAH are direct competitors for government dollars. Therefore, take what each says about the other with a big grain of salt.

Rather: Allow – no REQUIRE – them to continue to compete with one another to ensure there ARE checks and balances.

And satellite data is the most accurate, because it measures most of the planet. Land based measurements only cover 29%.

And 1000 surface thermometers measure only 50 feet around that poorly sited, semi-randomly-located set of 1000 thermometers, parking lots, air conditioners, buildings and trees…..

lester
October 4, 2014 5:38 am

Even if the climate had warmed over the last 19 years there would be no proof that it had anything to do with CO2.

October 4, 2014 11:37 pm

[Snip. Enough with the “denialist” pejoratives. Read the site Policy. ~mod.]

October 5, 2014 6:43 am

comment image
I decided to start a regular exercise routine and graph my progress with respect to weight loss. As I was reviewing the above graph, I saw the contrast between the longer term trend of my body mass, with its day-to-day variability and it reminded me of one of the typical sources of climate change related misunderstanding.
Analogous to challenge of trending climate parameters, I saw how tempting it was to confuse a long-term deterministic influencers of my body mass (caloric intake and expenditure) with the superimposed short-term stochastic influencers of my body mass (timing of meals, bathroom breaks & variable clothing weight).
So in this post I won’t try to convince folks that it is misleading to exaggerate the significance of an 18-year surface temperature subset that’s within an unambiguous >130-year positive trend, especially one containing many such short-term plateaux. Not mentioning that there’s been no pauses in other climate parameters like ocean heat content rise, accelerated global ice mass reduction, sea level rise.
But rather I’ll apply the same logic used in this WUWT article to an analogous system (body mass variation due to diet/exercise). Try to see the flaw in the logic applied below:
A Diet ‘Skeptic’ might say…
…you were heavier in the distant past when you were exercising more, therefore exercise does not correlate with weight loss.
…your digital balance is untrustworthy because it was purchased from Bed, Bath and Beyond (97% political contributions to democrats): Lib Conspiracy
Source: http://www.freerepublic.com/focus/bloggers/2974029/posts
…an 8-day diet study showed a weight gain of 2.4 lbs, showing exercise does not correlate with weight loss.
…there are too many uncertainties since weight measurements don’t account for sock weight.
…there are times where exercise lagged weight loss.
…sock weight governs weight loss.
…The science is not settled.
…Dr. Frank Oz says…
Source: http://www.sciencebasedmedicine.org/dr-oz-and-green-coffee-beans-more-weight-loss-pseudoscience/
…gaining weight is good for you
Source: http://www.dailymail.co.uk/health/article-2651195/Why-FAT-good-A-controversial-book-doctor-claims-overweight-help-fight-disease-live-longer.html
Hanzo

Reply to  katatetorihanzo
October 5, 2014 1:30 pm

A more accurate analogy than your diet analogy:
I am 6’2″ tall. That means I am taller now than ever before. Why, at this rate, I might be 7’8″ tall in another decade! I’ll need a whole new set of clothes.
Or, I may just be as tall as I will ever be. And global T might just be as high as it will be in our lifetimes, and in our great-great-grandchildren’s lifetimes.
My analogy beats yours hands down, because it reflects the current situation.

Richard M
Reply to  katatetorihanzo
October 5, 2014 5:39 pm

katatetorihanzo … The essential question is whether 18 years is long enough to assess human influence on climate. The rest of your hand waving is meaningless drivel. According to Santer et al (2011).
“Our results show that temperature records of at least 17 years in length are required for identifying human effects on global‐mean tropospheric temperature.”
So, we can assess the human influence over 18 years and it is non-existent. I really doubt this will change your view because it is science based and you are clearly driven by “faith”.

Reply to  Richard M
October 6, 2014 9:06 am

Hi Richard:
I left the same response to the guest blogger. Weather and volcanic activity are stochastic relatively short-term events (random, trendless). Their effects on global mean temperature usually cancel out in 17-30 year datasets, revealing the deterministic cause for the trend (GHG forcing). However any short-term trend can contain combinations of interannual natural variation that could misleadingly skew the trend.
The trend slope of the 1996-2014 RSS dataset is PARTICULARLY sensitive to its start date. A reliable trend does not change much if you had a few years of data. In the following Wood For Trees overlay, I followed how the trend changed markedly by contrasting the 1992-2014 RSS dataset (22 y) with the 1996-2014 dataset (18 y).
I challenge you to justify why the 18 y dataset is preferred over the 22 y dataset. In fact, why not use the largest dataset available, which for RSS is ~34 y? Or better yet, why not filter out the well characterized effects of ENSO, solar and volcanic activity and see what’s left. If it’s all natural (non-GHG), you shouldn’t see ANY trend.
http://woodfortrees.org/plot/rss/from:1975/to:2014.75/mean:12/plot/rss/from:1996.75/to:2014.75/trend/plot/rss/from:1995/to:2014.75/trend/plot/rss/from:1994/to:2014.75/trend/plot/rss/from:1993/to:2014.75/trend/plot/rss/from:1992/to:2014.75/trend/plot/rss/trend
I think Foster and Rahmstorf (2011) filtered out the short-term natural variations:
http://static.skepticalscience.com/pics/FR11_All.gif
Educate me. How am I wrong here?
Hanzo

Jimbo
Reply to  katatetorihanzo
October 6, 2014 6:57 am

Not mentioning that there’s been no pauses in other climate parameters like ocean heat content rise, accelerated global ice mass reduction, sea level rise.

You do know when sea level started rising? Why have we not seen an acceleration in the rate of global mean sea level rise? After all you do say: “accelerated global ice mass reduction”.

Abstract – 23 February 2011
Sea-level acceleration based on US tide gauges and extensions of previous global-gauge analyses
It is essential that investigations continue to address why this worldwide-temperature increase has not produced acceleration of global sea level over the past 100 years, and indeed why global sea level has possibly decelerated for at least the last 80 years.
http://www.jcronline.org/doi/abs/10.2112/JCOASTRES-D-10-00157.1
==================
Abstract – July 2013
Twentieth-Century Global-Mean Sea Level Rise: Is the Whole Greater than the Sum of the Parts?
………..The reconstructions account for the observation that the rate of GMSLR was not much larger during the last 50 years than during the twentieth century as a whole, despite the increasing anthropogenic forcing. Semiempirical methods for projecting GMSLR depend on the existence of a relationship between global climate change and the rate of GMSLR, but the implication of the authors’ closure of the budget is that such a relationship is weak or absent during the twentieth century.
American Meteorological Society – Volume 26, Issue 13
http://dx.doi.org/10.1175/JCLI-D-12-00319.1
==================
Abstract – January 2014
Global sea level trend during 1993–2012
[Highlights
GMSL started decelerated rising since 2004 with rising rate 1.8 ± 0.9 mm/yr in 2012.
Deceleration is due to slowdown of ocean thermal expansion during last decade.
• Recent ENSO events introduce large uncertainty of long-term trend estimation.]
… It is found that the GMSL rises with the rate of 3.2 ± 0.4 mm/yr during 1993–2003 and started decelerating since 2004 to a rate of 1.8 ± 0.9 mm/yr in 2012. This deceleration is mainly due to the slowdown of ocean thermal expansion in the Pacific during the last decade, as a part of the Pacific decadal-scale variability, while the land-ice melting is accelerating the rise of the global ocean mass-equivalent sea level….
http://www.sciencedirect.com/science/article/pii/S0921818113002397

Reply to  Jimbo
October 6, 2014 8:24 am

Sea level is highly variable since it is a measurement of a highly mobile fluid that is subjected to many short-term influences including tides, winds, ENSO and precipitation patterns. All of this variability tends to obscure the deterministic trends of thermal expansion and land ice melt.  Accordingly, multi-decadal data show a positive trend, but only century-scale data reveals the sea level acceleration. 
1) “geological observations indicate that during the last 2,000 years, sea level change was small, with an average rate of only 0.0–0.2 mm per year.”
2) sea level rose 6 cm during the 19th century 
3) sea level rose 19 cm in the 20th century.
Source: http://en.m.wikipedia.org/wiki/Current_sea_level_rise#Short-term_variability_and_long-term_trends
More to the point, a world that is NOT warming would not have have ANY sea level rise nor global ice mass decrease.
Hanzo

Reply to  Jimbo
October 6, 2014 9:42 am

Hanzo’s latest excuse:
Sea level is highly variable…<
He will never run out of excuses for why the planet is contradicting his belief system.

milodonharlani
Reply to  Jimbo
October 9, 2014 4:31 pm

katatetorihanzo
October 6, 2014 at 8:24 am
The issue is not whether the world is warmer now than 320 or 160 years ago, which it does appear to be (but probably not than 80), but whether human activities have contributed to making it warmer.
It’s also not clear that global ice mass is less now than during the recent PDO-influenced natural warming of 1977-96. The majority of the world’s freshwater & ice are locked in the East Antarctic Ice Sheet, which is gaining mass, & in any case stopped retreating over 3000 years ago. The longterm T trend on earth (3000 years) is still cooling.

milodonharlani
Reply to  Jimbo
October 9, 2014 4:37 pm

katatetorihanzo
October 6, 2014 at 8:24 am
The issue is not whether the world is warmer now than 320 or 160 years ago, which it does appear to be (but probably not than 80), but whether human activities have contributed to making it warmer.
It’s also not clear that global ice mass is less now than during the recent PDO-influenced natural warming of 1977-96. The majority of the world’s freshwater & ice are locked in the East Antarctic Ice Sheet, which is gaining mass, & in any case stopped retreating over 3000 years ago. The long term T trend on earth (3000 years) is still cooling.

October 5, 2014 9:29 am

Replacing all 1998 values with .55 had negligible effect because the RSS figure for 1998 was .55. And if one looks at a graph of RSS for the whole period from 1979 to now, it is apparent that the 1998 El Nino spiked from a lower baseline than the 2010 one, and the pause started in 2001.

Reply to  Donald L. Klipstein
October 5, 2014 9:43 pm

There were of course 12 monthly values in the RSS data: there is no single “RSS figure for 1998” in the monthly dataset I used. And those values went up to well above .8. Making all 12 values 0.55, equal to the 2010 el Nino at the other end of the graph, demonstrates neatly that the influence of the 1998 el Nino is indeed more or less exactly balanced by the influence of the 2010 el Nino when calculating the trend. Accordingly, it is not unfair or distorting to calculate a least-squares linear-regression trend on data starting in a year (such as 1996) that is close to the 1998 el Nino.

Reply to  Monckton of Brenchley
October 6, 2014 7:13 am

The essential problem in this WUWT article is that the trend slope of 1996-2014 RSS data set is sensitively influenced by its start date. 
Why? Because the start of the trend is dominated by an anomalously strong El Niño (1998) and its terminus is dominated by La Nina conditions. This exerts a misleading leverage to the trend line reminiscent of the outliers that plague other types of regression analyses:
http://polisci.msu.edu/jacoby/icpsr/regress3/lectures/week3/11.Outliers.pdf
Proof:  If zero-trend line slope generated by the linear least-squares regression were robust, then the magnitude of that slope should not be so sensitive to a relatively small change in the starting year.
Please review the following Wood For Trees overlay and consider how rapidly (within just 4- years) the ‘zero-trend’ corrects to a positive trendline slope that is more representative of the larger dataset.  
Hanzo

Reply to  Monckton of Brenchley
October 6, 2014 7:19 am

(with the plot)
The essential problem in this WUWT article is that the trend slope of 1996-2014 RSS data set is sensitively influenced by its start date. 
Why? Because the start of the trend is dominated by an anomalously strong El Niño (1998) and its terminus is dominated by La Nina conditions. This exerts a misleading leverage to the trend line reminiscent of the outliers that plague other types of regression analyses:
http://polisci.msu.edu/jacoby/icpsr/regress3/lectures/week3/11.Outliers.pdf
Proof:  If zero-trend line slope generated by the linear least-squares regression were robust, then the magnitude of that slope should not be so sensitive to a relatively small change in the starting year.
Please review the following Wood For Trees overlay and consider how rapidly (within just 4- years) the ‘zero-trend’ corrects to a positive trendline slope that is more representative of the larger dataset.  
http://woodfortrees.org/plot/rss/from:1975/to:2014.75/mean:12/plot/rss/from:1996.75/to:2014.75/trend/plot/rss/from:1995/to:2014.75/trend/plot/rss/from:1994/to:2014.75/trend/plot/rss/from:1993/to:2014.75/trend/plot/rss/from:1992/to:2014.75/trend/plot/rss/trend
Hanzo

Reply to  Monckton of Brenchley
October 6, 2014 9:50 am

Well, of course the chart will show that. If you go back far enough you can see global warming. And you can show chart difference no matter what the database, when you use various start years. Your chart simply demonstrates that fact.
Start them all with either 1997 [Phil Jones] or 2005. Using a lot of different years is like averaging. It doesn’t tell you anything.
No one here says that global warming hasn’t happened. The planet is still recovering from the LIA.
But until you provide at least one measurement quantifying the amount of global warming due to human emissions, you are doing nothing but asserting AGW. Instead, show us a measurement.

Admad
October 5, 2014 10:03 am

Jimbo
October 6, 2014 8:00 am

Hanzo, please reply to my last comment here. I asked 2 questions:

You do know when sea level started rising? Why have we not seen an acceleration in the rate of global mean sea level rise? After all you do say: “accelerated global ice mass reduction”.

Take a look at the abstracts first before responding.

October 6, 2014 10:42 am

[snip you’ve reached troll level, fake name “secret” website, making up data that doesn’t exist – go elsewhere to spin your yarns, because you are just wasting everyone’s time here and time spent moderating your fake invented data is time I don’t have anymore. If you want to post under your real name, fine then but we aren’t going to waste time battling fake named people anymore.
I’m also not interested in your response, so save it. If you want to publish with your name here, welcome. Otherwise we’re done. -Anthony]

DavidG
October 6, 2014 6:24 pm

Are you the namesake of, I believe, the former Equerry of the duke of Windsor, who forced him to stop the Nazi coddling back in 1941?

Reply to  DavidG
October 7, 2014 3:18 pm

I’m the grandson of Walter Monckton, the adviser (not equerry) to King Edward VIII / the Duke of Windsor.

October 7, 2014 3:25 pm

If Hanzo-san would actually read the head posting he would find that I have performed an experiment that has debunked the notion that the 1998 el Nino exerts an undue influence to flatten the least-squares linear-regression trend-line. It is more or less exactly offset by the 2010 el Nino, so starting in 1996 is entirely fair and reasonable, and does not lead to any appreciable distortion.
One of the weaknesses of least-squares regression to a line is that the residuals (i.e. the differences between the data points and the regression line) become more influential the further away from the line they are. This problem arises because there is no formula for calculating a line based on least differences, so the formula for calculating on the basis of squared differences is used. Fortunately the 2010 el Nino is correctly positioned at present to offset very nearly all the distorting effect of the 1998 el Nino – and, as the head posting also points out, the sheer length of the Pause also helps.
The climate communists would carry more weight if they accepted that global warming has not been happening at even half the predicted rate, and that in the past decade or two it has not been happening at all. They undermine what little credibility they have left by their ingenious wrigglings, duckings and divings to avoid the plain truth that is staring them in the face. The models were wrong.

October 7, 2014 3:29 pm

Mr Mosher, in suggesting that the atmosphere is not global, seems to be losing it. And it is not necessary for him to apply a least-squares linear-regression trend to the RSS data: if he prefers, he can simply use the Mk 1 Eyeball and see for himself that the trend has been flat for approaching two decades. Best not to wriggle, duck or dive, but to admit the plain truth. The models were wrong.

Janice the Elder
October 9, 2014 3:52 pm

I find it amusing that the warmistas are wringing their hands over the misfortune of not having any warming for this long period of time (relatively speaking, of course). If they were truly devious and conniving, they should have stepped up and said “See! We did it! All of that money that was poured into alternate energy has saved the day! We managed to avert a catastrophe! All of our models said the heat would keep going up if we didn’t change, but we changed it just enough to claim victory! Huzzah! Aren’t we great!? You should keep giving us money, now.” Maybe the warmistas are not as devious and conniving as I thought they were . . .

October 9, 2014 4:46 pm

Janice,
If they did that, it would be very hard to justify more funding. ‘Mission accomplished’ and all that.
Money and power are their goals. Glory takes a back seat, even if it was justified. Of course, it isn’t.