 (Perturbation Calculations of Ocean Surface Temperatures.)
Guest essay by Stan Robertson, Ph.D., P.E.
1. Introduction
It is generally conceded that the earth has warmed a bit over the last century, but it is not clear what has caused it, nor whether it will continue and become a problem for humanity. There is a possibility that some of the warming has been caused by anthropogenic greenhouse gases, but it is also likely that the sun has been partially responsible. The arguments that are advanced to say that humans caused it and that it will become a serious problem rely on models that have not been validated and positive feedback effects that have not been shown to exist, at least at the hypothesized levels of effectiveness. The apparent weakness in the argument that the sun has been a major contributor is that satellite measurements of Total Solar Irradiance (TSI) have not shown changes large enough to have directly produced the warming of the earth over the last half century. But what about indirect effects? Is it possible that the sun exerts control in some indirect way? In these notes I recapitulate the evidence that this is the case by showing that the variations of TSI cannot provide the energy that is necessary to account for the warming of the oceans during solar cycles.
TSI, as measured above the earth’s atmosphere varies by about 1.2 watt/m2 over a nominal eleven year solar cycle (h/t Leif Svaalgard) primarily at wavelengths shorter than 2 micron. The dominant harmonic variation of TSI would thus have an amplitude half this large, or about 0.6 watt/m2. About 70% of this enters the earth atmosphere. Averaged over latitudes and day/night cycles, about one fourth of this 70%, or ~0.11 watt/m2, on average, enters the upper atmosphere. Since only about 160 watt/m2 of 1365 watt/m2 of incoming solar radiation at wavelengths less than 2 micron reaches the earth surface, the amplitude of short wavelength TSI reaching the earth surface would be only (160/1365)x0.6 = 0.07 watt/m2. However, about half of the difference between 0.11 and 0.07 watt/m2 eventually reaches the earth surface as scattered thermal infrared radiation at wavelengths greater than 2 micron. Thus the average amplitude of TSI reaching the earth surface in all wavelengths would be about 0.09 watt/m2. So the question is, just how much sea surface temperature variation can this produce?
Several researchers, including Nir Shaviv (2008), Roy Spencer (see http://www.drroyspencer.com/2010/06/low-climate-sensitivity-estimated-from-the-11-year-cycle-in-total-solar-irradiance/) and Zhou & Tung (2010) have found that ocean surface temperatures oscillate with an amplitude of about 0.04 – 0.05 oC during a solar cycle. (In fact, all of the ideas that I am presenting here were covered in Shaviv’s work, but it has not gotten the attention that it deserves.) Using 150 years of sea surface temperature data, Zhou & Tung found 0.085 oC warming for each watt/m2 of increase of TSI over a solar cycle. Although not strictly sinusoidal, the temperature variations can be approximately described in terms of a dominant sinusoidal component of variation with an 11 year period. Thus the question to be answered at this point is, can 0.09 watt/m2 amplitude of variation of TSI entering the oceans produce temperature oscillations with an amplitude of 0.04 – 0.05 oC?
The answer to this question depends on the average thermal diffusivity of the upper oceans. That is an unknown, but not unknowable, quantity. Thermal diffusivity is the ratio of thermal conductivity to heat capacity. The upper 25 to 100 meters of oceans are well mixed by waves and shears. These are mixing zones with high thermal diffusivity and correspondingly small temperature gradients. Diffusivities are lower at greater depths. Bryan (1987) has found that thermal diffusivities ranging from 0.3 to 5 cm2/s are needed to account for the temperature profiles below the mixing zone. In my first trial calculations of the energy flux necessary to account for the temperature variations, I tried values of thermal diffusivity in the range 0.1 – 10 cm2/s and found that the TSI variations were generally inadequate to produce the sea temperature variations over a solar cycle. But there was wide variation of calculated energy flux. Larger values of thermal diffusivity required more heat because more was able to penetrate to the depths, but even for 0.1 cm2/s, the required input was double the TSI variations that reach the earth surface. Fortunately, there is a way to constrain both the value of the thermal diffusivity and the heat input. It consists of first matching the measured trends of surface temperatures and ocean heat content over time. Measurements of these were reported by Levitus et al. (2012) and are available from http://www.nodc.noaa.gov/OC5/3M_HEAT_CONTENT/ .
In the calculations described below, I have used the data from 1965 to 2012 for ocean depths to 700 meters. Sea surface temperatures and ocean heat content began to increase after 1965. Only about a third of the increase of heat content occurred at depths below 700 meter. Since little heat migrates below this depth over 11 year solar cycles, it is preferable to use the 0 – 700 m data for the purpose of calibrating the thermal diffusivity
2. Heat Transfer Perturbation Calculations
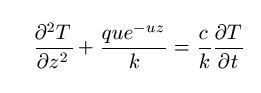
For the calculation of sea surface temperature and sea level changes, we can treat the variations of radiations entering and leaving atmosphere, lands and oceans as minor perturbations on an earth essentially in thermal equilibrium. Ocean mixing zones, thermoclines and other features of the temperature profiles remain largely as they were while small radiant disturbances produce minor variations of temperature starting from zero, and imposed at each depth. Thus the effects of these disturbances can be modeled as one-dimensional energy flows into a medium at uniform temperature. Such “perturbation calculations” are among the most powerful analysis techniques used by physicists and engineers and are widely used. The energy equation to be solved in this case is:
http://i1244.photobucket.com/albums/gg580/stanrobertson/equation_zpscea297ad.jpg

Where T is the temperature departure from equilibrium at depth , z, and time, t. q is a perturbing radiant flux entering the surface, u the absorption coefficient, c is absorber heat capacity and k its thermal conductivity. The rate of heat transfer by conduction processes is controlled by the thermal diffusivity, which is the ratio k/c.
As a one dimensional heat flow problem, it is straightforward undergraduate level physics or engineering to numerically solve the equation above for the expected changes of surface temperature as surface radiant flux varies. In my calculations, temperature changes were calculated for 1.0 meter increments of depth in the oceans. Two cases were considered. In one
case the surface radiation perturbation was assumed to increase linearly with time. This corresponds to the ocean conditions for the period 1965-2012. In the second case, it was assumed to vary as a cosine function of time with the 11 year period of the solar cycle. The cosine function provides both some positive and some negative variation in the first half cycle, which helps to minimize the transients of the first few years.
I treated q and thermal diffusivity, (k/c), as input parameters that were chosen to provide agreement with the observed sea surface temperature variations and ocean heat content measurements (https://www.ncdc.noaa.gov/ersst/ ). The absorption coefficient, u, was entered in piecewise fashion. Only the deep UV radiations penetrate to depths below 10 meter, but conduction takes energy to much greater depths. For the values of u chosen, only 44.5% of the surface energy flux goes deeper than 1 meter, 22.5% below 10 meter and 0.53% to 100 meter (h/t Leif Svalgaard). Thermal diffusivity of oceans was assumed to be 0.3 cm2/s below 300 m. This accords with Bryan’s estimates below the mixing zone, but little change of results occurred for values as low as 0.1 cm2/s. The required heat inputs are relativity insensitive to the thermal diffusivity below 300 meter. For the shallower depths, thermal diffusivity was varied until trends in accord with observed temperatures and heat content were produced.
It is necessary to maintain an energy balance at the sea surface in approximate equilibrium with the incoming solar radiation. As estimated by Trenberth, Fasullo and Kiehl (2009), about 160 watt/m2 enters the surface, on average. At a mean temperature of 288 oK, the sea surface will emit about 390 watt/m2 of surface thermal infrared radiation at wavelengths longer than about 2 micron, however, about 84% of that is returned as back scattered radiation. The rest of the energy balance is provided by evaporation and thermal convection, which remove about 59% of the heat from the surface. From the standpoint of merely wanting to know how much heat is required to change the ocean surface temperature, it is possible to maintain a proper energy balance without delving into the messy details of evaporation, convection and infrared absorption in the first few millimeters of water. The temperature variations at one meter depth will not be measurably different from those at the surface for the thermal diffusivities of interest here. If we merely want to know what net energy flux entering the surface is required to make the water temperature at one meter depth oscillate with an amplitude of 0.04 – 0.05 oC , then all we need to do is account for the outgoing surface infrared emission and let 41% (160 watt/m2 / 390 watt/m2 = 0.41) escape. At the present 288 oK, the earth radiates an additional 5.42 watt/m2 for each 1 oC increase of surface temperature. In the case of surface temperature being perturbed by 0.04 oC, an outgoing additional 0.22 watt/m2 would be generated and 0.09 watt/m2 was allowed to escape. This nicely balances the amplitude of TSI variations that reach the earth’s surface.
3. Linear heating:
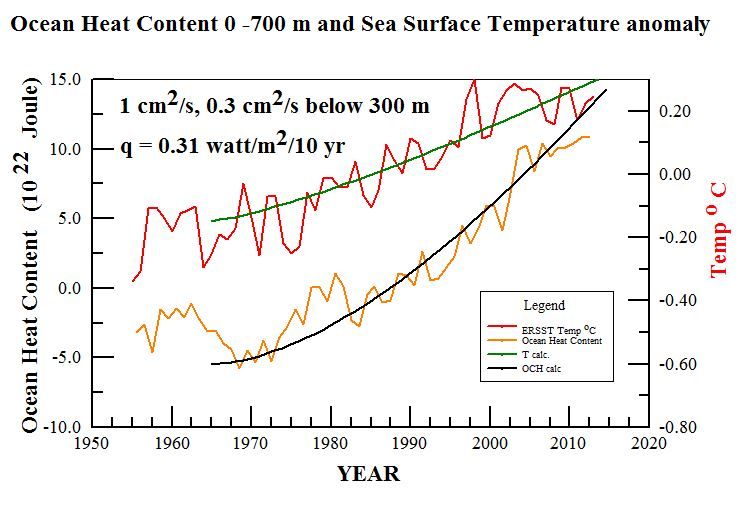
In these calculations, the aim was to find the heat input and thermal diffusivities necessary to account for the observed surface temperature increase (http://www.nodc.noaa.gov/OC5/3M_HEAT_CONTENT/ )Extended Reconstructed Sea Surface Temperature) and the increased ocean heat content (OHC 700) that have been reported by NOAA. Since surface temperatures had not been increasing in the early 1960s, but began to increase in the last half of that decade, I chose to start calculations with linearly increasing heating in 1965. I found that the ocean heat content to a depth of 700 meters was quite sensitive to the thermal diffusivity used. The best results that I have been able to obtain were for a thermal diffusivity of 1 cm2/s to 300 meter depth and surface heat input increasing at a rate of 0.31 watt/m2 per decade. These are shown on the graph below with calculated trends shown by the green and black lines. On a time scale of 50 years, most of the heat accumulates at relatively shallow depths. To better reflect a realistic thermal diffusivity for greater depths, I used a lower value of 0.3 cm2/s below 300 meter. That has little practical effect on a 50 year times scale, but would be necessary if one wanted to extend the calculations for several centuries while surface heating perturbations had time to penetrate to much greater depths.
http://i1244.photobucket.com/albums/gg580/stanrobertson/OHC700_zpsb9e34e91.jpg

Figure 1. Ocean heat content 0 – 700 meter and surface temperature trends according to NOAA. Blue and green lines show trends calculated for the parameters shown.
These calculations establish some parameters that do a good job of representing the thermal behavior of the upper oceans, however, if one looks closely at the data trends in the graph, it is apparent that both surface temperature and ocean heat content have considerably slowed their rates of increase in the last decade. This makes it unlikely that greenhouse gases are the cause of the rate of heating needed to explain the previous trends because their effects should have become enhanced rather than diminished. It might also be noted that a similar warming trend occurred in the first half of the previous century before anthropogenic greenhouse gases could have contributed significantly. Thus it is more likely that both warming periods had natural origins.
Obtaining simultaneous fits to the ocean heat content and sea surface temperature trends with only two free parameters, thermal diffusivity and surface heating rate, is quite confining. Acceptable, but noticeably worse, fits than shown above, were obtained with thermal diffusivities ranging from 0.8 to 1.2 cm2/s and heat inputs ranging from 0.29 to 0.33 watt/m2. Based on previous calculations for sea level data, I was initially inclined to think that larger thermal diffusivities would be necessary, but larger values let more heat penetrate to greater depths than the amounts of heat reported by Levitus et al. In addition, I was chagrined to learn that most of the variation of sea level that accompanies solar cycles is caused by evaporation rather than thermal expansion.
Solar Cycles:
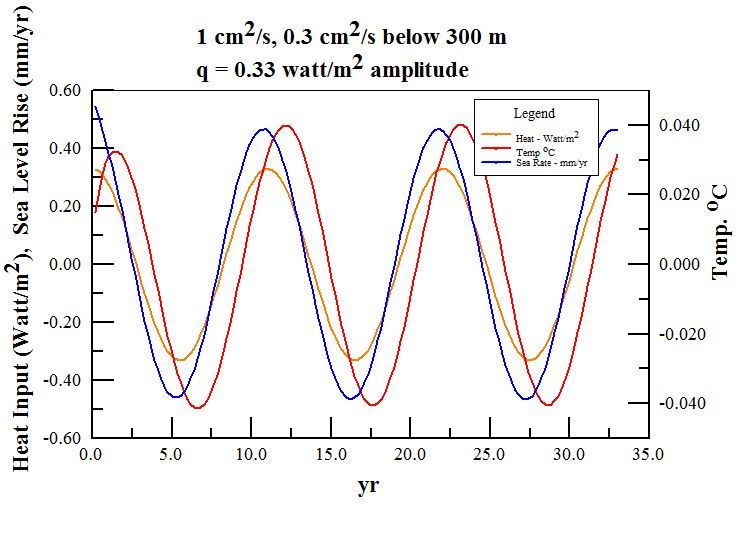
The process of choosing thermal diffusivity and surface heating rates to accord with observations provides a sound basis for calculating what to expect for the temperature variations during solar cycles. In this case we can use the thermal diffusivity of 1 cm2/s that is required of the ocean heat content results as an input parameter and choose the heat input that is required to produce temperature variations of 0.04 – 0.05 oC amplitude. Producing sea surface temperature variations with an amplitude of 0.04 oC requires a surface heat input of 0.33 watt/m2, as shown below:
http://i1244.photobucket.com/albums/gg580/stanrobertson/solarcycle10_zpsa3b8b0ee.jpg

Figure 2. Radiant flux, ocean temperature oscillations, and sea level variations for three solar cycles of eleven years each. The entering flux shown here is the value of q = 0.33 watt/m2 needed to drive the variations of surface temperature of 0.04 oC with ocean thermal diffusivity of 1.0 cm2/s to depth of 300 m. The amplitude of thermosteric rate of change of sea level was 0.47 mm/yr. Temperature lags the driving energy flux by 15 months. The thermal expansion coefficient of sea water used here was 2.4×10⁻⁴/ oC.
I believe that this settles the issue of what is required to produce sea surface temperature oscillations with an amplitude of 0.04 oC. The solar TSI variations that reach the earth’s surface are smaller than the 0.33 watt/m2 needed to account for sea surface temperature variations by a factor of 3.6 for this smallest estimate of sea surface temperature variability.
Although the estimated 0.33 watt/m2 that is required to explain the surface temperature variations is large compared to the amplitude of TSI variations that reach the surface, it is still only about two parts per thousand of the 160 watt/m2 of solar UV/VIS/NIR that reaches the earth surface. There are many possible ways in which the sun might modulate the surface energy flux to this extent. These include modulation of cloud cover and small spectral shifts in the energetic UV that might modulate ozone absorption or produce shifts of the effective sea surface albedo. It would seem to be a fairly direct radiative effect, rather than feedback, since it must vary in phase with the solar cycle.
In summary, my calculations based on energy conservation considerations imply that the sun modulates the ocean temperatures to a much greater extent than can be provided solely by its TSI variations. The great question that desperately needs an answer is how does it do it? It should be easily understood that solar effects would not necessarily be confined to cycles. More likely, the sun has been the driver of the large changes of temperatures of the Roman and Medieval warm period, the Little Ice Age, and the recent recovery from it without requiring large changes of its own irradiance. When we understand how the sun does this, we will have begun to understand the earthly climate.
###
Biographical note:
Stan Robertson, Ph.D, P.E, retired in 2004 after teaching physics at Southwestern Oklahoma State University for 14 years. In addition to teaching at three other universities over the years, he has maintained a consulting engineering practice for 30 years.
References:
Bryan, F., 1987: Parameter Sensitivity of Primitive Equation Ocean General Circulation Models. Journal of Physical Oceanography, 17, 970-985. (PDF available here http://journals.ametsoc.org/doi/abs/10.1175/1520-0485%281987%29017%3C0970%3APSOPEO%3E2.0.CO%3B2
Levitus, S. et al., 2012 World ocean heat content and thermosteric sea level change (0–2000 m), 1955–2010, Geophysical Research Letters, 39, L10603, doi:10.1029/2012GL051106, 2012 http://onlinelibrary.wiley.com/doi/10.1029/2012GL051106/abstract
Shaviv, Nir 2008, Using the oceans as a calorimeter to quantify the solar radiative forcing, Journal of Geophysical Research, 113, A11101 http://www.sciencebits.com/files/articles/CalorimeterFinal.pdf
Trenberth, K., Fasullo, J., Kiehl, J. 2009: Earth’s Global Energy Budget. Bull. Amer. Meteor. Soc., 90, 311–323. doi: http://dx.doi.org/10.1175/2008BAMS2634.1 www.cgd.ucar.edu/staff/trenbert/trenberth.papers/TFK_bams09.pdf , Fig. 1
Zhou, J. and Tung, K. ,2010 Solar Cycles in 150 Years of Global Sea Surface Temperature Data, Journal of Climate 23, 3234-3248 http://journals.ametsoc.org/doi/abs/10.1175/2010JCLI3232.1
The solar TSI variations that reach the earth’s surface are smaller than the 0.33 watt/m2 needed to account for sea surface temperature variations by a factor of 3.6 for this smallest estimate of sea surface temperature variability.
So, in normal science, that falsifies the assumption that solar variations are the cause.
For a start, here’s 50 papers describing potential solar amplification mechanisms
http://hockeyschtick.blogspot.com/search?q=solar+amplification&max-results=50&by-date=true
TSI variations, Leif.
So, in normal science, that falsifies the assumption that solar variations are the cause.
Maybe in Post-Normal Science it does.
Leif is thinking in top-down one-dimensional terms, believing that the TSI must be equivalent to a direct dial control on sea surface temperature in order for the sun to drive ocean oscillations. But clearly that is not the case, given the cyclic nature of solar and planetary orbital dynamics and the complex behavior that the sun demonstrates over time.
As many wiser people than myself have said, solar scientists do not know what the hell they are doing.
Hockey Schtick says:
October 10, 2013 at 3:16 pm
For a start, here’s 50 papers describing potential solar amplification mechanisms
None of those explain how 3.6 times more heat reach the surface than the variation of what the Sun puts out…Otherwise the climate system would be a nifty energy producer: you put 10 units in and you get 36 out. I want one of those 🙂
lsvalgaard says:
October 10, 2013 at 3:03 pm
The solar TSI variations that reach the earth’s surface are smaller than the 0.33 watt/m2 needed to account for sea surface temperature variations by a factor of 3.6 for this smallest estimate of sea surface temperature variability.
So, in normal science, that falsifies the assumption that solar variations are the cause.
————————————–
It would if the climate where as simple as only being composed of sun and ocean. But it’s not. There are additional factors at play, such as cloud cover, stoot, CFCs, etc.
Pat Frank says:
October 10, 2013 at 3:20 pm
TSI variations, Leif.
We are talking Wattage here. There are almost no energy in the non-TSI variations.
lsvalgaard says:
October 10, 2013 at 3:25 pm
Pat Frank says:
October 10, 2013 at 3:20 pm
TSI variations, Leif.
We are talking Wattage here. There are almost no energy in the non-TSI variations.
—————————————————
Dr. Svalgaard, even AGW folks say the heat being trapped by CO2 comes from the sun.
If the heat is not originating from the sun, where is it coming from? The Earth’s core?
Magicjava says:
October 10, 2013 at 3:32 pm
If the heat is not originating from the sun, where is it coming from? The Earth’s core?
More likely the calculation is wrong. Where do think the heat is coming from [if you accept the calculation: 10 units in 36 units out – I want such a heat engine]
“These include modulation of cloud cover and small spectral shifts in the energetic UV that might modulate ozone absorption or produce shifts of the effective sea surface albedo.”
Why not both (or all) of the above, among other effects?
Modulation of cloud cover could be by both solar radiance & magnetic flux. The UV energy shifts could affect both ozone absorption & sea surface albedo. There doesn’t need to be One Big Solar Effect on the climate system.
“Climate science” needs more observation & experiment & less CACA-based, GIGO modeling.
milodonharlani says:
October 10, 2013 at 3:38 pm
Why not both (or all) of the above, among other effects?
Explain how any or all of these can supply 3.6 times MORE energy than the variation of the TOTAL energy received from the sun.
“If the heat is not originating from the sun, where is it coming from? The Earth’s core?”
90 million+ barrels per day, Billions of CF Nat gas, Nuclear reactors and wood being burned.
In 2008 when the economy came to a halt global temps reflected that with a big dip in temps.
Everyone says that the heat source other then the sun can not effect temperatures some but I feel otherwise.
TSI Reconstructed chart from 1610-2012
http://lasp.colorado.edu/lisird/tsi/historical_tsi.html
Here’s one of many papers on “global brightening” demonstrating large changes in surface solar radiation due to changes in cloud cover
New paper finds increase in US sunshine has had 4.4 times more effect than greenhouse gases since 1996
A paper published today in the Journal of Geophysical Research – Atmospheres finds that due to a decrease in cloud cover, solar radiation has significantly increased over the US from 1996 to 2011. The authors note the change in longwave (infrared) surface radiation “dwarfs the [alleged contribution] from the increase of CO2 during the analysis period.” According to the paper, the natural variability due to changes in sunshine has had 4.4 times greater effect on surface radiation than increased greenhouse gases since 1996 [6.6/1.5 = 4.4]. According to the authors,
“The network average total surface net radiation increases by +8.2 Wm−2 per decade from 1996 to 2011. A significant upward trend in downwelling shortwave [solar radiation](SW-down) of +6.6 Wm−2 per decade dominates the total surface net radiation signal. This [brightening of solar radiation] is attributed to a decrease in cloud coverage, and aerosols have only a minor effect. Increasing downwelling longwave [radiation from greenhouse gases](LW-down) of +1.5 Wm−2 per decade and decreasing upwelling LW [infrared radiation from the Earth surface] (LW-up) of −0.9 Wm−2 per decade produce a +2.3 Wm−2 per decade increase in surface net-LW, which dwarfs the expected contribution to LW-down from the 30 ppm increase of CO2 during the analysis period. The dramatic surface net radiation excess should have stimulated surface energy fluxes, but, oddly, the temperature trend is flat.”
The paper adds to many other peer reviewed papers documenting a global decrease in cloud cover or ‘global brightening’ over various periods and locations beginning the the 1980’s. This decrease in cloud cover alone could account for all global warming observed since the ice age scare of the 1970’s.
http://hockeyschtick.blogspot.com/2013/01/new-paper-finds-increase-in-us-sunshine.html
lsvalgaard says:
October 10, 2013 at 3:41 pm
IMO, small variations at critical junctures in the climate system can produce out-sized results. This possibility hasn’t been thoroughly studied because of the false dominant paradigm of the One Big Gas.
For example, small changes in orbital parameters cause or contribute critically to shifts from glacial to interglacial conditions.
Also, magnetic effects are only indirectly linked to TSI, although perhaps more strongly to the variation in high energy UV. You could enlighten me on this point.
Thanks for your past comments on the possible effects of UV directly on the oceans, but IMO there are still lots of possibilities worth investigating. Science has historically been full of surprises & strongly-held certainties frequently overthrown by better analysis & discovery of more information.
Thank you Dr. Svalgaard and njsnowfan for both giving me something to think about.
milodonharlani says:
October 10, 2013 at 3:52 pm
Science has historically been full of surprises & strongly-held certainties frequently overthrown by better analysis & discovery of more information.
I’m not discussing this in general [and this is all the other people trotting out their usual stuff], but let us stick to the article if this thread: it claims that 0.33 W/m2 input is required and notes that TSI only provides 3.6 times as little, or 0.09 W/m2. How can that work? what discovery awaits us that can provide 3.6 times more energy than supplied by the variation of TSI? The Sun cannot, the deep ocean might, or the calculation is wrong.
@njsnowfan says:
October 10, 2013 at 3:43 pm
Have you computed the total of energy produced by human activities & compared that with TSI? Or with volcanoes? Or the internal heat generated by our planet?
The financial crisis began in Aug or Dec 2007 & lasted until June 2009. Have you computed the amount of energy not produced as a result of the recession of 2007-09? Are you aware that a La Niña also developed in mid-2007 and lasted almost until 2009? IMO hard to separate out the natural from any possible economic effects.
Leif is a broken record. Let him carry on with his crusade, while the solar/climatic connection evidence keeps mounting with each passing day.
It is ashame his potential talents in this area are being wasted.
lsvalgaard says:
October 10, 2013 at 3:41 pm
milodonharlani says:
October 10, 2013 at 3:38 pm
Why not both (or all) of the above, among other effects?
Explain how any or all of these can supply 3.6 times MORE energy than the variation of the TOTAL energy received from the sun.
Dr. Svalgaard, it seems you’re arguing just for the sake of arguing. More cloud cover vs less cloud cover easily can mean 3.6 times MORE/LESS energy than the VARIATION in solar radiation. More radiation isn’t being produced – more/less is getting through.
lsvalgaard says:
October 10, 2013 at 4:01 pm
I don’t know. Any speculation would be pure guesswork on my part, without the ability to support it. Maybe Dr. Roberston can provide an answer to your good question.
Lord Kelvin was sure the earth had to be less than 100 million years old, based upon thermodynamics. Then nuclear radiation was discovered.
As the Melancholy Dane said:
“There are more things in heaven and earth, Horatio,
Than are dreamt of in your philosophy.”
What if the heat is already there? Then it doesn’t have to diffuse. Cloud cover varies over the solar cycle. The oceans have an albedo of 5% so most visible light gets through and can get as far as 200 metres down.
@njsnowfan says:
Excellent point. How can the trace gas (0.039% of atmosphere) CO2 be the recognized cause of global warming while all of the energy released by human activities be ignored as a source of heat. The human race is one big UHI in some respects. More wars and a major plague would fix the problem. Just think how plants and wildlife would flourish without us pesky humans. Oh, wait. Who would plant the trees after forest fires, no fish and game department to help keep a wildlife balance, no more protection of endangered species from predation like sage grouse and raptors….never mind.
Also:
“It is generally conceded that the earth has warmed a bit over the last century, but it is not clear what has caused it, nor whether it will continue and become a problem for humanity.”
Since when has warmer been bad for life on this planet? Way better than colder for humans, historically.
Bob Shapiro says:
October 10, 2013 at 4:08 pm
More radiation isn’t being produced – more/less is getting through.
what gets through does not vary by a factor of 3.6 compared to what goes in. Explain to me how 0.09 W/m2 going in heats as much as 0.33 W/m2.
How good are we at measuring total TSI? Is it any better than how we measure the planet’s average temperature? Do the measurements account for all wavelengths? I guess I’m asking if the margin of error is known and if it is large or small.
My guess is that it is something to do with evaporation and clouds, with differential effects over different lattitudes under increased solar radiation.
The higher latitudes heat faster with increased solar radiation due to increased water vapour in the air and lessening cloud cover where humidity levels are low, whilst the tropics dont heat much under the same conditions because more evaporation and clouds occur under higher humidity which act together as a buffer, with evaporation being endothermic and a negative feedback. Endothermic reactions are unusual and rare in nature, but might explain why the tropics dont warm much with either increased solar radiation or increased greenhouse gases. But where there is low humidity, solar effects are magnified because not much evaporation occurs, cloud cover is reduced with slight warming, and the extra water vapour acts as a greenhouse gas under those conditions, rather than as a negative feedback under high humidity conditions. This is similar to Eschenbach’s idea of tropical thunderstorms being a kind of thermostat.
lsvalgaard says:
October 10, 2013 at 3:41 pm
Explain how any or all of these can supply 3.6 times MORE energy than the variation of the TOTAL energy received from the sun.
————————————————————————————————————–
Because the measurements are at different places. TSI is measured at the top of the atmosphere, the energy “entering” the climate system is (essentially) at the bottom of it.
Many processes in the atmosphere itself affect how much of the TSI at the top gets to pass through to the bottom in order to be captured by the climate system. Much of the total available is rejected before it can warm anything. It’s entirely possible that the small variations in TSI affect that transmission in some way, possibly yet to be discovered, allowing more of the available energy to enter the system. That’s entirely different from saying that the variation itself is providing all the extra energy.
Although, there was absolutely no point in typing this because, by your logic, I’m afraid that you’ll never get to read it – all those transistors that will be switching large currents in response to small ones in order to transmit it from my keyboard to your screen simply can’t possibly work.
Hilarious
Louis says:
October 10, 2013 at 4:20 pm
How good are we at measuring total TSI?
VERY good: We can measure variations in TSI with a precision of 0.007 W/m2 out of 1361 W/m2 or as 10 feet on the distance between San Francisco and Los Angeles.
Do the measurements account for all wavelengths?
Yes, that is what the T in TSI stands for ‘Total Solar Irradiance’.
And, once again, we cannot forget (exclude) all of the “products” supplied by our Sun. TSI is only one in the basket.
As we all know that study solar/climate connections TSI is among the least important.
Joe says:
October 10, 2013 at 4:27 pm
Because the measurements are at different places. TSI is measured at the top of the atmosphere, the energy “entering” the climate system is (essentially) at the bottom of it.
The article says explicitly: “Thus the average amplitude of TSI reaching the earth surface in all wavelengths would be about 0.09 watt/m2″ so is at the ‘bottom’
Does TSI include the energy of the solar wind? What about coronal mass ejections?
geran says:
October 10, 2013 at 4:34 pm
And, once again, we cannot forget (exclude) all of the “products” supplied by our Sun. TSI is only one in the basket.
But is the one that has almost all the energy. So we still need to explain how 0.9 W/m2 can supply 0.33 W/m2.
As Svalgard suggests, some sort of amplification mechanism or some sort of coupled causation (ie- another factor that varies as TSI does, for example cosmic ray flux) is needed to obtain an additional twice as much energy imbalance.
But this is not much different from the CAGW proposition, whereby an hypothesized H2O feedback produces twice as much of an effect as the 1.2 degrees of warming that CO2 can be calculated to create per doubling of concentration. ie- not the 3, 4, or even 5 degrees that the IPCC deemed necessary to account for the late 20th century warming.
Leif does not give consideration to the potential secondary effects associated with changes in various solar parameters other then TSI.
For example the ap index versus surface temperatures give a strong correlation. The ACI/LOD index gives another strong correlation with temperature.
The ACI index in turn closely follows the activity of the sun, being more meridional during quiet periods ,and more zonal during active solar periods which has a big impact on the climate.
kent Blaker says:
October 10, 2013 at 4:36 pm
Does TSI include the energy of the solar wind? What about coronal mass ejections?
>>>>
TSI is total energy (E/M energy that can be easily converted to heat). Solar wind and CMEs are mass (particles) with high energy, but does not translate easily to heat (only collisions and nuclear transmutations).
Friends:
I think several people are missing the real issue here.
Leif Svaalgard is making the obvious point that TSI is an order of magnitude too small for it to have been the direct cause of the observed rise in global temperature. Hence, TSI is NOT the direct cause of that rise.
Others are saying that there may be mechanisms which amplify the direct effect of TSI and, of course, there may be. Hence, TSI may be the indirect cause of the observed rise in global temperature.
Both are right, but Leif Svaalgard has stated the clear and irrefutable evidence which demonstrates his point. The others have stated possibilities but they have not provided any evidence that demonstrates their point.
The onus is on those claiming a solar effect to demonstrate their claim. Attacking Leif Svaalgard’s point does not do that.
Please note that there are other possibilities for the cause(s) of the rise in global temperature. These possibilities include internal variation of the climate system such as variations in ocean heat transport causing redistribution of surface temperatures, and external variations such as the Svensmaark Effect which may alter cloud cover (n.b. this possible effect is galactic and not solar).
Hence, it is not sufficient to assert that the Sun is the cause. It is necessary to admit that nobody knows the true cause and to move on from there to assess each possibility on its merits.
Richard
The sun, the moon & the stars:
http://www.space.com/19786-cosmic-rays-origins-star-explosion.html
I didn’t know that the origin of GCRs was such a mystery, but a colleague of Dr. S’s at Stanford has solved it.
And let us not forget the planets & lesser bodies in orbit around the sun.
The terrestrial & extraterrestrial phenomena possibly or definitely affecting weather & climate to some extent haven’t all even been recognized yet, nor the relative importance of those which have been.
Nevertheless IPeCaC imagines its minions can realistically model the earth’s systems & make predictions (or projections) reliable enough for policy makers to base trillion-dollar decisions & risk the life, health & wealth of billions upon them. It would be to laugh were it not such a man-made catastrophe.
I’m reminded of the bootless War on Cancer waged in the 1970s before science knew very much at all about the disease(s). Arguably the greatest discovery in climatology in the shameless CO2-dominated sham paradigm period was the PDO, found accidentally in 1997 by a PNW fisheries researcher. Trillions of dollars wasted on worse than worthless “research” & the economy-destroying, deadly results of this anti-scientific fraud.
Whatever the faults of papers like Dr. Robertson’s may be, if any, at least it indicates that climate science might be waking up from its tax-funded binge since the 1980s. Alternative means of publishing scientific results or speculation such as this blog help revive real science, IMO, however out there some of the material posted here may be (often done so in order to subject it to ridicule, a point AW’s CACA critics often miss).
lsvalgaard says:
October 10, 2013 at 4:35 pm
Joe says:
October 10, 2013 at 4:27 pm
Because the measurements are at different places. TSI is measured at the top of the atmosphere, the energy “entering” the climate system is (essentially) at the bottom of it.
The article says explicitly: “Thus the average amplitude of TSI reaching the earth surface in all wavelengths would be about 0.09 watt/m2″ so is at the ‘bottom’
—————————————————————————————————————————–
That’s something I’d take issue with in the article. That figure is derived from TOA measurement using an implicit and unsupported (at least, within the article) assumption that the transmission efficiency remains constant as TSI varies.
That’s a massive assumption to be making in such a complex system, especially one where it’s so widely claimed that variations of a few hundreths of a percent in composition can have such profound effects on energy transmission.
Sauce for the goose & all that jazz 😉
Louis says:
October 10, 2013 at 4:20 pm
“How good are we at measuring total TSI? ”
Early satellites read absolute near 1367-8 and now it is accepted to be near 1361-2. Specs on these radiometers are (or were) available in user manuals on NASAs site with spec plates of 1% absolute accuracy with a much better repeatability. I have often wondered the same Louis. Let’s just say all of those readings that we have were adjusted to level the TSI (right or wrong). See TIM site at NASA I belive to show each satellite and what they were reporting.
Well how come CO2 is supposed to warm our planet, when it does not add even as much as 0.09wm/m2 to the budget
richardscourtney says:
October 10, 2013 at 4:48 pm
Rich, who made you the referee?
(Just funning, love your intelligent comments, just don’t get to “high and mighty” for us low-lifes.)
“””””…..@magicjava
If the heat is not originating from the sun, where is it coming from? The Earth’s core?……..”””””
We get NO HEAT from the sun’ there being no substantial physical medium connecting us together.
And even a type IIa diamond conduit between us would conduct a totally negligible amount of “heat”.
We make ALL of our heat, right here on earth by simply wasting the majority of the perfectly good Solar electromagnetic radiant energy that old Sol provides for our use.
We also get no LIGHT from the sun; ALL of that is made inside the human eye and brain, from a single octave sliver of the solar EM radiant energy spectrum.
Light is measured in “lumens” and “candelas” and such, which is quite different from the “Watts” and Joules etc that the sun sends us as EM radiation.
kent Blaker says:
October 10, 2013 at 4:36 pm
Does TSI include the energy of the solar wind? What about coronal mass ejections?
The energy in the solar wind is a million times smaller than TSI.
GlynnMhor says:
October 10, 2013 at 4:38 pm
cosmic ray flux) is needed to obtain an additional twice as much energy imbalance.
The energy of the cosmic rays is comparable to that of star light [from all the visible stars].
geran says:
October 10, 2013 at 4:47 pm
Solar wind and CMEs are mass (particles) with high energy, but does not translate easily to heat
They do. energy is energy. A piece of Radium is hot to hold in your hand [not to say dangerous].
george e. smith says:
October 10, 2013 at 4:57 pm
We get NO HEAT from the sun’ there
That explains why it takes so long to BBQ my steak. It gets no heat from the glowing coals…
geran says:
October 10, 2013 at 4:47 pm
Solar wind and CMEs are mass (particles) with high energy, but does not translate easily to heat
They do. energy is energy. A piece of Radium is hot to hold in your hand [not to say dangerous].
>>>>>
I think I dated her a few times back in college. Randy, Raney, Radium…something like that….
Since only about 160 watt/m of 1365 watt/m of incoming solar radiation at wavelengths less than 2
micron reaches the earth surface, the amplitude of short wavelength TSI reaching the earth surface would be only (160/1365)x0.6 = 0.07 watt/m .
A proper number would be 1000 w/m2 not 160. So 1000/1365 x .6 = .44 so more than enough.
My comment on all fuels burned daily worldwide and daily heat released. Mans heat release is a 24/7 operation into the air and waterways and does not stop and only slows when the economy does. Also mans world wide change of the landscape from water vapur emiting cooling forest to pavement and roof tops in and around growing cities worldwide.
I have never run the numbers on total Heat BTU’s released by man ever day from fuels and heat absorbing landscapes and what it would equal to in comparison to a volcano’s heat. There has to be someone with that info since I have made several attempts at searching for it.
I do know that most land surface temperature gauge sites are located near where most of mans heat energy is released.
So is mans daily heat release into the atmospher and waterways from all fuels really a factor on the atmosphere or just localized heat island effects.
Seems to me that Svenmarks cosmic ray theory fits in re cloud cover due solar activity sun. We all know that temperatures decrease with increased cloud cover in the tropics during the day. In any case lest we forget, there is no global warming All the datasets except CET and Satellite RSS data have been adjusted to show AGW. The whole conversation is pointless.
geran says:
October 10, 2013 at 4:53 pm
Rich, who made you the referee?
No referee is needed. Anybody with a shred of intelligence and critical sense can appreciate his points.
strange that anyone could possibly claim the sun really doesnt have much impact on our climate……
Chris @NJSnowFan says:
October 10, 2013 at 5:05 pm
…
So is mans daily heat release into the atmospher and waterways from all fuels really a factor on the atmosphere or just localized heat island effects.
>>>>>>
Chris, our waste heat is only a small fraction of the total energy produced from world-wide electricity.
All or mankind’s electrical power production is a thousand times less than the energy we receive from the Sun.
Oh, wait, it is TEN thousand times less than the Sun provides.
Okay, it is SIXTY thousand times less than the Sun provides.
(Wiki, a proven AGW site, actually still reports these figures.)
There could never be anything wrong with infrared thermometry being completely unable to register heat of enthalpy or anything. Therefore it must be human breath and cowfarts.
lsvalgaard says:
October 10, 2013 at 5:07 pm
Anybody with a shred of intelligence and critical sense can appreciate his points.
That’s why I had to include the disclaimer, for those WITHOUT a shred of intelligence or critical sense—(Just funning, love your intelligent comments, just don’t get to “high and mighty” for us low-lifes.)
What many sceptics here must realise is this simple truth:
We don’t have to give an explanation for the global surface warming since 1975, 1950 or 1850.
We only need to point out problems, errors and ask questions about AGW / CAGW. That’s it. That’s all sceptics have to do because that’s how science works.
Example: I submit a paper blaming the sun for global warming since 1975. A peer reviewer points out several flaws in my submitted paper and it’s subsequently rejected. I am upset and turn around on my way out and ask them can they think of a better reason? They don’t have to give me one damned reason, they have done their job. Let’s remember that.
Stan, I absolutely agree. What do you find out there to explain the major climate transitions – the entrys to and from interglacials?
Jimbo says:
October 10, 2013 at 5:31 pm
Jimbo, I cannot improve on what you said, so I leave you in charge as I turn into a pumpkin for the night.
You can DO it.
is the winter climate different from the summer climate in the northern hemisphere…..seems to me the ONLY difference between the 2 is the angle of the sun…maybe the sun DOES impact climate.
Radiative flux is expressed in Watts per square meter. A Watt per square meter is a joule per second per square meter. One needs a time term in any equation purporting to determine temperature change from change in radiative flux. I am not sure that the fundamental equation of climate sensitivity used by the models contains a time variable. Without one, the equation seems to my inexpert eye to be meaningless.
Four separate groups – two amateur, two professional – have been in touch in recent months to say that the time-integral of the solar forcing is capable of explaining all or nearly all temperature change on all timescales at or above the 11-year solar cycle. So I’m not sure we can dismiss “Busie olde foole, unrulie Sonne” as the primum mobile of globakl temperature change.
So funny that suddenly the IPCC invoked the low solar cycle as one of the reasons for the global temperature “hiatus”… I still await Leif Svalgaard ripping them since according to Leif, in normal science, the assumption of solar variations being the cause of climate change has been falsified.
lsvalgaard says:
October 10, 2013 at 3:03 pm
Did you even bother to read the article?
You are assuming that TSI is the only possible mechanism again.
One other quick comment, this one on man’s body heat release pee and shower water. There is about 7 billion people in the world. Humans pee about 140 gallons of 98.6° liquids per year. So that comes out to be about 1 trillion gallons of 98.6°pee water into water ways a year. Now if you add up all the hot water that is flushed into the ground and water ways from about 3.5 billion(half world has heated water source) people taking 10 minute shower daily. Water per person at 110° is 30 gallons per person a day. 3.5 billion people x30 gallons of water per day = Is about 100 billion gallons of heated water flushed daily. Do the math for the year and that is a lot of 100+° water flushed s year. My caculater does not go that high.
lsvalgaard says:
October 10, 2013 at 3:41 pm
Reflecting energy (IE, more clouds) doesn’t generate energy, but it will impact sea surface temperatures.
The difference is total solar energy reaching the sea surface. Some of the decrease comes from direct TSI, some of it comes from other mechanisms.
Chris @NJSnowFan says:
October 10, 2013 at 5:05 pm
UHIs definitely affect the measured T of the planet, especially since GISS’ formerly secret algorithms “correct” for urban heat islands by making the readings hotter! You just can’t make this stuff up.
But in terms of human activities actually having a measurable effect on the T of the atmosphere, not so much.
lsvalgaard says:
October 10, 2013 at 4:16 pm
Now you are the one making unwarranted assumptions.
Where is your proof that there changes in the amount “getting through” are insufficient to create the changes in sea surface temperature. As you yourself have acknowledged at other times, our knowledge of clouds and how they change is insufficient to make such a definitive claim.
lsvalgaard says:
October 10, 2013 at 4:35 pm
The key word here is AVERAGE.
Gernan, yes mans heat out put is very small compared to the sun but it is a NEWER source of heat to the earth and is a 24/7 365 days of a year one.
I do feel mans heat release is a very small puzzle piece of global temps. There are some many puzzle pieces.
lsvalgaard says:
October 10, 2013 at 3:23 pm
Hockey Schtick says:
October 10, 2013 at 3:16 pm
For a start, here’s 50 papers describing potential solar amplification mechanisms
None of those explain how 3.6 times more heat reach the surface than the variation of what the Sun puts out…Otherwise the climate system would be a nifty energy producer: you put 10 units in and you get 36 out. I want one of those 🙂
What if the answer is not found in how much energy reaches the surface, but how much actually exits the system. According to one paper I was just reading, OLW from the ocean can decrease by up to 80% based simply on clouds.
In my uninformed opinion … [but I”m catching up], the assumption that the ocean is in constant equilibrium with regards to heat is bogus. The ocean sucks up heat, .. some it immediately releases, but a good portion of it gets moved around, stored for awhile, then releases it.
Lindzen and others have shown that the Earths OLW is heavily correlated with the SST and the OLW radiation exiting the ocean. Thus, if the ocean is sucking up heat, .. and it’s SST increases, that is by default going to increase cloud cover over time, decreasing OLW from the ocean surface, but at the same time decreasing the SW charge to the ocean. It’s only a matter of time before the charge on the ocean begins to run low … and the result will be a decrease in SST … clouds will decrease .. and we will go into a long recharge period. What complicates matters, is that we have two “capacitors” .. the pacific and the atlantic, and they aren’t always in sinc. … AND … I don’t know what effect TSI is having, but I’ve read somewhere that TSI has actually increased by about .3-.4% since the LIA. Don’t know if there has been any decrease in TSI over this past cycle … or what it will do over the next 15 years or so. But depending on cloud cover … a 0.3% decrease or increase in the estimated 342 W/M2 that I read hits the surface would be about 1 W/M2, which is more than the 0.33 W/M2 that the OP evaluated. Even assuming that only 50% of that reaches the surface, you’d still be left with 0.5 W/M2 .. which is still higher than 0.33 W/M2.
lsvalgaard says:
October 10, 2013 at 3:03 pm
The solar TSI variations that reach the earth’s surface are smaller than the 0.33 watt/m2 needed to account for sea surface temperature variations by a factor of 3.6 for this smallest estimate of sea surface temperature variability.
So, in normal science, that falsifies the assumption that solar variations are the cause.
OK, so Dr Svalgaard has demonstrated that he doesn’t understand the effect of the thermal inertia of the oceans.
Next!
You might find an answer here, “Temporal changes in the power of the longwave radiation of the system Earth-atmosphere emitted to space always lag behind changes in the power of absorbed solar radiation due to slow change of its enthalpy. That is why the debit and credit parts of the average annual energy budget of the terrestrial globe with its air and water envelope are practically always in an unbalanced state. Average annual balance of the thermal budget of the system Earth-atmosphere during long time period will reliably determine the course and value of both an energy excess accumulated by the Earth or the energy deficit in the thermal budget which, with account for data of the TSI forecast, can define and predict well in advance the direction and amplitude of the forthcoming climate changes. From early 90s we observe bicentennial decrease in both the TSI and the portion of its energy absorbed by the Earth. The Earth as a planet will henceforward have negative balance in the energy budget which will result in the temperature drop in approximately 2014. Due to increase of albedo and decrease of the greenhouse gases atmospheric concentration the absorbed portion of solar energy and the influence of the greenhouse effect will additionally decline. The influence of the consecutive chain of feedback effects which can lead to additional drop of temperature will surpass the influence of the TSI decrease. The onset of the deep bicentennial minimum of TSI is expected in 2042±11, that of the 19th Little Ice Age in the past 7500 years – in 2055±11. reference link http://www.thegwpf.org/russian-astrophysicist-predicts-global-cooling/
“Radiative flux is expressed in Watts per square meter. A Watt per square meter is a joule per second per square meter. One needs a time term in any equation purporting to determine temperature change from change in radiative flux.”
Time I think is 24 hours a day, 365 days a year.
I don’t think averaged watts works. Nor do I think the average amount sunlight in a year works. it wouldn’t seem to work in regards Milankovitch cycles.
Leif writes “So, in normal science, that falsifies the assumption that solar variations are the cause.”
In climate science, however, there is a muttering of “natural variation” and continue on regardless.
Leif writes “None of those explain how 3.6 times more heat reach the surface than the variation of what the Sun puts out…”
CO2 doesn’t bring energy to the party either. The sun is “putting in” hundreds of Watts. You dont need an extra 1W of TSI to get 1W of warming at the surface, there are myriad atmospheric processes that can potentially warm, CO2 being just one of them.
lsvalgaard says:
October 10, 2013 at 3:03 pm
The solar TSI variations that reach the earth’s surface are smaller than the 0.33 watt/m2 needed to account for sea surface temperature variations by a factor of 3.6 for this smallest estimate of sea surface temperature variability.
So, in normal science, that falsifies the assumption that solar variations are the cause.
Too bad Dr. Robertson didn’t ask you before hand. Then he could of avoided wasting his time just like other doctors looking into how solar variations might affect climate. It is so wonderful having you present refutations to all of his considerations and others considerations and you do it with so few words.
It was interesting to see how Dr. Robertson talked about TSI seems to remind me of a pompous ass saying how everyone talks about TSI a certain way that just happens not to be this way. Hmmm. I’ll ignore any response by Isvalgaard, as I have learned how he works. Pronouncements from on high. We have it from the great L. S.. It can’t be the sun.
It’s a chaotic system, Leif. Do you claim to know all the inputs and perturbations, and their eventual manifestations? Small perturbations can be magnified by impacting the development of larger scale systems. Jerry Browning showed that in the upward cascade of enstrophy in atmospheric gyres.
The UV radiation of the sun varies wildly, add in the Forbush events, cosmic rays, cloud formation and there is plenty there to tie solar variations to climate cycles.
mem says:
October 10, 2013 at 6:02 pm
If I may quibble with the good Dr. Abdusamatov, IMO the term “Little Ice Age” should be reserved for the longer cold period from c. 1250-1400 to c. 1850, ie roughly half a Bond Cycle. Within both centennial-length warm & cold “periods” of course occur shorter counter-trend cool or warm phases. By analogy with financial market history, there are secular trends (hundreds of years in the case of climate), with cyclical counter trends (decadal) within them.
The sun may influence both the secular & cyclical trends, but oceanic circulation is clearly associated with the decadal fluctuations.
The bicentennial TSI effect Abdusamatov claims to have found fits in well with this quasi-periodic pattern. At the risk of being labeled a cyclomaniac, I’ll say that IMO it appears real, not spurious: decades ruled by oceanic oscillations, with longer, bicentennial cycles under TSI influence, which add up to semi-millenial waves (half Bond Cycles), all superimposed to produce the quasi-ness of it all until a new glaciation begins & the weak Bond Cycles become powerful Dansgaard-Oeschger Cycles (Dansgaard being another recently late, great Dane).
Tibet & Okinawa pick up the solar signal:
http://onlinelibrary.wiley.com/doi/10.1029/2011JD017290/abstract
http://www.agu.org/pubs/crossref/pip/2012GL052749.shtml
It’s unicorns Leif.
Steve mosher says:
October 10, 2013 at 6:38 pm
The unicorns are inflated by CO2.
The may sun rule, even if humans don’t know how yet. Climate is complex, possibly even chaotic. But what it isn’t is CO2 & nothing else, as per the IPeCaC fantasy. Mother Nature has already slapped down that delusion, as she already had long before the gaseous madness was ever even promulgated by the raving loon Hansen.
Pat Frank says:
October 10, 2013 at 6:29 pm
It’s a chaotic system
Even chaos cannot make 36 W/m2 out of 10 W/m2.
The Sun was more than averagely active all the way from 1934 to 2003, and although the peak amplitudes fell gently after 1958 (not forgetting the 20% Waldmeier overcount Leif won’t mention in this sort of thread), the minima were brief and the cycles short and steep.
So given that there will be an average sunspot number at which the oceans neither gain nor lose energy (give r take some cloud variation (also solar linked), and given the thermal inertia of the millions of cubic kilometres of water in the upper oceans, would we expect:
The OHC to rise from 1934 to 1960 and then fall
The OHC to rise for as long as the Sun remained more than averagely active
The OHC to leap about at a moments notice in response to the ups and downs of 11 year solar cycles as Leif demands?
Ocean temps, surface temps, ENSO, etc., they are all reactions not causes.
Perhaps TSI variation is enough to effect thermal convection to space.
tallbloke says:
October 10, 2013 at 6:56 pm
So given that there will be an average sunspot number at which the oceans neither gain nor lose energy
That is not a given. The oceans gain energy every day no matter what the sunspot number is and lose what they have gained again at night. Over the long run, the average ocean temperature will just depend on the average incoming solar radiation. If the solar incoming were to go up [because of more sunspots] the ocean temperature will go up. If the incoming stayed at its higher level the ocean temperature the ocean would stay at its higher temperature [i.e. neither gain nor lose energy] even though the sunspot number is higher, so now it will at a different average sunspot number that the oceans will neither gain nor lose energy, so here is no fixed ‘magic sunspot number’ involved.
Hand-waving, Leif. How do you know that small perturbations don’t affect larger scale energy transfer between coupled oscillating climate systems?
Does the proportion of IR, visible light and UV vary enough in the measured TSI to cause a change in heat received at the surface ? So if the total TSI variation is insignificant, are the wave length contributions to TSI constant.?
Leif Svalgaard says:
(quote Robertson) The solar TSI variations that reach the earth’s surface are smaller than the 0.33 watt/m2 needed to account for sea surface temperature variations by a factor of 3.6 for this smallest estimate of sea surface temperature variability.
So, in normal science, that falsifies the assumption that solar variations are the cause.
———————————————————-
I agree with Leif that intrinsic solar variations are not the cause. Something within the atmosphere causes the variations at the sea surface and it might even be merely a coincidence that higher temperatures and TSI just happen to vary in phase with some other driving mechanism. But the fact that the sun is the ultimate cause is shown by the same periodicity for the TSI and earth surface temperature cycles
Leif knows very well that TSI refers to the variation of intrinsic solar radiance that is received at the location of the top of earth’s atmosphere. Like the ordinary 160 watt/m^2 that reaches the ground of about 1365 watt/m^2 incident on the sunny side of the top of the atmosphere, about 160/1365 of that 0.6 watt/m^2 amplitude of TSI will reach the ground as ordinary sunlight. That is 0.07 watt/m^2 at wavelengths below about 2 micron. Another 0.02 watt/m^2 arrives as scattered thermal infrared, making about 0.09 watt/m^2 the part of TSI that enters the surface.
The rest is a very simple physics proposition. We are talking about heating water here. How much heat does it take to heat the oceans to the extent shown? A lot more than 0.09 watt/m^2. Where does it come from? Obviously from the sun, since it varies with the solar cycle period.
But it doesn’t have to be extra heat that entered the top of the atmosphere. The surface oscillations could be caused by extra clouds blocking sunshine from entering for part of the solar cycle. All that we see at the surface are the energy variations, but we do at least know that when TSI is high, the temperature is high, with only a little over a year thermal lag.
Stan Robertson
@OP — ” … imply that the sun modulates the ocean temperatures to a much greater extent than can be provided solely by its TSI variations.”
Since the specific wavelengths matter, looking at TSI doesn’t. Which is the entire discussion behind AGW and GHG’s in the first place.
Pat Frank says:
October 10, 2013 at 7:17 pm
Hand-waving, Leif. How do you know that small perturbations don’t affect larger scale energy transfer between coupled oscillating climate systems?
The article says that 1 W/m2 in gives you 3.6 W/m2 out [actually 0.09 and 0.33, but you should be able to figure that out on your own]. In nature you don’t permanently get something for nothing.
“Although the estimated 0.33 watt/m2 that is required to explain the surface temperature variations is large compared to the amplitude of TSI variations that reach the surface, it is still only about two parts per thousand of the 160 watt/m2 of solar UV/VIS/NIR that reaches the earth surface.”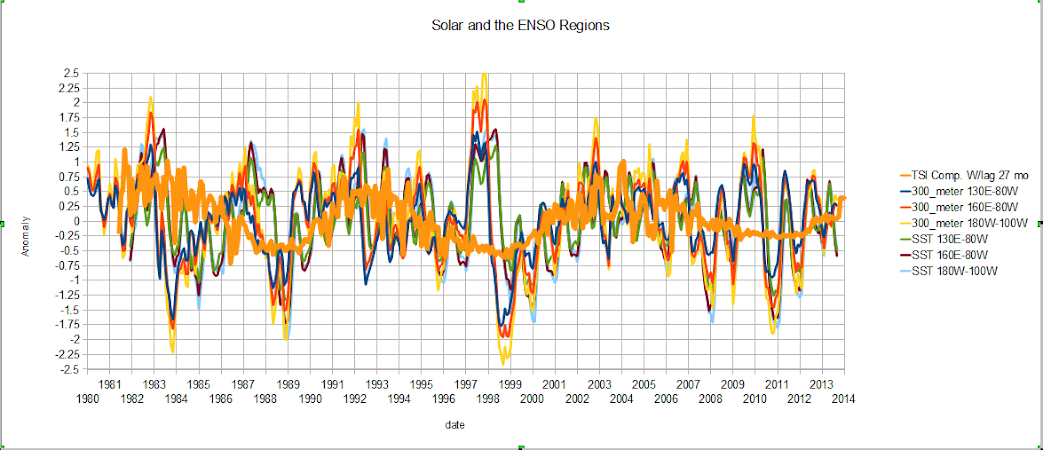
That depends on which surface. If the energy is absorbed near the surface or in the skin layer it is less efficient that if it is absorbed sub-surface in the oceans. The lags are different. For example if you compare the ENSO region with the areas north and south of the ENSO regions you will find a 27 month lag. ENSO lags solar by 27 months at least since 1981 while 30 degrees north and south of the ENSO region are in phase with solar.
I haven’t figure out if that is just a recent thing or not, but it the tropical ocean mixing layer is near equilibrium, you could get some interesting resonance effects. The actual El Nino peaks appear to be a third harmonic. Plus note that for the ocean sub-surface the average insolation should be based on I*cos(theta)/pi() and consider the lag residual as a dc component it appears. Kind of like a liquid greenhouse effect.
Gravitational pull.? Must have some energy input.? Anyone?
Hi. During the day my yard heats up to 19C.
At night it cools to 7 C
Do ya think that the sun has some influence on that?
bones says:
October 10, 2013 at 7:22 pm
The rest is a very simple physics proposition. We are talking about heating water here. How much heat does it take to heat the oceans to the extent shown?
You said: “[people] have found that ocean surface temperatures oscillate with an amplitude of about 0.04 – 0.05 oC during a solar cycle. (In fact, all of the ideas that I am presenting here were covered in Shaviv’s work, but it has not gotten the attention that it deserves.) Using 150 years of sea surface temperature data, Zhou & Tung found 0.085 oC warming for each watt/m2 of increase of TSI over a solar cycle.”
I don’t like your ‘amplitude’ concept as it assumes a given waveform. I prefer the actual valley-to-peak variation, so the numbers become 0.08 to 0.10 C during a solar cycle [for 1.2 W/m2]. Z&T found 0.085 C for 1 W/m2, so average 0.09 C for 1.1 W/m2. Simple physics says S = a T^4, or dS/S = 4 dT/T or dT/T = 1/4 dS/S; with dS = 1.1 and S =1361 and T =289K we find dT = 0.06 K, which is in the ball park of 0.09, so I don’t see the problem.
Looks like the ENSO meter is going negative, this should be interesting considering IPPC says the heat is trapped in the oceans along with an increase in global ice. Here is what is really happening
Perilous Times and Perilous Men
2 Timothy 3
3 But know this, that in the last days perilous times will come: 2 For men will be lovers of themselves, lovers of money, boasters, proud, blasphemers, disobedient to parents, unthankful, unholy, 3 unloving, unforgiving, slanderers, without self-control, brutal, despisers of good, 4 traitors, headstrong, haughty, lovers of pleasure rather than lovers of God, 5 having a form of godliness but denying its power. And from such people turn away!
Such is……….
tallbloke says:
October 10, 2013 at 6:02 pm
OK, so Dr Svalgaard has demonstrated that he doesn’t understand the effect of the thermal inertia of the oceans.
Next!
———————————————————
Touche, tallbloke. It actually takes enough heat to change water temperatures for a few hundred meters below in order to get the surface temperature to change enough. He seems to be content with merely balancing at the surface, but that is physically wrong.
But give him a break. How many solar scientists do you know who would be happy to be told that they don’t understand some a fundamental connection between the sun and earthly climate?
Tallbloke, I follow you perfectly. Amazing how a scientist can just seem to completely ignore the huge mass involved.Your thought of a general null point in the ssn (at best, only an empically aided swag Leif) is precisely how I got involved with wuwt four years ago, yes, that very topic with the charts I sent to Anthony, before I even knew skeptics existed, before I knew there was a raging debate over climate, and curiously Anthony had a post that drew me to his site and he was using that very same happy face sun as the picture on his post “It’s the sun, stupid!”.
Now that is some strange coincidence !! 😉
“c. But what it isn’t is CO2 & nothing else, as per the IPeCaC fantasy.”
Actually C02 forcing is only half the story according to the IPCC.
In short, the science, the IPCC science, attributes the change to MANY forcings. C02 happens to be the largest. Its not the only forcing. However, by the time the science gets politicized its all people talk about.
lsvalgaard says:
October 10, 2013 at 7:41 pm
I don’t like your ‘amplitude’ concept as it assumes a given waveform. I prefer the actual valley-to-peak variation, so the numbers become 0.08 to 0.10 C during a solar cycle [for 1.2 W/m2]. Z&T found 0.085 C for 1 W/m2, so average 0.09 C for 1.1 W/m2. Simple physics says S = a T^4, or dS/S = 4 dT/T or dT/T = 1/4 dS/S; with dS = 1.1 and S =1361 and T =289K we find dT = 0.06 K, which is in the ball park of 0.09, so I don’t see the problem.
————————————————————-
The problem is that your calculation would apply only to a surface with no heat capacity. You are failing to consider the heat required to raise the water temperature for a considerable depth below the surface.
“How do you know that small perturbations don’t affect larger scale energy transfer between coupled oscillating climate systems?”
Prove its not unicorns Pat.
“Gravitational pull.? Must have some energy input.? Anyone?”
yes, it varies with the square root of unicorns.
I’m sticking with Zeus, Umvelinqangi, Taranis, Parjanya, Stribog, and the rest of the gang. Don’t need any difficult maths.
Steven Mosher says:
October 10, 2013 at 7:55 pm
Even half is preposterous, based upon feedback assumptions not only not in evidence but contrary to all actual objective data & observations. There was an accidental correlation in the 1990s between increasing CO2 & rising T, but far more often in climate history there has been negative or no correlation. The effect from CO2 is demonstrably & prima facie negligible to non-existent, except possibly as a minor positive feedback, since naturally warming oceans give up the gas.
To quote the late, great Reid Bryson, “You can go outside and spit and have the same effect as doubling carbon dioxide”.
But please say where IPCC states that it’s only half & to what they attribute the rest. Thanks.
Steven Mosher: “Prove its not unicorns Pat.”
Small perturbation in a climatological system are not Unicorns. Which are defined as horses with a pointy thing on the front. And, we should note, are just as mythical as your ability to reason.
Bill Taylor says:
October 10, 2013 at 5:12 pm
strange that anyone could possibly claim the sun really doesnt have much impact on our climate……
Try this analogy – gasoline powered autos. If one reads the ads for vehicles there are all sorts of differences and wonders to behold. There is a continuous variable transmission (old idea, new technology) touted as providing better gas mileage. Just one of many. All auto companies use such things to claim they can provide you with a better product. None of the car companies claim its the gasoline that does it.
The Sun is there. We understand that. What we don’t have are the processes (cosmic, oceanic, magnetic, solar, or whatever) that cause the shorter climatic fluctuations. Several folks on this (and other) posts are just saying “show me.”
While this is an interesting article, there are serious problems with the underlying data. TSI measurements are based on several different satellites since 1979 (3 different ones). So there is about 34 years of data that is taken from the bottom of the outermost layer of the atmosphere. So TSI is probably not being properly measured, I am sure its reasonably precise for each of the three satellites for where they were at in the atmosphere, however since its measuring inside the atmosphere we don’t actually know what or how much is making it to parts of the atmosphere away from where the satellites orbits were/are. Additionally TSI has a very short approximately 3 cycles of data which is probably not enough to know what its potential long term flux is.
In addition to TSI the upper level of ocean temperatures is measured very well and its reaction to TSI over the entire body of water as well as the mixing effects of AMO and PDO make it very unlikely that we can calculate how much energy is actually accounted for by TSI flux. Most likely I would think that the energy entering the system is coming from the sun If there is a flux that matches TSI flux then most likely the sun is the direct or indirect cause.
Stan is probably right, if we can figure this out, we will get a much better understanding of the climate system. But what we really need is better data. For the most part were just scratching a small part of a very large surface in our attempts to measure the Earth.
v/r,
David Riser
Woops,
In addition to TSI the upper level of ocean temperatures is measured very well and its reaction to TSI over the entire body of water as well as the mixing effects of AMO and PDO make it very unlikely that we can calculate how much energy is actually accounted for by TSI flux
should be
In addition to TSI the upper level of ocean temperatures is not measured very well and its reaction to TSI over the entire body of water as well as the mixing effects of AMO and PDO make it very unlikely that we can calculate how much energy is actually accounted for by TSI flux
v/r,
David Riser
Steven Mosher,
You must know a lot about unicorns. Thank you for sharing the knowledge that unicorns have squate roots and that they are variable. The variable part is of course a given.
Plankton convert radiant energy into to chemical energy via photosynthesis. Could it be a variability concerning them? e.g. http://www.icess.ucsb.edu/bbop/
Paul, you must be joking. The Sun has nothing to do with the heating of your yard in the daytime and its cooling at night. A moment’s thought will clear your head. But given the state of scientific knowledge held by adults the world over, there is very likely another guy on the opposite side of the planet who is as convinced as you with a twist. While you are pointing to the Sun as the driver of your daytime yard heating, the guy on the opposite side of the globe is pointing at the lack of the Sun as the driver if his nighttime cooling.
You do realize, I hope, that the cause is the Earth’s rotation on its axis? I know it seems I am stating the obvious but many people here have used the same illogical statement to support their belief that the Sun is the driver of trends.
And the answer is,,,,
Those randy little photo plankton and diatoms are exponentially stimulated by the increase in TSI; the resulting sexual activity warms the ocean.
Far fetched you say ? Just look at the energy released in this thread by just a few small inputs, due in large measure to an effect known as Onan’s Razor.
bones says:
October 10, 2013 at 7:56 pm
The problem is that your calculation would apply only to a surface with no heat capacity. You are failing to consider the heat required to raise the water temperature for a considerable depth below the surface.
Your question was “the question to be answered at this point is, can 0.09 watt/m2 amplitude of variation of TSI entering the oceans produce temperature oscillations with an amplitude of 0.04 – 0.05 oC?” and I showed that it could produce such variations at the surface of the ocean.
David Riser says:
October 10, 2013 at 8:16 pm
So there is about 34 years of data that is taken from the bottom of the outermost layer of the atmosphere. So TSI is probably not being properly
Not so. One of the satellites is a million miles away, the others at 645 km and 700 km altitude, not ‘the bottom of the outermost layer’, but effectively outside the atmosphere; and TSI is measured very precisely [and accurate to one part in 2700].
Reading through this discussion has been a real eye opener for me. Leif Svalgaard is treated with respect on this blog as an expert on solar physics, and he certainly regards himself as one. And then he makes the most astounding simple errors in the arguments presented here – and insists despite very clear explanations of his errors. First he confuses the production of energy with a regulation of energy transport, and then he calculates the variation of sea surface temperature from instantaneous balance between incoming energy flux and emitted blackbody radiation.
We can all have a bad day but this is really strange.
Dr. Robertson, very good analysis. Have read it once through but I want to slow down the next pass to absorb it all. Have checked your figures through paragraph two and did noticed you are being extra conservative at each step. Nice, better to not have something for someone to pick at. Going to enjoy this one! Well, tomorrow. This is one good question.
lsvalgaard says:
October 10, 2013 at 8:53 pm
bones says:
October 10, 2013 at 7:56 pm
The problem is that your calculation would apply only to a surface with no heat capacity. You are failing to consider the heat required to raise the water temperature for a considerable depth below the surface.
Your question was “the question to be answered at this point is, can 0.09 watt/m2 amplitude of variation of TSI entering the oceans produce temperature oscillations with an amplitude of 0.04 – 0.05 oC?” and I showed that it could produce such variations at the surface of the ocean.
—————————————————————–
So when did the ocean lose it its heat capacity? And you are bragging about an incorrect solution to a physics problem? That’s incredible to me, especially after I had extended the courtesy of a heads up on this one.
No one really has a satisfactory explanation for the global surface warming throughout recent years. But solar power could be used for more good than it currently is.
http://www.climal.com/solar-power.php
bones says:
October 10, 2013 at 9:26 pm
So when did the ocean lose it its heat capacity? And you are bragging about an incorrect solution to a physics problem?
Nobody is bragging here [at least not I] Perhaps you should consider the possibility of having presented a correct solution to the wrong problem. Circulation and convection rather than conduction are probably more important.
lsvalgaard says:
October 10, 2013 at 9:31 pm
Perhaps you should consider the possibility of having presented a correct solution to the wrong problem. Circulation and convection rather than conduction are probably more important.
——————————————–
Not on an 11 year time scale. Not to mention that vertical water convection is rolled into the thermal diffusivity. The thermal conductivity of water in a lab flask would be nearly 1000 times smaller. Seems to me that you don’t understand the basic physics of the situation, so I am going to abandon arguing about it and leave you to think about it or maybe talk to one of your colleagues. It’s bed time here in the boonies.
Dr. Isvalgaard,
Do you think there is correlation between the cosmic rays and temperature historically?
I understand correlation is not causation but from what I’ve seen of Dr. Shaviv’s work he makes a compelling connection.
I understand the TSI variations as measured at the top of the atmosphere are not strong enough to explain temperature fluctuations as seen in the correlation. Are the energy measurements at the surface theoretical from what is measured at the top or are they measured at the surface?
The explanation from Shaviv seemed to be that all the energy doesn’t reach the surface because of cloud variations. Therefore the fluctuations at the bottom will be larger because sometimes the average reaching the bottom is very little (many clouds) sometimes it is very large (few clouds).
Do you think his theory is incorrect that solar winds can cause more clouds?
If he was correct do you think this could explain temperature variations?
Thank you for your time explaining this.
bones says:
October 10, 2013 at 9:41 pm
” Circulation and convection rather than conduction are probably more important.”
Not on an 11 year time scale. … Seems to me that you don’t understand the basic physics of the situation, so I am going to abandon arguing about it
I am not arguing with you, i am trying to understand what you are saying and so far I have failed. In my book a failure of the student reflects upon the teacher. In this animated graph http://www.bom.gov.au/climate/enso/sub-surf_anim.gif the rapid temperature changes over several hundred meters in a few days shows me the effect of circulation overwhelming that of conduction. Please explain why that doesn’t matter and why the bottom of the ocean after billions of years of conduction has not reached the average yearly surface temperature. Again: I’m trying to learn, not to argue.
Dr. Svensmark’s new paper suggests that GCRs are capable of creating cloud seeds in excess of 50 nanometers, which are of sufficient size to create clouds.
When other scientists replicate Svensmark’s SKY2 experiment and get the same results, then at least part of the puzzle of SSN flux/GCR flux/cloud cover flux/albedo flux/global temp flux can help explain part of the Sun’s affect on climate.
The SSN flux/global temp flux correlation had been well established, but the specific interactive mechanisms that create that correlation have yet to be firmly established. I do think Svensmark’s research into the Svensmark Effect had at least explained part of the puzzle, although there is heated debate on the subject.
It’s becoming increasing obvious that CAGW hypothetical assumptions that: 1) solar influences are relatively constant and thus can’t explain the 20th century warming, and 2) the lowly CO2 molecule is the ultimate climate control knob, are absurd.
The bottom line is that the longer the IPCC/governments/academia holds climate science hostage under the disconfirmed CAGW hypothesis, the longer it will take true scientists to solve the mysteries of Earth’s complex and changing climate system.
shenanigans24 says:
October 10, 2013 at 9:48 pm
Do you think there is correlation between the cosmic rays and temperature historically?
Many people have looked at this and cosmic ray hypothesis doesn’t look too good now, see e.g. http://www.leif.org/EOS/swsc120049-Cosmic-Rays-Climate.pdf [“it is clear that there is no robust evidence of a widespread link between the cosmic ray flux and clouds”] or http://www.leif.org/EOS/1303-73140Cosmic-Rays-Climate-billion-yrs.pdf [“It has already been shown by Overholt et al (2009) that the peaks and troughs in the Shaviv distribution do not correspond to crossings of the SA in the Galaxy. Here we show that the estimated intensity variations from the Shaviv distribution are also unrealistic”].
Now, you can also find papers that claim to support the hypothesis. I guess everybody has to make up his own mind what to believe. Personally, I don’t think there is a link at all.
milodonharlani
Here are all the forcings: C02, CH4,halocarbons, N2O, C0. NMVOC, No3,NH3,S02,Black Carbon, Organic Carbon, Mineral Dust, Aerosol, Aircraft (contrails), Land Use, Solar.
For 1750 to today C02 forcing is around 1.6Watts, Ch4 is around 1 watt, black carbon about .7Watts. halocarbon and N02 around .5Wwatts
so.. the non c02 stuff is around 1+ .7 +.5 or around 2.2 Watts
C02 is the largest SINGLE contributor, but if you look at all contributors its around 1.6 watts out of 3.8 or so.. thats for the forcings that are postive.
Its in Ar5. read the science before you criticize it. That’s what I learned from Steve Mcintyre and Anthony. You might consider it
lsvalgaard says:
October 10, 2013 at 9:54 pm
. . . In my book a failure of the student reflects upon the teacher. In this animated graph http://www.bom.gov.au/climate/enso/sub-surf_anim.gif the rapid temperature changes over several hundred meters in a few days shows me the effect of circulation overwhelming that of conduction. Please explain why that doesn’t matter and why the bottom of the ocean after billions of years of conduction has not reached the average yearly surface temperature. Again: I’m trying to learn, not to argue.
——————————————–
Nice graphic. Thermal diffusivity (turbulent) is precisely what is used to describe time averages over these vertical transports of heat for periods of months or more rather than weeks. I don’t think that God himself understands turbulence. The best we can do is a phenomenological mixing length theory to describe conduction, viscosity and diffusion in the presence of turbulence, but average thermal diffusivity provides a good parameterization of the vertical transport of heat in the oceans. Temperature profiles from surface to great depths, averaged over a few months, can be well described in terms of an average thermal diffusivity.
On longer time scales of decades to multiple decades, horizontal thermohaline circulation is what transports cold water from polar regions into the depths at lower latitudes. That is what makes the thermocline a stable feature of the tropical to mid-latitude oceans (aside from seasonal variations near the surface). The ocean depths are still cold, in part, because of the cold water runoff from the melting ice during the most recent deglaciation. There were times in the geologic past when the earth was warmer, polar ice was lacking and the ocean basins were filled with much warmer water. Many people make the mistake of thinking that our climate is some optimal and stable feature of the earth, but it is not. The earth has spent at least 90% of the last million years locked in ice ages and we are about due for another one.
bones says:
October 10, 2013 at 10:27 pm
Temperature profiles from surface to great depths, averaged over a few months, can be well described in terms of an average thermal diffusivity.
Fair enough, but then I’m puzzled by “thermal diffusivity in the range 0.1 – 10 cm2/s and found that the TSI variations were generally inadequate to produce the sea temperature variations over a solar cycle.
temperatures measured where?
at the surface.
bones says:
October 10, 2013 at 10:47 pm
at the surface.
which would seem to depend on the direct incoming flux and not care what the temperature is a great depth [which would have a very attenuated solar cycle variation].
gradients & flows
down with the obfuscation
I agree, but if I recall correctly, it took about 0.18 watt/m^2 to get 0.04 C surface temperature variations for 0.1 cm^2/s thermal diffusivity. That diffusivity is an order of magnitude smaller than needed to account for the ocean heat content measurements and yet it takes double the 0.09 watt/m^2 of TSI reaching the surface to get the requisite surface temperature change.
lsvalgaard says:
October 10, 2013 at 3:41 pm
Explain how any or all of these can supply 3.6 times MORE energy than the variation of the TOTAL energy received from the sun.
===========
The solar wind can react physically with the atmosphere in a fashion that TSI cannot. As such, the effects of the solar wind are not restricted to W/m^2. Even a small change in the albedo due to the solar wind could quickly swamp the variability in TSI.
What the authors numbers show is that TSI cannot be the cause of the 11 year variability in ocean temperatures. there must be another, as yet unknown cause. similar to the discovery of the outer planets in the solar system – by the effect they had on known planets. we can see something is causing the variability, but as yet we haven’t discovered what it is.
What the author has done is to eliminate TSI as the cause. Whatever is left, known or unknown, no matter how improbably, must contain the cause.
ferd berple says:
October 10, 2013 at 11:29 pm
The solar wind can react physically with the atmosphere in a fashion that TSI cannot. As such, the effects of the solar wind are not restricted to W/m^2. Even a small change in the albedo due to the solar wind could quickly swamp the variability in TSI.
The albedo is basically determined by clouds. It takes a lot of energy to make clouds. The solar wind does not have a lot of energy.
fred berple: “What the authors numbers show is that TSI cannot be the cause of the 11 year variability in ocean temperatures.”
Question: Who would even think so? Not picking on you here at all. But we’re all basically on board with the idea that CO2 emitted photons will be absorbed by land masses. But it seems to be an utter mindbender that water below will absorb photons from the water above. With or without any Willis Wobble theory of clouds.
TSI as a sum of the power across all photons of all frequencies is almost entirely pointless to look at. We’d need to know the W/m^2 of the proper wavelengths in and how they vary. Then the rest models up as an ideal GHG system.
Only problem is we’d need a solar scientist to be able to answer that issue.
“It is generally conceded that the earth has warmed a bit over the last century, but it is not clear what has caused it”
Yes, this is science the way the climate guys do it:
They made the first claim, so whoever disagrees is the skeptic.
Een though they never did “due diligence” science by falsifying other competing possibilities, such as sunspot cycles, Milankovitch cycles, natural planetary climate variation, ENSO, etc.
Without testing ANY of those others, they made their unsustainable claim, drawing a line in the sand.
And when someone asked, “Are you sure?” the questioner became a denier.
If we the skeptics had thought about it and beat them to the punch, by first claiming, “The warming is totally natural variation,” then the warmists would be the deniers.
D*mmit! We missed our chance!
Dr. Robertson, (are you ‘bones’?)
For one, it certainly seems that albedo could account for it all. The way I calculate that it would only require a 0.2% flex in the albedo to reach the 0.04°C cycle T range. If you are looking for the 0.31 W/m2 per decade it too would require a decadal decrease in the albedo of, once again, right under 0.2% per decade to fit those 1955 to present curves. I’ve seen albedo figures all over the board, from 0.31 to 0.29x so yes, I can see that, but I am not sure albedo is even that precisely measured.
If so, that’s one good place for such a factor to stay hidden to all for so long by it’s historic immeasurability.
Now, does the 11 year radiation flex affect the overall albedo? I don’t know.
Seems I left out a second question, could the albedo have decreased over the 1955 to present period? Say leaving some wiggle room and take 0.3% times six decades or about -0.005 in the albedo? Don’t know that either, have never looked into it.
I think I have figured out how the sun does it.
http://www.newclimatemodel.com/new-climate-model/
I await date capable of confirming or rebutting.
Down to Earth
Most scientists are obsessed with the atmosphere and fail to include, like the IPCC, the input of the sun on the earth under their feet. I suggest an investigation of how the sun heats up bare earth and concreted bare surfaces would demonstrate one major “amplifier” of the sun’s rays.
We all know that Urban heat Islands are hotter than surrounding rural areas where trees and grass is growing, where vegetation is aplenty, covering the soils.. We all know that deserts are distinctly hot places during daylight. We all know that arid lands are ditto, hot places. We might not know that cultivated land, left bare, also heats up and loses any little moisture they might have by evaporation, In these circumstances, the soil is powdery and picked up winds, eroded by wind.
It is claimed that 50% of the land surface on this globe is desert and arid lands. These dry hot areas, are apparently caused primarily and originally by over grazing, constant cultivation, clearing of vegetation, removal of trees etc. This has occurred from Roman times, and perhaps earlier. Now, we also have large scale open cast mining projects which contribute to the amplification too.
However solar oradiation would determine the amount of heat so generated. A cooler sun, would reduce the heat output from the bare exposed, fast heating surfaces. This we see in the Northern Hemisphere every winter ).
In summer of course the solar input is at a maximum and the bare exposed areas would heat up magnificently. Lakes and rivers shrink. Water shortages occur. Worse evaporation must come to a horrid halt.. Now add in some dust storms, carried by blasting hot winds and life for many becomes unbearable (even impossible) and the terrain becomes hotter and more inhospitable to all life forms..
There is more to be considered, and that is in this situation, the microbies, fungi, bacteria, flora and fauna in the soils die out,or fail to function,, or become inactive – to the detriment of the vegetation that they support. Also soil moisture levels diminish. What scientist considers or has troubled to investigate this “all man made” aspect?
“Here are all the forcings: C02, CH4,halocarbons, N2O, C0. NMVOC, No3,NH3,S02,Black Carbon, Organic Carbon, Mineral Dust, Aerosol, Aircraft (contrails), Land Use, Solar.”
It’s not a knob, it’s an equalizer! Or AGW-izer?
Oh my gosh.. The climate alarmists say that because they cannot otherwise explain the warming it must be CO2 that dunnit. Lief says that because we cannot explain how the sun does it it cannot be the sun. Birds of a feather. Same nonsense just in another form. I do not care how many qualification anyone may have or how much respected work they have done, if they in spite of all that cannot understand the gist of the main post here, which is that it clearly is not TSI but something else related to the sun, AND LET’S FIND IT… what can one say? Closed mind and zero credibility from the very first comment on this thread. Really sorry I have to say this….
lsvalgaard:
“Explain how any or all of these can supply 3.6 times MORE energy than the variation of the TOTAL energy received from the sun.”
It can help to explain here (it the Sun “may be” – as the sun can be – its variability – amplified), only those quotes (by reason of which my comments on Skeptical Science were – mostly – removed):
Solar-forced shifts of the Southern Hemisphere Westerlies during the late Holocene, Varma et al., 2011.:
“Since the reduction in TSI is only 0.15%, the global cooling effect is small and ADDITIONAL FEEDBACKS are required to induce a significant change in the westerlies.”
“… we propose that the role of the sun in modifying Southern Hemisphere tropospheric circulation patterns has probably been UNDERESTIMATED in model simulations of past climate change.”
Natural forcing of climate during the last millennium: fingerprint of solar variability, Swingedouw (2010): “We argue that this lag is due, in the model, to a no rthward shift of the tropical atmospheric convection in the Pacific Ocean, which is maximum more than four decades after the solar forcing increase.”
“Changes in wind stress, notably due to the NAO, modify the barotropic streamfunction in the Atlantic 50 years after solar variations.”
Sub-Milankovitch solar forcing of past climates: Mid and late Holocene perspectives, Helama (2010):
“The observed variations may have occurred in association with internal climate amplification […] (likely, thermohaline circulation and El Niño–Southern Oscillation activity). THE NEAR-CENTENNIAL DELAY in climate in responding to sun spots indicates that the Sun’s influence on climate arising from the current episode of high sunspot numbers may not yet have manifested itself fully in climate trends.”
Response of Norwegian Sea temperature to solar forcing since 1000 A.D., Sejrup (2010): “The observed ocean temperature response is LARGER than expected based on simple thermodynamic considerations, indicating that there is dynamical response of the high‐latitude ocean to the Sun. […]”
Dudok de Wit & Watermann, 2009.:
“… the main mechanisms by which the Sun affects the Earth are not the most immediate ONES IN TERMS OF ENERGETIC CRITERIA.”
“- feedback mechanisms are not sufficiently well understood and POSITIVE FEEDBACK MAY BE MUCH STRONGER than expected …”
Cyclic variation and solar forcing of Holocene climate in the Alaskan subarctic, Hu et al., 2003. :
“Our results imply that SMALL variations in solar irradiance induced pronounced cyclic changes in northern high-latitude environments.”
Testing solar forcing of pervasive Holocene climate cycles, Turney et al., 2005.:
“The cycles, however, ARE NOT COHERENT WITH CHANGES IN SOLAR ACTIVITY (both being on the same absolute timescale), indicating that Holocene North Atlantic climate variability at the millennial and centennial scale IS NOT DRIVEN BY A LINEAR RESPONSE to changes in solar activity.”
Climate change and solar variability: What’s new under the sun?, Bard and Frank, 2006.:
“Overall, the role of solar activity in climate changes —such as the Quaternary glaciations or the present global warming— remains unproven …”
Solar Variability Over the Past Several Millennia, Beer et al. 2006.:
“This led many people to conclude that, even if the solar constant is not constant, the changes are too small to be climatically relevant without invoking additional strong amplification mechanisms. THIS CONCLUSION SEEMS TO BE PREMATURE, firstly because there is no doubt that there are positive feedback mechanisms in the climate system.”
NASA: “The spectral solar irradiance (SSI) at UV (ultraviolet) wavelength has been observed to vary during an 11-year solar cycle with much larger amplitude compared with the variability of TSI.”
“Even though TSI and SSI at UV wavelengths have been observed to vary during solar cycles, how the Sun varies (both TSI and whole spectrum SSI) and how solar variations influence the Earth’s climate over long time scales REMAIN UNRESOLVED.”
“Based on SIM observations Cahalan et al. [2010] demonstrate REMARKABLE different climate responses (stratosphere, troposphere, ocean mixed layer) to SORCE-based and proxy-based SSI variations. The OUT-OF-PHASE SSI variations also have implications to re-examine the connection of the Sun and stratosphere, troposphere, biosphere, ocean, and Earth’s climate. […]”
Gray (2010):
“They found that even low solar forcing could affect climate on multi-decadal to centennial timescales but the results using medium-to-low values (corresponding to the range of Lean et al., 2002) fitted best within the range of temperature reconstructions. Note, however, that if the recent SORCE/SIM measurements of spectrally resolved solar irradiance …” “… are correct then solar radiative forcing at the tropopause would vary out of phase with TSI. In this case, assessments of solar influence on climate, at least over the 11-yr cycle and possibly on the longer term, would need to be ENTIRELY revisited …”
NOAA : “… our understanding of the indirect effects of changes in solar output and feedbacks in the climate system IS MINIMAL […]”
Sun, its variability – as well “suited” the key – it activates the mechanism … –
mechanisms triggering other mechanisms: energy accumulation and releasing huge amounts of energy – energy stored in the energy system of the Earth.
The fact that we do not know: how? (sufficient detail), does not mean it does not exist …
(sorry that I do not give links but some blocking my comments, others are not currently active)
lsvalgaard says:
October 10, 2013 at 6:54 pm
The entire universe is supposedly a chaotic system, yet in our small part of it we find ~400 billion stars in one spiral galaxy, and in a much smaller part of that we find more than 6 billion humans that defy the essence of “chaos”. Or is there something else afoot?
Using chaos to refute the obvious is a rather incomplete defense.
lsvalgaard says:
“The solar wind does not have a lot of energy.”
Looking how well the SABER data follows the geomagnetic signal, the solar wind appears to be responsible for a large proportion of the heating of the upper atmosphere.
lsvalgaard, “Fair enough, but then I’m puzzled by “thermal diffusivity in the range 0.1 – 10 cm2/s and found that the TSI variations were generally inadequate to produce the sea temperature variations over a solar cycle. ”
You don’t need to vary the TSI just the timing. There is a +/- 43 Wm-2 seasonal swing in TSI. Your are removing the seasonal signal of two different systems to determine “forcing” and response. You don’t need to change the energy of the response to get a big impact if you shift the seasonal cycle a latitude or two or week or two, When it comes to chaotic impacts you are comparing apples and oranges.
Isvalgaard,
I would like to point out that the farthest away satellite was launched in 2010 and does not provide data to the TSI dataset. So your still measuring from within the atmosphere for this data and your making assumptions about energy based on a average that may or may not be representative of reality.
v/r,
David Riser
How one spark can make a fire?
How one inoffensive move can lead to a checkmate?
There is a huge amount of stored energy in Earth’s biosphere, that can be released due to small changes of solar irradiance by thousands of different interactions and resonances.
One possible mechanism immediately comes to mind: a small increase in solar irradiance can trigger a substantial increase in activity and reproduction among microscopic sea organisms.
lsvalgaard says:
“The solar TSI variations that reach the earth’s surface are smaller than the 0.33 watt/m2 needed to account for sea surface temperature variations by a factor of 3.6 for this smallest estimate of sea surface temperature variability.
So, in normal science, that falsifies the assumption that solar variations are the cause.”
===
No. In normal science that falsifies the assumption that ” TSI variations that reach the earth’s surface” are the cause.
Only your selective reasoning leads to : “that falsifies the assumption that solar variations are the cause.”
That is post-normal science.
Greg:
re your post at October 11, 2013 at 4:27 am.
Please read my above post at October 10, 2013 at 4:48 pm. This link jumps to it
http://wattsupwiththat.com/2013/10/10/the-sun-does-it-now-go-figure-out-how/#comment-1443729
Please note that Dr Svalgaard said he agrees the points I made in that post.
Richard
Equally, the radiative effect of CO2 is not enough to cause serious warming.
Notwithstanding that, we have been told for the last 30 years that it will destroy climate and life on earth as we know it.
Thanks Richard, when I hit a thread with >150 comments, I admit that I don’t have time the read them all.
@Mosh
“Here are all the forcings: C02, CH4,halocarbons, N2O, C0. NMVOC, No3,NH3,S02,Black Carbon, Organic Carbon, Mineral Dust, Aerosol, Aircraft (contrails), Land Use, Solar.”
So water vapor, the GHG primarily responsible for forcing the Earth’s temperature to rise above its expected black body temperature (255K -> 288K), has less “IPCC-forcing” than the (mostly man-made) ingredients listed above?
Except for contrails, of course. Because they’re made by those flatulent humans. But natural WV has no ‘forcing’. Do I understand correctly?
😐
The solar d**niers have convinced me.
Clearly, unicorns must have caused the MWP and previous warm periods. The sun couldn’t possibly have.
– – – – – – –
Stan Robertson,
Thank you for a tightly reasoned discourse that will be useful to encourage more research on how the sun modulates the ocean temps; given that a significant set of observations reasonably show that there is a basis for saying that it has.
Personal Note: the solar discussions over the years at WUWT constitute, I think, the best prototype science dialog in the climate blogosphere. A certain Northern California based Dane has been central to the discourse; replying to virtually every single comment addressed to him (thanks Leif).
John
Not only “The solar d**niers”
Let us recall the famous work – paper by H. von Storch (http://www.academia.edu/4210419/Can_climate_models_explain_the_recent_stagnation_in_global_warming): “Of the possible causes of the in consistency, the underestimation of internal natural climate variability on decadal time scales is a plausible candidate, but the influence of UNACCOUNTED EXTERNAL forcing factors or an overestimation of the model sensitivity to elevated greenhouse gas concentrations cannot be ruled out. The first cause would have little impact of the expectations of longer term anthropogenic climate change, but THE SECOND and particularly the third would. […]”
“…variations in solar insolation or activity still require rather speculative [but not impossible] amplification mechanisms that could contribute to the observed recent decrease in global warming.”
… speculative … – it’s not the fault of the skeptics that insufficient research relates to the great very important topic.
My “favorite” quotation with Bard and Frank: “Overall, the role of solar activity in climate changes — such as the Quaternary glaciations or the PRESENT GLOBAL WARMING — remains unproven and most probably represents a SECOND-ORDER EFFECT.”
And this is what must be examined …
the sun does it now go figure out how
It ain’t simple, but the data shows that as the sun twinkles the Earth shakes
http://www.vukcevic.talktalk.net/SSN-NAP.htm
http://www.vukcevic.talktalk.net/APS.htm
Since 1955, the Earth has accumulated about 19 x 10^22 joules of Energy.
The Sun, however, has put down on Earth about 22,400 x 10^22 joules of Energy over that same timeframe.
http://s9.postimg.org/7iqicpfsv/Earth_Energy_Accumulation_vs_Solar_Energy_Q2_201.png
That is where you answer is. We are thinking about the very small changes in Solar Irradiance, but the Sun is still hitting the surface with 386.4 x 10^22 joules of Energy/photons each and every year.
Solar energy can accumulate in the Earth’s rocks, water, vegetation, ice and atmosphere over any time period. It accumulates and drawsdown on a per second basis, each hour, every day, certainly throughout the seasonal cycle and even annual or decadal timeframes.
For example, if your live in the Northern Hemisphere, your location is at its coldest about January 19th each year. For the next 182 days, your backyard then starts to accumulate about 0.1 W/m2 of energy each day (on average) until your backyard becomes the warmest it will get on July 19th. Then the cycle reverses and your backyard loses about 0.1 W/m2 until January 19th again.
Since this clearly happens, there is no reason why it doesn’t also change from year to year so that January 19th has 0.3 W/m2 more of energy than it had the previous January 19th. Maybe it is 0.5 W/m2 more than January 19th of 25 years earlier.
Start accumulating the numbers over time and the answer could emerge from that because it is more realistic of what really happens. The rocks and soil and water and ice accumulate/drawdown energy over time.
And
– – – – – – – –
Bruce Cobb,
I assume you are referring back to Mosh’s interjection of unicorns into the wonderful thread initiated by Stan Robertson’s well done sun/ocean essay.
I think Mosh has performed, with his unicorn interjection, an intellectual acrobatic known as ‘the inverted Black Swan Maneuver’. It works within the so-called lukewarmer meme, otherwise it does not.
John
For the topic of this post (also last comment) is important this textbook: Impacts of multi-scale solar activity on climate. Part I: Atmospheric circulation patterns and climate extremes, Weng, 2012. (http://link.springer.com/article/10.1007%2Fs00376-012-1238-1), this proposal (of it) I recommend to all, but especially authors of IPCC reports:”The atmospheric amplifying mechanism indicates that the solar impacts on climate should NOT BE SIMPLY ESTIMATED by the magnitude of the change in the solar radiation over solar cycles when it is compared with other external radiative forcings that do not influence the climate in the same way as the sun does.”
Not just the sun’s energy variation, but also the frequency domain variations, and particle output variations (and thus the electrical charge inherent in our atmosphere). We need to holistically think of these parameters to be able to come to grips with the sun’s effect on our climate.
To focus solely on solar energy output variations restricts us to a very myopian view of our immediate universe.
To think that straightforward energy inputs are “amplified” (some kind of positive feedback) requires alot of evidence. Nature does not easily produce positive feedback (ice/snow and resulting albedo-change effects are an exception). Negative feedback rules. Remember CO2 & purported warming amplifications? Same general situation here.
lsvalgaard says:
October 10, 2013 at 11:32 pm
The albedo is basically determined by clouds. It takes a lot of energy to make clouds. The solar wind does not have a lot of energy.
================
chemistry provides the answer. the solar wind acts as a catalyst to cloud formation. As a catalyst, the solar wind alters the rate of cloud formation without any requirement to supply energy.
Many mechanism have been proposed by which this can happen. Currently, the cause is unknown. What the author has shown is simply that such a mechanism much exist, outside of TSI.
Again, like the discovery of the outer planets. We knew they must exist because of the effect they had, long before they were discovered.
I have had lot of confrontations with the Stanford Solar Supremo, but he is correct, TSI doesn’t vary sufficiently, but it supplies enough energy to the point where all of the Arctic’s ice could disappear, as it did in the past. .
The Arctic ice was not melted by variability in the TSI, it was melted by the warm Atlantic currents. Heat is absorbed in the equatorial regions, and what varies far more then the incoming TSI is ratio of energy radiated back to the space and the energy moved pole-ward by currents. Only natural non-climatic force that can shift this ratio is the Earth’s tectonics.
http://www.vukcevic.talktalk.net/APS.htm
No, the unicorns all died when they sacrificed themselves for us to take all the excess heat to the bottom of the ocean. My proof is that there is now not even one unicorn to be found.
@tom0mason>”Not just the sun’s energy variation, but also the frequency domain variations, and particle output variations”
But TSI encompasses _all_ (as in ‘total’) the energy in the Sun’s elecromagnetic radiation (EMR) spectrum. What other ‘frequency domain’ did you have in mind?
Solar energy emitted by particles is miniscule, in comparison to EMR.
John Day says:
October 11, 2013 at 6:34 am
Solar energy emitted by particles is miniscule, in comparison to EMR.
============
A virus is miniscule. The energy it supplies is miniscule at best. For all intents and purposes zero. Yet it can radically alter the chemistry of objects that in comparison are almost infinitely more massive.
Leif, I believe that you have stated in past comments (not on this thread, but on this blog) that you believe that the dearth of sunspots and the present expected solar minimums will not lead to declining temperatures. And you believe that the correlation between, say, the Maunder Minimum and the Little Ice Age is largely or even exclusively coincidence. Can you expand upon that?
It seems to me that TSI may not be the only solar mechanism that affects our climate or global temperature. As some commenters have proposed, there could be other mechanisms at play, ripple effects as it were. For example, deep solar minimums may somehow unleash more volcanic eruptions which cool the earth, albeit in apparently short timeframes.
Any thoughts? I don’t find this addressed on your blog, but may have missed it. Any insight would be appreciated.
***
lsvalgaard says:
October 10, 2013 at 9:54 pm
Please explain why that doesn’t matter and why the bottom of the ocean after billions of years of conduction has not reached the average yearly surface temperature. Again: I’m trying to learn, not to argue.
***
As you say, deep ocean water @ 4C has 15C avg water-temp above, and 100C rock-temp just a mile or so below the sea-bottom, thus one has to conclude that it’s highly insulated, and that heat-transfer rates in/out of those ocean depths are very small.
They’re working w/300m depth — that seems roughly correct for a mixing zone, but IMO means changes below that have little effect on climate and no “pipeline-heat” there.
beng says:
October 11, 2013 at 6:25 am
To think that straightforward energy inputs are “amplified” (some kind of positive feedback) requires alot of evidence.
=========
a catalyst does not involve positive feedback. look in the mirror and you will see nature using extremely complex catalysts to produce a result that would be impossible otherwise. these catalysts do not add energy to the reaction. they lower the energy at which the reaction can take place, and thus increase the reaction rate, without adding any energy to the reaction.
I’m still curious about the claim of 0.33 W/M2.
Joanna Haigh published in the royal society that TSI has increased by 3-4 W/M2 since the end of the LIA. If you take that only 45% of that reaches the surface, [we’ll make it easy and say 50%], that equates to 1.5-2 W/M2 increase since the LIA. That is considerably greater than 0.33 W/M2, and given that the Ocean stores heat, moves it around, releases it, etc … it would seem that the OP presentation is support that the TSI itself is in fact a significant contributor.
beng says:
October 11, 2013 at 6:58 am
As you say, deep ocean water @ 4C has 15C avg water-temp above, and 100C rock-temp just a mile or so below the sea-bottom, thus one has to conclude that it’s highly insulated, and that heat-transfer rates in/out of those ocean depths are very small.
==============
unlikely. insulation cannot explain the uniformity. If the result was due to insulation there should be a gradient according to latitude. The lack of any such gradient argues that the effect is dynamic, that the cold water is in continual re-supply (from the poles?), and that the resupply is massive. The 4C temperature is explained as a result of the expansion of water above and below 4C.
@berple>”A virus is miniscule. …”
Yes, but tom0mason was addressing “particle output variations“, so changes in the solar wind, when it’s not firmly established/accepted that the solar wind per se has any lasting impact on climate. So would you expect changes in that regime to have more impact? (Not cosmic rays, BTW, they don’t come from the Sun)
Personally, (since we now know the unicorns died) I think it has to be changes in the flapping rates of those butterflies on the other side of the world. We know they can change the course of mighty hurricanes.
:-]
At a mean temperature of 288 oK, the sea surface will emit about 390 watt/m2 of surface thermal infrared radiation.
This is simply misunderstood, it will radiate that much if air above sea is 0ºK.
This is pure fictious. If the surface temperature is 288 K, air above it might be 286K. Temperature difference is only approx 2K, when you calculate using these with Stefan Bolzman law or look from this engineering toolbox table, you can see that heat radiated is only few watts/m2. http://www.engineeringtoolbox.com/radiation-heat-transfer-d_431.html . Heat radiation is a minor part of heat radiation from surface to air, approx 98% is heat transfer via conduction. CO2 can trap very specific waveleghts and that happens in few meters above surface, that heat is transfered very soon to other atmosphere molecules via convection. CO2 has nothing to do with warming atmosphere, in contary it is a good cooler, cause as a 3- atomic molecule it can emit energy to space in top of atmosphere. Without increased CO2 we would have much warmer atmosphere, because less energy is radiated to atmosphere. CO2 is much more cooler than warmer.
Lief, et. al.;
‘TSI does not vary sufficiently . . .’
Vary sufficiently from what? Our observational time frame is completely unacceptable as a touchstone. The Earth has been warming, rather suddenly and quickly for some 20 thousand years, before that it was gradually cooling for some 125 thousand years, before that it warmed, suddenly and quickly for about 20 thousand years.
Do we know what the earth’s mean equilibrium temperature should be at a given TSI?
Do we know what the TSI was 150 thousand years ago? 50? 10?
The oven is on. Its warming up. How long does it take to reach equilibrium? If you cannot look at the Sun’s TSI and predict, very accurately, what the Earth’s equilibrium heat content (notice that; heat content, not surface T) should be and how long it will take to reach that equilibrium, then just about everything else the ‘climate witchdoctors’ are talking about is next to useless.
We do not know the variability of the sun. The reconstructions and so forth that I have seen go back no farther than 10 thousand years. The earth, according to antarctic ice core reconstructions as a proxy for global temperature, started warming, as I said, some 20 thousand years ago, quite suddenly and quite rapidly following a long cooling period.
Lief, you claim that the TSI change is insufficient to cause the change in surface T. How do you know what governs surface T if you cannot even model the overall heat content of the planet (there’s that heat content thing again)? The oceans certainly have a lot more control over the temperature of the atmosphere than CO2. The Cloud experiments at CERN could overturn the entire CAGW industry. And, as a final ‘coup de grace’ to this rebuttal of your argument; if delta TSI is insufficient to cause the observed warming because it doesn’t provide for enough additional energy at the surface, consider that CAGW provides for the observed warming sans any additional energy whatsoever. Zero. Maybe a 9% TSI equates to just enough added shortwave reachi ing the Earth to increase global photosynthesis just enough to result in higher CO2 . . . maybe CO2 induced global warming is itself a positive feedback of a very slight increase in TSI?
In short; I disagree that you can shoot down TSI out of hand, based on some authoritative knowledge of the downwelling radiation, based on the fact that we do not have a model to get us to equilibrium and thermal inertia for the Earth. Without that little else can be said.
Even our scientists (at least the honest ones) admit that there is a great deal more they don’t know than what they do know.
Ulric Lyons says:
October 11, 2013 at 3:19 am
Looking how well the SABER data follows the geomagnetic signal, the solar wind appears to be responsible for a large proportion of the heating of the upper atmosphere.
Up there the density is a billionth of sea-level density so there is almost no heat and hot air does not descend.
David Riser says:
October 11, 2013 at 3:49 am
I would like to point out that the farthest away satellite was launched in 2010 and does not provide data to the TSI dataset.
The SOHO satellite which forms the basis for the PMOD TSI dataset was launched in 1995.
So your still measuring from within the atmosphere for this data
Not at all. Once you are above 20 km [the usual definition of TOA Top of Atmosphere] the atmosphere is so thin that it does not influence TSI to the extent we can measure it.
Madman2001 says:
October 11, 2013 at 6:56 am
the Maunder Minimum and the Little Ice Age is largely or even exclusively coincidence. Can you expand upon that?
http://www.leif.org/research/Does%20The%20Sun%20Vary%20Enough.pdf
@me>(Not cosmic rays, BTW, they don’t come from the Sun)
Yes, GCR’s are modulated by the Sun. But still those effects on climate not firmly established, in spite of recent research by Svensmark et all.
The Earth’s magnetic field acts a shield to protect us from the ravages of solar wind. Else our atmosphere (and climate) would have been stripped away eons ago.
The obsession with radiation is a hold over from the cold war, when nuclear weapons and radiation fears dominated the world, both politically and scientifically. This obsession drives the IPCC in its obsession with CO2 and LW radiation.
We forget that Nature does not rely on brute force alone. Nature is also extremely subtle. Time and time again nature shows us that what we believe is impossible is due to the limitations of our minds, not the limitations of the universe around us.
The weather, the weather, everyone talks about, never does a thing about……..stay tuned for the next artificial crisis and chaos. A opportunity for change! 😉
John Day says:
October 11, 2013 at 7:21 am
The Earth’s magnetic field acts a shield to protect us from the ravages of solar wind. Else our atmosphere (and climate) would have been stripped away eons ago.
===========
yet we are told that the solar wind has very little energy. are we to thus conclude that something that can strip the atmosphere from a planet cannot alter the climate?
the earth’s magnetic field only partially shields us from the solar wind. the solar wind enters the earth’s atmosphere at the poles. like an ionizing air cleaner, the charged particles in the solar wind affect the composition of the atmosphere, changing the chemistry of the atmosphere, changing the weather and thus the changing the climate.
Dr. Isvalgaard,
I read the two papers you gave me. The Laken paper is very strange to me, it appears that it is written to specifically refute Svensmark 2012. The language appears to be more an essay than a scientific paper calling Svensmarks theory controversial and concluding:
“By virtue of a lack of strong evidence detected from the numerous satellite- and ground-based studies, it is clear that if a solar- cloud link exists the effects are likely to be low amplitude and could not have contributed appreciably to recent anthropo- genic climate changes.”
Laken et al partly base their conclusions based off temperature and small cosmic ray fluctuations having little correlation but seem to be far less critical of their own priori of an anthropogenic connection which has even less correlation over the same sattelite period. I am also unimpressed by evidence submitted that models do not show the cosmic ray effect.
The conclusion that I drew from that paper was that large fluctuations showed correlation but the correlation of smaller fluctuations is difficult to detect because of small sample sizes leading to statistical insignificance and satellite data could have problems at the poles and with line of sight detection. It seemed to me that more data would be needed to reject or confirm Svensmark’s hypothesis and I think dismissing it based on difficulties gathering cloud data is a strange conclusion.
Maybe I’m being to skeptical here but based on the actions of many in the climate community to accept papers like MBH98 uncritically and attack people who showed it was incorrect I am very cautious to take any paper at face value especially when it appears to be specifically written to support the “anthropogenic connection” which was not even discussed in the paper outside of the conclusions.
I don’t disagree with the second paper but I’m interested in seeing Svensmark’s theory on ionization effecting cloud feedbacks further investigated before I think you could calculate where, when and how much the effects may be.
@berple>something that can strip the atmosphere from a planet cannot alter the climate?
Without its magnetic field, Earth’s climate would be somewhat like Mars. But Earth has a magnetic field, so that’s a moot point. The solar wind seems to have no big impact on climate.
What about little impacts? Well, there was a paper presented on WUWT a day or so ago, that claimed that changes in the By component of the IMF (which is carried by the solar wind) produced some measurable climatic artifact. Let’s assume it’s true, how will that impact life on Earth?
I’m not denying that could be significant impact from phenomena like this, but what are they?
So you shouldn’t worry about until it has been observed, or someone has reliably predicted its consequences.
“John Day says:
October 11, 2013 at 8:00 am”
The Sun will, eventually, consume this rock, magnetic field or not!
shenanigans24 says:
October 11, 2013 at 7:39 am
Wonderful well thought out reply.
New paper published yesterday by Leif’s friend Judith Lean finds the difference in TSI measured during the 1990s by solar radiometers vs. with SORCE could alone account for 0.4C temperature change, without any amplification or consideration of 2nd order effects. But, no problem, all we have to do is change the cloud cover in our models to make it all balance out on a global basis… Hold on, that changes regional climate simulations…
The Impact of Different Absolute Solar Irradiance Values on Current Climate Model Simulations
http://journals.ametsoc.org/doi/abs/10.1175/JCLI-D-13-00136.1?af=R
Simulations of the pre-industrial and doubled CO2 climates are made with the GISS GCMAM using two different estimates of the absolute solar irradiance value, a higher value measured by solar radiometers in the 1990s and the lower value measured recently by SORCE. Each of the model simulations is adjusted to achieve global energy balance; without this adjustment the difference in irradiance produces a global temperature change of 0.4°C, comparable to the cooling estimated for the Maunder Minimum. The results indicate that by altering cloud cover the model properly compensates for the different absolute solar irradiance values on a global level when simulating both the pre-industrial and doubled CO2 climates. On a regional level, the pre-industrial climate simulations and the patterns of change with doubled CO2 concentrations are again remarkably similar, but there are some differences. Using a higher absolute solar irradiance value and the requisite cloud cover affects the model’s depictions of high latitude surface air temperature, sea level pressure, and stratospheric ozone, as well as tropical precipitation. In the climate change experiments it leads to an underestimation of North Atlantic warming, reduced precipitation in the tropical Western Pacific, and smaller total ozone growth at high northern latitudes. Although significant, these differences are typically modest compared with the magnitude of the regional changes expected for doubled greenhouse gas concentrations. Nevertheless, the model simulations demonstrate that achieving the highest possible fidelity when simulating regional climate change requires that climate models use as input the most accurate (lower) solar irradiance value.
Earth’s wobbles known as Milankovitch cycles, occur on time scales of between 20,000 and 100,000 years.
Neptune and Uranus affect solar activity in Solar Grand Minima as well as Solar Cycle Modulation.
Tectonic activity and variation in earth radius affects rotational velocity.
GCR volume affects cloud cover.
Variations in Circumpolar Vortex.
…and the sun.
John Day says:
October 11, 2013 at 7:21 am
I’m not sure if our atmosphere would have been totally stripped away without a magnetosphere generated from within the planet, or be as tenuous as Mars’.
Venus has an atmosphere an order of magnitude denser than ours, despite lack of an internal magnetosphere. The solar wind does induce one in the planet’s ionosphere, as it strips away the top of the atmosphere there:
http://www-ssc.igpp.ucla.edu/personnel/russell/papers/venus_mag/
Mars of course serves as a counter-example in support of your hypothesis. Its wispy atmosphere (an order of magnitude thinner than ours) would probably be thicker if the Red Planet had an internal magnetosphere.
I agree that Earth’s magnetosphere has been very important to conditions here, including the development of life, but wonder why Venus’ atmosphere remains so dense after four billion years. Earth has apparently lost about half its original N2 over the eons, but probably more from its incorporation into the crust rather than leakage or stripping away into space.
lsvalgaard says:
October 10, 2013 at 4:30 pm
Louis says:
October 10, 2013 at 4:20 pm
How good are we at measuring total TSI?
VERY good: We can measure variations in TSI with a precision of 0.007 W/m2 out of 1361 W/m2 or as 10 feet on the distance between San Francisco and Los Angeles.
————————-
Precision is not the same thing as accuracy. Precision means ‘Repeatability’ while Accuracy is a measure of closeness to the true value. So all results could be within 10 feet of each other but your error might be many miles. If you are claiming an accuracy of 0.007W in a measurement of 1361W then you are saying that the accuracy is 0.0005%. Now, maybe this is so but it means that your calibrating system has an accuracy of at least 3 times this (some people prefer 10 times), i.e. 0.00016%? Maybe this is possible, I don’t know the specs of the particular system but I can say that achieving and maintaining 0.005% accuracy (yes 0.005% not 0.0005%) in electronic equipment is quite challenging. How often is the equipment re-calibrated? Long term drift is a notorious issue in electronic equipment.
lsvalgaard says :
The article says that 1 W/m2 in gives you 3.6 W/m2 out [actually 0.09 and 0.33, but you should be able to figure that out on your own]. In nature you don’t permanently get something for nothing.
i do not think stan robertson,nor many others think that. but as temperature fluctuates over short and long periods of time,it is quite obvious that energy in/out imbalances exist.
lsvalgaard says:
“Up there the density is a billionth of sea-level density so there is almost no heat and hot air does not descend.”
It has a very large volume, it gets to very high temperatures, and it radiates.
How does someone write an article so little presenting what its very own sources point out? I know on the order of 99% of people don’t click on links and read, but, even so, this is disappointing.
“Shaviv, Nir 2008, Using the oceans as a calorimeter to quantify the solar radiative forcing, Journal of Geophysical Research, 113, A11101 http://www.sciencebits.com/files/articles/CalorimeterFinal.pdf”
Adding in a bit of quotation from such:
TSI variation over a typical 11 year solar cycle just corresponds to a “globally averaged irradiance variations of 0.17 W/m^2”
However, “solar cycle induced variations in low altitude cloud cover [Marsh and Svensmark, 2000b], presumably from CRF [cosmic ray flux] modulation over the oceans (where CCNs are most likely to be a bottleneck), give rise to a radiative imbalance which can be estimated [Marsh and Svensmark, 2000a; Shaviv, 2005] to be of order 1.1 ± 0.3 W/m^2 over the past two cycles.”
Notice the former, for TSI variation, is 0.17 W/m^2, but the latter is so much more.
As the author of the referenced paper, Dr. Shaviv, discusses further elsewhere, variation in near-constant TSI is less substantial than the several times larger effect of variation in cloud seeding by cosmic ray flux.
If someone spreads aluminum foil reflector over a window, its subsequent effect on heat (sunlight reflected over time afterwards) is not limited to the energy which was involved in unrolling it. Likewise, when ionizing radiation helps seed condensation nuclei, whether in a cloud chamber (invented in 1912 A.D., like http://www.lns.cornell.edu/~adf4/cloud.html ) or in the larger atmosphere, the energy of extra sunlight which can be reflected (by white clouds in the latter case) has almost nothing to do with the relatively tiny energy of the original radiation, able to differ by many orders of magnitude.
As Dr. Shaviv notes:
“One can actually quantify empirically the relation between cosmic ray flux variations and global temperature change, and estimate the solar contribution to the 20th century warming. This contribution comes out to be 0.5 +/- 0.2 C out of the observed 0.6 +/- 0.2 C global warming (Shaviv, 2005)”
http://www.sciencebits.com/CO2orSolar
Back to this WUWT article:
“Several researchers, including Nir Shaviv (2008), Roy Spencer (see http://www.drroyspencer.com/2010/06/low-climate-sensitivity-estimated-from-the-11-year-cycle-in-total-solar-irradiance/) and Zhou & Tung (2010) have found that ocean surface temperatures oscillate with an amplitude of about 0.04 – 0.05 oC during a solar cycle.
Of those three sources mentioned, at least two out of three have observed how the effect of TSI+GCR variation is several times more than TSI variation alone. The first, Dr. Shaviv, was just mentioned. The second, Dr. Spencer, did an analysis and observed, for a 2000-2010 example period:
“The cosmic ray (indirect) forcing is about 2.8 times that of the solar irradiance (direct) forcing.”
http://www.drroyspencer.com/2011/05/indirect-solar-forcing-of-climate-by-galactic-cosmic-rays-an-observational-estimate/
There’s a lot of propagandist spam and rewriting of historical data, as ironically the CAGW movement team is better at recognizing their Achilles’ Heel than most casual skeptics, due to having far more time and money given and spent. However, as illustrated in http://img176.imagevenue.com/img.php?image=81829_expanded_overview_122_424lo.jpg , there is not unexplainable mystery but rather superb explanation of the LIA, global cooling scare period, global warming period, and even the recent decline in global temperatures once properly studying real historical data (with some understanding of cosmoclimatology) rather than fudged hockey-stick type junk.
richardscourtney says:
October 10, 2013 at 4:48 pm
“external variations such as the Svensmaark Effect which may alter cloud cover (n.b. this possible effect is galactic and not solar).”
Variation in galactic cosmic ray flux received at Earth’s orbit is primarily solar modulated on timescales of years, decades, and centuries. Relative deflection (partial shielding by the inner solar system) varies in step with variation in the strength of the sun’s interplanetary magnetic field and solar wind. On longer timescales (such as millions of years), motion of the solar system around the galaxy becomes important. But, for instance, neutron count from galactic cosmic rays varies by several percent over even a few years (and up to tens of percent since the Little Ice Age), due to solar modulation.
To be blunt, that is one of the most basic aspects of understanding cosmic rays in the context of climate (and also well known for the effect on radiation hazards for space missions), so it is apparent that you are commenting without having ever read such as http://www.sciencebits.com/CosmicRaysClimate . Reading WUWT articles is no substitute for that (and not for looking at http://img176.imagevenue.com/img.php?image=81829_expanded_overview_122_424lo.jpg as well), as too much is left out, either never mentioned or mentioned haphazardly years apart in partial pieces which few would put together.
Back at the end of comments on http://wattsupwiththat.com/2013/09/04/black-carbon-soot-shrank-the-19th-century-glaciers/ , you were polite, but something which really stood out to me is that you spent time writing an entire reply apparently without even for a moment clicking on the one and only link in my post there. Nobody is obligated to read or look at anything if not having the time, but, if having the time to write comments…
“Recent variability of the solar spectral irradiance and its impact on
climate modelling”
http://www.atmos-chem-phys.net/13/3945/2013/acp-13-3945-2013.pdf
“The results of the CCM (Chemistry Climate Model) simulations, forced with the SSI (Solar spectral irradiance) solar cycle variations estimated from the NRLSSI model and from SORCE (Solar Radiation and Climate Experiment) measurements, show that the direct solar response in the stratosphere is larger for the SORCE than for the NRLSSI data. Correspondingly, larger UV forcing also leads to a larger surface response.”
“A new study very well worth reading by Ermolli et al. (2013) looks at the influence of the spectral variation of solar radiation (SSI), especially the ultraviolet spectrum: It is fluctuating much more strongly, by up to 10% between a quiet and an active sun. And at low solar activity, it generates precisely the pattern in the wintertime that we’ve been seeing since 2006: The North Atlantic Oscillation (NAO), which impacts the temperature in the Eurasian region especially in the wintertime, is controlled and effected by the UV radiation of the sun. When there is less solar activity, it gets colder in the region”
See more at: http://notrickszone.com/2013/10/07/current-sunspot-cycle-weakest-in-190-years-recent-model-temperature-deviation-due-to-solar-activity-experts-say/#sthash.gW1kXASO.dpuf
highflight56433 says:
October 11, 2013 at 9:14 am
Thanks for those studies.
Much as some here suspected, small changes in one spectral component of TSI can make a detectable difference in weather & maybe climate, if the papers be credible.
***
ferd berple says:
October 11, 2013 at 7:00 am
a catalyst does not involve positive feedback. look in the mirror and you will see nature using extremely complex catalysts to produce a result that would be impossible otherwise. these catalysts do not add energy to the reaction. they lower the energy at which the reaction can take place, and thus increase the reaction rate, without adding any energy to the reaction.
***
Climate is not governed significantly by chemical reactions — it’s a sun-powered, atmospheric-driven heat-engine.
“Climate is not governed significantly by chemical reactions — it’s a sun-powered, atmospheric-driven heat-engine.”
Really? So ions do not attract other molecules such as water to form clouds? Without clouds the climate would be the same as what?
wayne says:
October 11, 2013 at 12:14 am
Dr. Robertson, (are you ‘bones’?)
————————————–
Yes
wayne says:
October 11, 2013 at 12:39 am
Seems I left out a second question, could the albedo have decreased over the 1955 to present period? Say leaving some wiggle room and take 0.3% times six decades or about -0.005 in the albedo? Don’t know that either, have never looked into it.
—————————————-
Yes, but it has not been measured in any reliable way. The global average solar radiation that reaches the earth has not been measured reliably enough to say how much it has changed. There have been surface measurements for Antarctica (if I recall correctly) over a solar cycle that show ~ 1% variation; easily more than enough to cause the surface temperature variations.
It would probably cost no more than that of the ARGO buoy system to collect a representative sample of surface radiation measurements for the earth surface, but it would be difficult to keep the instrument surfaces suitably clean. In the meantime, the ARGO system provides for a more detailed calorimetry analysis and surface energy distribution than I have done here.
SteveP says:
October 11, 2013 at 8:53 am
Precision is not the same thing as accuracy. Precision means ‘Repeatability’ while Accuracy is a measure of closeness to the true value.
I guess you missed the point. SORCE measured TSI with an accuracy of 0.5 W/m2 but with a precision and stability of 0.007 W/m2. For variations of TSI it is the precision that is important. For stability it is important to measure the degradation of the instruments carefully.
Ulric Lyons says:
October 11, 2013 at 9:01 am
“Up there the density is a billionth of sea-level density so there is almost no heat and hot air does not descend.”
It has a very large volume, it gets to very high temperatures, and it radiates.
As there is almost no matter it matters not what the volume, temperature, and radiation are. If the volume were 1000 times larger and the temperature 10 times higher [both values much too high], the energy content would still be 100,000 times smaller than the lower atmosphere.
Hockey Schtick says:
October 10, 2013 at 3:16 pm
For a start, here’s 50 papers describing potential solar amplification mechanisms
lsvalgaard says: October 10, 2013 at 3:23 pm
None of those explain how 3.6 times more heat reach the surface than the variation of what the Sun puts out…Otherwise the climate system would be a nifty energy producer: you put 10 units in and you get 36 out. I want one of those 🙂
Allan Says:
Hello Leif, I hope you are well. Happy Canadian Thanksgiving!
This point has probably already been covered above.
As you correctly state the system is not producing energy ( “from thin air” :-] ).
The term “amplifier” is used loosely and is somewhat imprecise.
IF indeed the Sun is the primary controlling mechanism in the observed short-term (e.g. ~11 year Solar Cycles, ~80-90 year Gleissberg Cycles) warming and cooling periods that seem to correlate with minor solar variation according to many papers, then either:
1. There is some solar parameter that has a greater much variation than TSI.
AND/OR
2. There is a form of “amplifier” that enhances the solar variation.
AND/OR
3. Something else.
Let’s explore Option 2. [I know this is all obvious to you, but I just wanted to write this down so people can shoot at it.]
The climate system is not producing energy – let’s not start out by breaking the Laws of Thermodynamics.
But this is not necessary to explain the observed variation in ocean temperatures, etc.
The amplifier can work as a “double-negative”, for example per the Svensmark hypo, by increasing cloud cover and thus reducing TOTAL solar input to Earth. The energy is already in the system, and is being negatively modulated by increased clouds. [Greater solar activity > Less cosmic radiation > Less clouds > Warmer Earth]
So if you prefer a better term than “amplifier” (I don’t), then call it something else – such as “double-negative amplifier”.
OK – all elementary and you know it, but it refutes your above suggestion that the system has to create energy in order for such an “amplifier” to work.
I know we disagree on the following point – I think the Sun rules Earth’s climate (somehow – not sure about the dichotomy between the ~~90-year Gleissberg Cycle and the 60-year PDO) and you say climate just ‘goes up and down’.
I really hope you are right, because if I am right we are about due for some global cooling that may be severe, and increasingly, I hate the cold.
I bid you a wonderful day, and leave you with Chaucer’s take on solar influence (but did the word “obliquity” even exist then, or was the Earth still flat?):
WHAN that Aprille with his shoures soote
The droghte of Marche hath perced to the roote
Best personal regards, Allan 🙂
http://wattsupwiththat.com/2009/01/10/polar-sea-ice-changes-are-having-a-net-cooling-effect-on-the-climate/#comment-74024
Allan M R MacRae (19:49:11) “Climate change is natural and cyclical.”
Leif Svalgaard (19:57:40) “I would not disagree with that, except for downplaying the ‘cyclic’ bit. I don’t think there is strict cyclicity, just that it ‘goes up and down’.”
It has always impressed me that the role of biology is relegated to some insignificant background in climatology.
The Earth’s atmosphere is what it is today because of biological action driven by biologically available energy from the crust and the Sun. Biological action on the atmosphere did not stop some time in the past just as evolution did not. Evolution of the atmosphere and biology are just as active as they have been in the past. The total radiation energy available from the sun may be fairly constant, but where in the spectrum the energy is delivered to the surface of the Earth, I am quite sure, has very measurable effects on our crust and atmosphere and should not be neglected. The biological signature can be clearly seen in the Mauna Loa CO2 spectra. The fossil hydrocarbons we are using were put there by biological activity.
There are probably thousands of feed foreward and feed back loops, some big some small, that affect our climate on many levels, by ignoring biological action we are probably ignoring some very significant ones.
Allan MacRae says:
October 11, 2013 at 9:54 am
IF indeed the Sun is the primary controlling mechanism in the observed short-term (e.g. ~11 year Solar Cycles, ~80-90 year Gleissberg Cycles) warming and cooling periods that seem to correlate with minor solar variation according to many papers
This is precisely the sticking point. There are many claims. I probably know most of them put forward the last 350 years starting with Riccioli. I have yet to see one that is convincing. You could pick the one that is most convincing to you and we can discuss that one in detail.
Allan MacRae says:
October 11, 2013 at 9:54 am
Chaucer knew the earth is a sphere, as did every other learned person in the 14th century & for a millennium previously in the Western world. Also many unlearned people, such as sailors, or even those who looked at the pictures in the stained glass windows of their churches.
http://en.wikipedia.org/wiki/Treatise_on_the_Astrolabe
otsar says:
October 11, 2013 at 9:58 am
Cloud condensation nuclei can be of biological origin:
http://en.wikipedia.org/wiki/CLAW_hypothesis
If the sun thru primary effects and secondary effects does not exert a major influence on the climate how does one reconcile the correlation between solar active periodsand warmer temperatures versus solar minimum periods and lower temperatures? A very simple question but true.
I have never seen a low solar quiet period correlate to a rise in tmeperatures, or a high active solar period correspond to a drop in temperatures. Never.
The TSI may be very constant but variations in the energy output at particular frequencies may be important. For example changes in UV output are thought to affect ozone and cause differences in the complex photo chemistry. This in turn might modulate cloud seeding or aerosol behaviour. I don’t think that much is known about the chemistry of the atmosphere. I would imagine that a brew containing lots of subatomic particles, sulphuric acid, aerosols and lightening discharges, oxygen and ionised matter is capable of all sorts of interesting reactions.
I would imagine that aerosol particle size would have a major influence on light scattering and hence albedo. How much is known about the factors that influence the dispersion and flocculation of these particles?
I have a suspicion that solar influences are indirect but could be quite powerful.
Lief says, “….Otherwise the climate system would be a nifty energy producer: you put 10 units in and you get 36 out. I want one of those :-)”
I do that with potatoes in my garden. In fact I do better than that. I plant ten and on a good year can get 200.
Plankton may be small potatoes in the eyes of many, but I’ll bet it notices small changes in TSI. I won’t dare, (this early in the day,) risk any guesses about how much more energetic it becomes, or how the heck you could measure such energy.
Allan MacRae says: October 11, 2013 at 9:54 am
IF indeed the Sun is the primary controlling mechanism in the observed short-term (e.g. ~11 year Solar Cycles, ~80-90 year Gleissberg Cycles) warming and cooling periods that seem to correlate with minor solar variation according to many papers…
lsvalgaard says: October 11, 2013 at 10:03 am
This is precisely the sticking point. There are many claims. I probably know most of them put forward the last 350 years starting with Riccioli. I have yet to see one that is convincing. You could pick the one that is most convincing to you and we can discuss that one in detail.
Allan says:
Aye, there’s the rub.
I like Nir Shaviv’s work and that of Jan Veizer.
For the short term:
Shaviv, Nir 2008, Using the oceans as a calorimeter to quantify the solar radiative forcing, Journal of Geophysical Research, 113, A11101 http://www.sciencebits.com/files/articles/CalorimeterFinal.pdf
For the longer term
Nir J. Shaviv and Ján Veizer, Celestial driver of Phanerozoic climate? GSA Today July 2003 *
http://cfa.atmos.washington.edu/2003Q4/211/articles_optional/CelestialDriver.pdf
Best, Allan
* Turning and turning in the widening gyre
The falcon cannot hear the falconer;
Things fall apart; the centre cannot hold;
Mere anarchy is loosed upon the world…
– Yeats (1919)
lsvalgaard says:
“As there is almost no matter it matters not what the volume, temperature, and radiation are. If the volume were 1000 times larger and the temperature 10 times higher [both values much too high], the energy content would still be 100,000 times smaller than the lower atmosphere.”
The thermosphere is around 1/50,000 of the total atmospheric mass, and in parts the temperature reaches 2000°C at times. But then there is less troposphere in the polar regions.
Allan MacRae says:
October 11, 2013 at 10:41 am
For the longer term
Nir J. Shaviv and Ján Veizer, Celestial driver of Phanerozoic climate? GSA Today July 2003 *
Has already been debunked, see: Overholt et al. 2009 e.g. cited in http://www.leif.org/EOS/1303-7314-Cosmic-Rays-Climate-billion-yrs.pdf
For the short term:
Their Figure 4 is the actual data. The correlations are underwhelming, but if we apply a bit of good will as in Figure 5, we can see a SST swing of 0.1C which is what we would expect from TSI alone [this is undisputed], so if this is your strongest evidence I will agree with you that the observed variation of TSI gives rise to the observed variation of SST [all of 0.1C]. But I would not call that a major driver of climate.
Allan and Henry,
Could the earths response to TSI be more in terms of a delayed reaction by feedbacks than a direct heating by the average change to TSI? What I mean by a delayed reaction is that it takes a set amount of time for a feedback to react to a spike in TSI, so a large spike would give a lot more than average heating. Once the heating started, after a time, feedbacks (call it Eschenbach effect) mitigate the heating. An idea like this would not be impacted by “average TSI” because TSI is extremely spikey and the sun provides more than enough total energy to bake the earth if there were no negative feedback effects. What are your thoughts?
v/r,
David Riser
Ulric Lyons says:
October 11, 2013 at 11:10 am
The thermosphere is around 1/50,000 of the total atmospheric mass, and in parts the temperature reaches 2000°C at times.
assuming the most favorable case where the temperature is 2000C everywhere [which it is not] that temperature is 7 times that at sea level so the energy content is a 7/50,000 = 0.00014 part of the troposphere. Not much.
But then there is less troposphere in the polar regions.
And it is brrr cold there [I have lived there]
Thank you milon,
You are absolutely correct that educated people knew that Earth was round in Chaucer’s time.
A spherical Earth was reportedly proposed by Pythagoras in the 6th century BC.
Chaucer lived from ~1343 to 1400. And Chaucer was interested in astronomy, so he almost certainly knew Earth was round.
Copernicus published “De revolutionibus orbium coelestium” (On the Revolutions of the Celestial Spheres) in 1543, which re-arranged the planets and put the Sun in just the right spot.
But Newton did not publish his theory of gravitation until 1687, so until then everyone was really worried about falling off a round Earth into space. 🙂
This of course was no worse than sailing off the edge of a flat Earth, the chief concern of ancient mariners.
I mean, if you really watched your step on a round Earth (and parted your hair right down the middle), then you were probably OK.
But of course they were ALL wrong:
The world is really a flat plate supported on the back of a giant tortoise, on the back of another even bigger giant tortoise, etc. It’s tortoises all the way down.
This is the origin of the mathematical concept of infinity.
Best, Allan :-]
Meanwhile, back at the Turtles, all the way down:
http://en.wikipedia.org/wiki/Turtles_all_the_way_down
The most widely known version, which obviously is not the source (see below), appears in Stephen Hawking’s 1988 book A Brief History of Time, which starts:
A well-known scientist (some say it was Bertrand Russell) once gave a public lecture on astronomy. He described how the earth orbits around the sun and how the sun, in turn, orbits around the center of a vast collection of stars called our galaxy. At the end of the lecture, a little old lady at the back of the room got up and said: “What you have told us is rubbish. The world is really a flat plate supported on the back of a giant tortoise.” The scientist gave a superior smile before replying, “What is the tortoise standing on?” “You’re very clever, young man, very clever,” said the old lady. “But it’s tortoises all the way down!”
—Hawking, 1988[1]
In 1905, Oliver Corwin Sabin, Bishop of the Evangelical Christian Science Church, wrote:
The old original idea which was enunciated first in India, that the world was flat and stood on the back of an elephant, and the elephant did not have anything to stand on was the world’s thought for centuries. That story is not as good as the Richmond negro preachers who said the world was flat and stood on a turtle. They asked him what the turtle stood on and he said another turtle, and they asked what that turtle stood on and he said another turtle, and finally they got him in a hole and he said. “I tell you there are turtles all the way down.”
—Sabin, 1905[2]
Many 20th-century attributions point to William James as the source.[3][4] James referred to the fable of the elephant and tortoise several times, but told the infinite regress story with “rocks all the way down” in his 1882 essay, “Rationality, Activity and Faith”.[5] In the form of “rocks all the way down”, the story predates James to at least 1838.[6]
In 1854 the story in the current form appears, attributed by bible skeptic Joseph Barker to preacher Joseph Frederick Berg:
My opponent’s reasoning reminds me of the heathen, who, being asked on what the world stood, replied, “On a tortoise.” But on what does the tortoise stand? “On another tortoise.” With Mr. Barker, too, there are tortoises all the way down.
—Barker, 1854[7]
There is an allusion to the story in David Hume’s Dialogues Concerning Natural Religion (published in 1779):
How can we satisfy ourselves without going on in infinitum? And, after all, what satisfaction is there in that infinite progression? Let us remember the story of the Indian philosopher and his elephant. It was never more applicable than to the present subject. If the material world rests upon a similar ideal world, this ideal world must rest upon some other; and so on, without end. It were better, therefore, never to look beyond the present material world.
—Hume, 1779[8]
From Space Weather, Radio Active Sun: http://spaceweather.com/images2013/10oct13/Sr_Oct092013_2155ut2821_Ashcraft.mp3?PHPSESSID=rcodv060h40hjc02o0ud17nri4
Allan MacRae says:
October 11, 2013 at 11:24 am
Those mariners would have to be very ancient indeed, since the ancient Greeks knew that the world is a globe. They could see the shadow of the Earth upon the Moon during eclipses. More importantly when sailing, the mast of another ship appeared before its hull & the highest buildings in a port before the lower parts of the looming city.
Greek sailors also noted the variation in the observable altitude & change in the area of circumpolar stars apparent between their settlements around the Mediterranean & Black Seas, roughly Latitude 30 degrees to 47 degrees N. The difference grew more pronounced once Greeks went up the Nile under the Ptolemies. Eratosthenes managed to measure the Earth fairly accurately in Egypt, c. 240 BC.
lsvalgaard says: October 11, 2013 at 11:15 am
For the longer term
Nir J. Shaviv and Ján Veizer, Celestial driver of Phanerozoic climate? GSA Today July 2003 *
Has already been debunked, see: Overholt et al. 2009 e.g. cited in http://www.leif.org/EOS/1303-7314-Cosmic-Rays-Climate-billion-yrs.pdf
Allan says:
Debunked is a very big word that implies a very strong degree of scientific certainly.
Shaviv and Veizer GSA2003 was previously “debunked” in EOS circa 2003, but that “debunking”, as I recall, was purest guano.
I had a quick glance at Overholt et al and am not overly shaken, or stirred.
But thank you for the reference. I have had no time since 2008 to pursue this subject in the detail that it requires.
I am sincerely grateful for those like you who do.
Best personal regards, Allan
Illogical? Which other energy sources do you have in mind?
Allan MacRae says:
October 11, 2013 at 11:46 am
Bond, Cycle Bond…
Allan MacRae says:
October 11, 2013 at 11:46 am
Debunked is a very big word that implies a very strong degree of scientific certainly.
Actually not if the hypothesis being debunked is itself on shaky ground, i.e. has little certainty to begin with.
milodonharlani says:
October 11, 2013 at 11:50 am
Bond, Cycle Bond…
There are no Bond cycles. There may be some variability of 1000-2000 yr time scale but they are not cyclic.
Thank you, Dr. Svalgaard (and Pamela and others above), after reading the above I believe I understand what the facts are. Here is what a non-scientist concluded from your fine teaching. I hope this encourages you, Dr. Svalgaard, for, hopefully, it shows that your teaching is good enough to help even a non-scientist learn. (Note: if I’m actually all mixed up, just ignore me — it isn’t your fault and I’m far too ignorant of the basics for you to waste any time correcting.)
The current state of our knowledge includes the following (list NOT exhaustive of what I learned above, just limited for sake of time):
1. While TSI can vary the surface temperature of the ocean, overall, it maintains sea surface (and, later, land surface) temperature; further, it cannot (by a magnitude of 3) heat the sub-surface depths to a measurable degree.
2. All Sun forces other than TSI are negligible v. a v. heating Earth.
3. “Cyclic” is an inaccurate term, here, for the peaks and valleys are not uniform.
4. The Earth’s tilting causes seasonal temperature variation; Sun’s input remains essentially constant.
5. While the Sun, like a human heart (not a perfect parallel, I realize), provides the basic energy for warmth, it does not cause any significant variation in the energy in Earth’s climate system.
The Sun is the homeostatic energy supplied by the heart that enables a violinist to simply live. It is the muscles in the arm and fingers that cause the variations in pitch, tempo, and dynamics that create beautiful (or ugly) music. Should the violinist faint and fall to the ground, the music would stop. That this would happen does not mean that the heart itself creates the variations that make the music a delight (or an annoyance). If the violinist tips the bottle a few too many times, altering his or her equilibrium, just before performing, the music will be affected, but the heart does not change.
In sum: The truism that, but for the heart’s beating, there would be no music
does NOT lead to the conclusion that music is caused by the heart.
lsvalgaard says:
October 11, 2013 at 12:01 pm
Some of your colleagues once dared to disagree. Maybe not solar-driven cycles at that frequency, but perhaps oceanic, although admittedly this wavelet analysis study (citing many of the usual “climate science” suspects) is from way back in 2007:
http://hal.archives-ouvertes.fr/hal-00330766/
The origin of the 1500-year climate cycles in Holocene North-Atlantic records
M. Debret 1, V. Bout-Roumazeilles 2, F. Grousset 3, Marc Desmet 4, J. F. Mcmanus 5, N. Massei 6, D. Sebag 6, J.-R. Petit 1, Y. Copard 6, A. Trentesaux 2
(01/10/2007)
Since the first suggestion of 1500-year cycles in the advance and retreat of glaciers (Denton and Karlen, 1973), many studies have uncovered evidence of repeated climate oscillations of 2500, 1500, and 1000 years. During last glacial period, natural climate cycles of 1500 years appear to be persistent (Bond and Lotti, 1995) and remarkably regular (Mayewski et al., 1997; Rahmstorf, 2003), yet the origin of this pacing during the Holocene remains a mystery (Rahmstorf, 2003), making it one of the outstanding puzzles of climate variability. Solar variability is often considered likely to be responsible for such cyclicities, but the evidence for solar forcing is difficult to evaluate within available data series due to the shortcomings of conventional time-series analyses. However, the wavelets analysis method is appropriate when considering non-stationary variability. Here we show by the use of wavelets analysis that it is possible to distinguish solar forcing of 1000- and 2500- year oscillations from oceanic forcing of 1500-year cycles. Using this method, the relative contribution of solar-related and ocean-related climate influences can be distinguished throughout the 10 000 yr Holocene intervals since the last ice age. These results reveal that the 1500-year climate cycles are linked with the oceanic circulation and not with variations in solar output as previously argued (Bond et al., 2001). In this light, previously studied marine sediment (Bianchi and McCave, 1999; Chapman and Shackleton, 2000; Giraudeau et al., 2000), ice core (O’Brien et al., 1995; Vonmoos et al., 2006) and dust records (Jackson et al., 2005) can be seen to contain the evidence of combined forcing mechanisms, whose relative influences varied during the course of the Holocene. Circum-Atlantic climate records cannot be explained exclusively by solar forcing, but require changes in ocean circulation, as suggested previously (Broecker et al., 2001; McManus et al., 1999).
milodonharlani says:
October 11, 2013 at 12:16 pm
Some of your colleagues once dared to disagree. Maybe not solar-driven cycles at that frequency, but perhaps oceanic, although admittedly this wavelet analysis study (citing many of the usual “climate science” suspects) is from way back in 2007
It is a good idea to keep up with the literature:
http://www.leif.org/EOS/Obrochta2012.pdf
Hint: I would not make my statement without having something to back it up with.
Prove your comment isn’t fatuous, Steve.
For the short term:
Shaviv, Nir 2008, Using the oceans as a calorimeter to quantify the solar radiative forcing, Journal of Geophysical Research, 113, A11101 http://www.sciencebits.com/files/articles/CalorimeterFinal.pdf
lsvalgaard says: October 11, 2013 at 11:15 am
Their Figure 4 is the actual data. The correlations are underwhelming,
Allan says:
The correlations are less than perfect, but are not too bad, imo.
If I recall correctly, you made the same comment about the less than perfect correlations (dCO2/dt vs temperature T and atmospheric CO2 LAGS temperature) in my 2008 icecap.us paper.
My 2008 hypo has stood up quite well, although it made warmists very uncomfortable, and was dismissed as a “feedback effect” until Salby revived the concept in circa 2011.
You were in good company re 2008 – Willis et al objected strongly to “Spurious Correlation and Data Smoothing” on ClimateAudit.org but it appears all of you were wrong. But none of this is bad – it is all a necessary part of the process.
The only part that amused me was when Pieter Tans published the same conclusion, all opposition suddenly vanished, and Tans did not even supply his data – just some graphs. So much for a level playing field.
But everyone can be wrong Leif, and nobody likes it when they are. I know. I was wrong once as a child, and vowed to never do it again. :-}
Leif again:
… but if we apply a bit of good will as in Figure 5, we can see a SST swing of 0.1C which is what we would expect from TSI alone [this is undisputed], so if this is your strongest evidence I will agree with you that the observed variation of TSI gives rise to the observed variation of SST [all of 0.1C]. But I would not call that a major driver of climate.
Allan says:
Is your above statement inconsistent with this quote from the Abstract?
We find that the total radiative forcing associated with solar cycles variations is about 5 to 7 times larger than just those associated with the TSI variations, thus implying the necessary existence of an amplification mechanism, though without pointing to which one.
Best, Allan
lsvalgaard says:
October 11, 2013 at 12:21 pm
I didn’t suppose that you lacked support for your position. Sorry if you took my comments in that way. I do try to keep up on the literature, but admit to not having read the 2012 paper.
The paper that I cited & your 2012 study aren’t necessarily contradictory, IMO. Both find or accept the 1000-2000 year solar signal which you granted might exist. Your citation doesn’t conclusively falsify the existence of the oceanic cycle observed in the 2007 paper. It shows that the 1500-year signal at one DSDP site might be spurious. IMO it’s premature to draw from this finding, perhaps debatable, the conclusion that Bond Cycles don’t exist at all. If they do, they’re likely to result from the combination of solar & oceanic effects, as appears to be the case with their stronger big brothers during glacial times, the well-established D-O cycles.
Allan MacRae says:
October 11, 2013 at 12:36 pm
The correlations are less than perfect, but are not too bad, imo.
If we accept them then they show that the SST variation is simply accounted for by TSI variations [of the expected 0.1C]
If I recall correctly, you made the same comment about the less than perfect correlations
A crummy correlation is still crummy, it could be real, but that one crummy correlation turned out to hold does not mean that other crummy correlations also hold.
Is your above statement inconsistent with this quote from the Abstract?
I would say that the abstract is at variance with my statement. The 0.1C is what I always expected and it seems that Shaviv has also found it.
milodonharlani says:
October 11, 2013 at 12:38 pm
If they do, they’re likely to result from the combination of solar & oceanic effects, as appears to be the case with their stronger big brothers during glacial times, the well-established D-O cycles.
The D-O cycles have a natural explanation as terrestrial effects. No need to invoke the Sun: http://www.leif.org/EOS/palo20005-D-O-Explanation.pdf
milodonharlani says: October 11, 2013 at 11:42 am
Those mariners would have to be very ancient indeed, since the ancient Greeks knew that the world is a globe. They could see the shadow of the Earth upon the Moon during eclipses.
Allan says:
Do you really think they were so advanced then during a lunar eclipse?
I understand that around the world they beat drums, threw sticks and shouted loudly to scare off the great animal that had eaten the moon.
Some also sacrificed a virgin, if they could find one.
in climatology …you don’t take the temperature of a system but a location…( and some even use the second principle of thermodynamics with that..)
to change the temperature of a location you don’t have to heat but move..
the temp signal has both circulation and heat signification.
So it may not be an amplification but a change in circulation pattern according with the sun.
And Hockey Schtick has an excellent point above on the measurable global brightness which must simultaneously be wrapped into any causes. Bound to me multi-pronged.
Dear Any Scientist Who Would Be Willing,
I realize that Dr. Svalgaard likely ignored my 12:11pm (today) post because it was, indeed, “mixed up.” There may be other non-scientists like I out there, nevertheless, who are left unsure whether or not my simple-minded post is actually correct.
If you would be so kind, PLEASE post a brief message for the sake of other non-scientists saying explicitly that my conclusions above were incorrect. Perhaps, people like myself should not even read threads like this, but we do. For the sake of preventing my nonsense from misleading a silent reader, please post a “Janice’s post at 12:11pm is largely incorrect”-type warning.
Thank you!
(and I’ll try to remember not to attempt that type of post in the future)
Janice
Every time I read a post about the sun-climate link I’m amazed of the time, effort and patience you have Leif with your answers. I really appreciate it, it brings a little balance in all the cheerleading comments. A big thank you!
Janice Moore says:
October 11, 2013 at 1:30 pm
I realize that Dr. Svalgaard likely ignored my 12:11pm (today) post because it was, indeed, “mixed up.”
didn’t look mixed up to me, so no need to rebut anything. If you were fishing for praise, here it is.
Janice Moore:
You or anyone else will never get higher praise on WUWT than that. Well done and congratulations.
Richard
Allan MacRae says:
October 11, 2013 at 12:55 pm
Depended upon where & when. Shamans in some illiterate cultures could predict eclipses. Aristotle used the shadow of the Earth to “prove” that it was at least round & presumably spherical.
Thank you for responding, Dr. Svalgaard, much appreciated.
Thank you, Richard. I was so ashamed to have appeared to have been fishing for praise that your kind affirmation was healing balm. Thanks for taking the time. J.
lsvalgaard says:
October 11, 2013 at 12:50 pm
Thanks. That’s a good hypothesis. I’ve corresponded with Dr. Clark regarding Heinrich Events.
However it remains to be shown what might cause variability of the AMOC, which could be comparable to the oceanic drivers of Bond Cycles referred to above.
Stan has found that the heat energy flowing into and out of the oceans over the solar cycle is 3.6 times what can be explained by the direct TSI. Than is, the solar effect is caused by the TSI forcing of 0.09 W/m2 PLUS an amplified effect of 0.24 W/m2, giving a total flux of 0.33 W/m2. There are two possibilities:
1. The heat flux is amplified by a temperature feedback
2. The heat flux is amplified by another solar-induced forcing
A feedback is a change caused by the initial temperature change that was initiated by TSI. A forcing is a change in something that was not caused by a change in temperature, but rather by some other solar effect, most likely a change in cloud cover. In either case, feedback or forcing, it was caused by the solar cycle.
Stan’s title implies he believes the amplification is due to solar forcing greater than the TSI, but his article does not explicitly eliminate the possibility that the amplification is due to a high positive feedback. However, forcing is distinguishable from feedback by the time lag. A forcing causes an immediate heat flux. A feedback causes a lagged heat flux because the temperature response is delayed due to the heat capacity of the oceans. Figure 2 in the article shows the heat flux into the oceans is in phase with the TSI, implying that all the heat flux is due to forcing. The temperatures response is delayed by 15 months. If a significant portion of the heat flux was due to positive feedback, the heat flux, responding to the temperature change, would also be delayed. Since the heat flux in not lagged, there is no positive feedback, and the amplified effect is due to solar-induced forcing.
A link to Dr. Roy Spencer’s post shows a graph :
http://www.drroyspencer.com/wp-content/uploads/TSI-est-of-climate-sensitivity2.gif
Here, Spencer assumes there is no solar forcing other than TSI, so he assumes the amplification is due entirely to feedback.
Spencer makes a best fit match of his model to the HadCRUT3 solar cycle temperatures and calculates a positive feedback, which corresponds to a climate sensitivity of 1.7 C/double CO2. But notice the lag does not match. The model peaks the toughs are 1 year after the peak and trough of the HadCRUT3 temperatures, which proved that the amplification is NOT due to a feedback; it is due to another solar-induced forcing.
If Spencer had instead increased the solar forcing in his model, replace “TSI” with “TSI X A”, where “A” is a positive solar forcing amplification factor, his model fit would improve. His model should be:
Cp[dT/dt] = TSI X A – lambda*T
This article suggests A = 3.6 for a no-feedback case, where the feedback parameter lambda equals the Planck feedback of 3.3 W/m2/C. This would give a climate sensitivity of 1.1 C.
“The truism that, but for the heart’s beating, there would be no music
does NOT lead to the conclusion that music is caused by the heart.”
Hmmm
So the Earth is blessed with sentience and able to make sweet music from the power supplied by the sun ?
In a non-sentient scenario there is no artistry. Just the cold logic of physics.
If those aspects of changes in solar output which vary far more than TSI have an effect on atmospheric chemistry then the global air circulation can change.
They do and it does.
lsvalgaard says:
October 11, 2013 at 12:50 pm
Allan MacRae says:
October 11, 2013 at 12:36 pm
The correlations are less than perfect, but are not too bad, imo.
If we accept them then they show that the SST variation is simply accounted for by TSI variations [of the expected 0.1C]
Per says:
October 11, 2013 at 1:34 pm
Every time I read a post about the sun-climate link I’m amazed of the time, effort and patience you have Leif with your answers. I really appreciate it, it brings a little balance in all the cheerleading comments. A big thank you!
————————————————————–
It is amazing to see Leif’s comment here in the comments on an article that demonstrates the contrary – and without a shred of evidence to back him except an incorrect calculation somewhere above.
Per, I think that you are mistaking mere bullheadedness for patience.
Ken Gregory says:
October 11, 2013 at 2:27 pm
Since the heat flux in not lagged, there is no positive feedback, and the amplified effect is due to solar-induced forcing.
Which still leaves the question where that extra energy is coming from.
bones says:
October 11, 2013 at 2:33 pm
It is amazing to see Leif’s comment here in the comments on an article that demonstrates the contrary – and without a shred of evidence to back him except an incorrect calculation somewhere above.
It just means that you have failed to explain to us mortals where that extra energy is coming from.
bones says:
October 11, 2013 at 2:33 pm
It is amazing to see Leif’s comment here in the comments on an article that demonstrates the contrary –
If the ocean were only 20 meter deep would its surface temperature be different? How different?
lsvalgaard says:
October 11, 2013 at 2:36 pm
bones says:
October 11, 2013 at 2:33 pm
It is amazing to see Leif’s comment here in the comments on an article that demonstrates the contrary – and without a shred of evidence to back him except an incorrect calculation somewhere above.
It just means that you have failed to explain to us mortals where that extra energy is coming from.
lsvalgaard says:
October 11, 2013 at 2:53 pm
If the ocean were only 20 meter deep would its surface temperature be different? How different?
——————————————–
The energy comes from the sun, it is only the process that modulates it that is at issue. And if the ocean were only 20 meter deep, it’s surface temperature would be very, very, very different without even considering TSI variations.
– – – – – – – – –
Allan MacRae,
Hume is saying do not have integrated ideas and concepts outside of senses, just present day perceptions of an a priori material world . . . yet is using ideas and concepts to try to sell his point.
That is a kind of intellectual trickery,it is an argument reducible to solipsism.
Also, you quote William James who said science is just what works in utilitarian social experiments, to forget ideals and concepts. In doing so he convinces us with ideals and concepts.
Are you supporting such post-Kantian gibberish?
John
lsvalgaard says:
“..so the energy content is a 7/50,000 = 0.00014 part of the troposphere. Not much.”
More with the lower surface temp’ and thinner troposphere at the poles, and stronger solar wind heating at the poles, but yes still not much if you look at it that way. But then it does not have to heat the whole mass of the troposphere.
bones says:
October 11, 2013 at 3:15 pm
The energy comes from the sun, it is only the process that modulates it that is at issue.
The energy is modulated by the sun’s magnetic activity [and that only at the 0.1% level]. What other modulation do you have in mind? And how large?
And if the ocean were only 20 meter deep, it’s surface temperature would be very, very, very different without even considering TSI variations.
How different?
Dr. S:
More from the annals of Cyclomania:
Forgive me if this 2009 study from your site has already been discussed on WUWT, but I’d be interested in your critique of it, which I assume would be generally negative. In the short version, it finds that 10Be records confirm 14C as a proxy for a solar influence on climate. I used to cite the isotopic record on RealClimate, but before this study came out:
http://www.leif.org/EOS/Holocene-TSI.pdf
Thanks.
lsvalgaard says:
October 11, 2013 at 3:33 pm
bones says:
October 11, 2013 at 3:15 pm
The energy comes from the sun, it is only the process that modulates it that is at issue.
The energy is modulated by the sun’s magnetic activity [and that only at the 0.1% level]. What other modulation do you have in mind? And how large?
And if the ocean were only 20 meter deep, it’s surface temperature would be very, very, very different without even considering TSI variations.
How different
———————————————-
Don’t ask me to say how different. I doubt that there is a human alive who can correctly answer that question, nor another to believe it. But only a fool would think that it wouldn’t matter if the oceans were shallow. If they were shallow, their circulation would be very different.
If I recall correctly, physicists discovered the neutrino by refusing to give up on the conservation of energy. I suggest that you do the same here.
milodonharlani says:
October 11, 2013 at 3:36 pm
Forgive me if this 2009 study from your site has already been discussed on WUWT, but I’d be interested in your critique of it
There are a couple of problems with it, the most glaring is that the cosmic ray modulation parameter is calculated using the Group sunspot Number which we now know is faulty. If you look carefully at Slide 20 of http://www.leif.org/research/Does%20The%20Sun%20Vary%20Enough.pdf you might see that many of the excursions of the cosmic ray proxies do not match the temperature record, e.g. the deep dip around 650 AD. The standard excuse is that the temperature record must be wrong. Another problem is that the reconstruction is already obsolete and a new version is in the works [at a workshop I’m running to resolve this].
bones says:
October 11, 2013 at 3:56 pm
But only a fool would think that it wouldn’t matter if the oceans were shallow.
Let me be that fool. The surface temperature is not much dependent on the deep ocean, I thought we agreed on that.
If I recall correctly, physicists discovered the neutrino by refusing to give up on the conservation of energy. I suggest that you do the same here.
Snide comments like this are uncalled for and are usually a sign of a weak argument.
Monckton of Brenchley says:
October 10, 2013 at 5:37 pm
…………………………….
Four separate groups – two amateur, two professional – have been in touch in recent months to say that the time-integral of the solar forcing is capable of explaining all or nearly all temperature change on all timescales at or above the 11-year solar cycle. So I’m not sure we can dismiss “Busie olde foole, unrulie Sonne” as the primum mobile of globakl temperature change.
____________________________________________________________________
Indeed me Laad:
http://woodfortrees.org/plot/hadcrut4gl/from:1850/mean:50/normalise/plot/sidc-ssn/from:1850/mean:50/offset:-40/integral/normalise
lsvalgaard says:
October 11, 2013 at 4:14 pm
Unfortunately the slide comes up sideways.
The advantages & disadvantages of different methods of counting sunspots have been discussed here. I’m sure your proposed changes are a good faith effort to improve understanding of solar behavior, but against the backdrop of corrupted climate science, I’m just as sure that you can understand why some skeptics might be suspicious of the effort.
It’s too bad that corrupt “climate science” has had such a corrosive effect on real scientists trying to do good work.
Thanks for the slide, which I’ll try to right with Powerpoint or by some other means.
Ulric Lyons says:
October 11, 2013 at 3:24 pm
But then it does not have to heat the whole mass of the troposphere.
It has energy to heat 5 feet of troposphere.
milodonharlani says:
October 11, 2013 at 4:24 pm
Unfortunately the slide comes up sideways.
Most browsers have a function to rotate pages…
milodonharlani says:
October 11, 2013 at 4:24 pm
I’m just as sure that you can understand why some skeptics might be suspicious of the effort.
These people are just lazy [and I dismiss such]. The process is simple, well-described, and can be understood and easily replicated by anybody with public data.
FrankK says:
October 11, 2013 at 4:20 pm
Monckton of Brenchley says:
October 10, 2013 at 5:37 pm
Yet with Donne, we may ask, “Busie old foole, unruly Sunne, Why dost thou thus?”. Or maybe, whether thou dost thus.
lsvalgaard says:
October 11, 2013 at 4:29 pm
True, but might they not well ask, what was wrong with previous methods of counting? Even if you also make the reasons for the change clear.
lsvalgaard says:
October 11, 2013 at 4:26 pm
I have problems with pdf files. Or maybe just problems, period.
milodonharlani says:
October 11, 2013 at 4:31 pm
True, but might they not well ask, what was wrong with previous methods of counting? Even if you also make the reasons for the change clear.
We start by explaining what was wrong. But lazy people will whine no matter what.
milodonharlani says:
October 11, 2013 at 4:32 pm
I have problems with pdf files. Or maybe just problems, period.
tilt your head 90 degrees…
lsvalgaard says:
October 11, 2013 at 4:41 pm
I tried tilting. No worries. Problem solved. Pretty persuasive graphics.
Thanks!
beng says:
October 11, 2013 at 9:20 am
Climate is not governed significantly by chemical reactions — it’s a sun-powered, atmospheric-driven heat-engine.
==============
the algae that control the climate of planet earth, and have done so for a couple of billion years, say otherwise. they maintain the temperature of the earth to suit themselves, and the rest of us go along for the ride.
A question for Dr. Svalgaard and anyone else that would like to provide an estimate. This is not intended as a joke question. It is a question I’ve struggled with for some time. I believe the answer will help provide perspective to our discussion.
For P = K + U
where
P = Perfect knowledge of the Sun (god view, present, past and future)
K = what is known about the Sun
and U = what is unknown about the Sun
given that the lifetime of the Sun if finite, and bounded according to GR by the speed of light and the age of the universe, it can be argued that:
0 < P 0
U > 0
therefore
0 < K/P < 1 and
0 < U/P < 1 and
U/P + K/P = 1
Question, what are the approximate values of
K/P = ?
U/P = ?
John Whitman says: October 11, 2013 at 3:21 pm
Are you supporting such post-Kantian gibberish?
Allan says:
Yes John, without a doubt.
And I really do believe that the Earth sits on the back of an infinitude of tortoises, all the way down.
At least it’s no worse than the CAGW hypo. 🙂
{Do I really have to day sarc off?}
arghh. HTML
it can be argued that:
0 < P < infinity
0 < K < P
0 < U < P
therefore
0 < K/P < 1 and
0 < U/P < 1 and
U/P + K/P = 1
Question, what are the approximate values of
K/P = ?
U/P = ?
lsvalgaard says:
October 11, 2013 at 2:33 pm
Which still leaves the question where that extra energy is coming from.
=============
Extra energy? In daytime, if you stand in the shade under a tree you are cooler than when you stand in the open, yet there is no extra energy from the sun. TSI remains constant.
If you change the chemistry of the atmosphere and as a result reduce the rate of cloud formation, during daytime you will warm the surface that would have otherwise been shaded by the clouds.
Ken Gregory says:
October 11, 2013 at 2:27 pm
There are two possibilities:
1. The heat flux is amplified by a temperature feedback
2. The heat flux is amplified by another solar-induced forcing
===========
3. The activation energy is reduced/increased by the increase/decrease of a catalyst transported from the sun to the earth’s atmosphere.
For example, a change in the volume of ionized particles transported by the solar wind, which changes the clumping rate of aerosols, which changes the nucleation rate of clouds, which changes the weather, which changes the climate.
ferd berple says:
October 11, 2013 at 6:06 pm
For example, a change in the volume of ionized particles transported by the solar wind, which changes the clumping rate of aerosols, which changes the nucleation rate of clouds, which changes the weather, which changes the climate.
The volume is constant [namely the heliosphere], The density may change, however the solar wind particles do not penetrate to the altitude where aerosols are formed.
ferd berple says:
October 11, 2013 at 5:42 pm
Question, what are the approximate values of
K/P = ?
U/P = ?
since you have not defined what knowledge is, your question is ill-posed. Knowledge exists within a paradigm http://en.wikipedia.org/wiki/Paradigm and so the answer depends on the paradigm adopted as a basis for the discussion. Within the ‘current’ paradigm we know very much about the Sun: how big it is, how its interior is constituted, how its energy is generated, how it rotates in the interior, how hot it is and where, etc. What we do not know [but are in the process of finding out] is how matter moves inside the sun. We know that solar activity is generated by a dynamo, we do not know where precisely the dynamo is located or if there is a primordial magnetic field deep in the core. We know there is a solar wind and what its properties are, we argue about precisely how it [and the corona] is heated. So within the paradigm I would estimate K/P to be about 0.5. What is unknown about the Sun mostly lies outside the paradigm and can therefore not be meaningfully discussed.
I don’t much understand the part with thermal diffusivity experimentation.
Thermal diffusivity of salt water is something around 0.14, but not cm^2/s but mm^2/s (0.0014 cm^2/s), descends with temperature and salinity and is quite firmly given by thermal conductivity, density and heat capacity of the material. Maybe there are some other units? Can somebody explain?
lsvalgaard says:
October 11, 2013 at 4:14 pm
bones says:
October 11, 2013 at 3:56 pm
But only a fool would think that it wouldn’t matter if the oceans were shallow.
Let me be that fool. The surface temperature is not much dependent on the deep ocean, I thought we agreed on that.
——————————————-
Are you talking about present, near equilibrium temperature, or the variations of temperature over a solar cycle? In the case of the former, the equilibrium should be radically different.
If, in the case of the latter, you are wondering what TSI variations entering the ocean can produce, then 0.09 watt/m^2 could produce a surface temperature variation of amplitude of about 0.028 C. So TSI variations entering the ocean surface still can’t do the job.
tumetuestumefaisdubien1 says:
October 11, 2013 at 7:37 pm
I don’t much understand the part with thermal diffusivity experimentation.
Thermal diffusivity of salt water is something around 0.14, but not cm^2/s but mm^2/s (0.0014 cm^2/s), descends with temperature and salinity and is quite firmly given by thermal conductivity, density and heat capacity of the material. Maybe there are some other units? Can somebody explain?
——————————————————–
The thermal diffusivity you mentioned would apply to a few cm of water in a beaker, but not to the oceans. The thermal diffusivity used to describe ocean temperature profiles is a turbulent mixing average diffusivity that accounts for wave mixing, tides, shears, salinity driven motions, etc. You have to do some reading on mixing length theories and averaging to sort it all out. It is an approximation, but one that was adequate for my purposes.
Something for Leif to ponder: http://www.atmos-chem-phys.net/11/1177/2011/
Guys, didn’t anybody read the key conclusion in Dr. Robertson’s paper????
“In summary, my calculations based on energy conservation considerations imply that the sun modulates the ocean temperatures to a much greater extent than can be provided solely by its TSI variations. The great question that desperately needs an answer is how does it do it?”
All the arguing about TSI variations and .34 w/m^2 vs .09 w/m^2 aren’t to the point. The point is that the major indices of changing climate, sea surface temp, heat input, and sea level all follow the solar cycle quite closely. Explain WHY? We know it isn’t CO2. We know it ISN’T changes in direct TSI. An envelope calculation shows that .09 w/m^2 is enough to change the atmospheric humidity substantially enough, depending on where the energy hits the surface, to change the amount of cloud cover.
Another few quibbles,
A 2% change in cloud cover does explain certain temperature differences. The physics of cloud formation simply aren’t known well enough to explain cyclical changes in cloud cover, and hence changes in heat flow to the surface.
Deep ocean- according to the oceanographers the deep ocean temperature has nothing to do with upper level convection and mixing. It is controlled by the surface temperatures mainly off the coast of Antarctica, but to an extent in the northern Pacific and Atlantic. Ice formation generates cold, dense sea water by forcing the salts out during freezing. The dense, salty water sinks to the bottom. As long as there is ice near the poles the deep ocean will be very cold and poorly mixed.
bones says:
October 11, 2013 at 7:49 pm
If, in the case of the latter, you are wondering what TSI variations entering the ocean can produce, then 0.09 watt/m^2 could produce a surface temperature variation of amplitude of about 0.028 C.
I don’t think so, more like 0.005 C.
Hi Ferd. Well, if K/P is about 0.5 as Leif roughly estimated then U/P is also about 0.5. They are both one minus the other fraction since P/P is one and U + K = 1. You kind of left out the K <= P inequality but it is logically implied. The unit of ‘knowledge’ is rather irrelevant. Maybe use the unit symbol ‘?’ 😉
You sure that was not a trick question and I just fell for it?
bones says:
October 11, 2013 at 8:57 pm
Something for Leif to ponder: http://www.atmos-chem-phys.net/11/1177/2011/
Although the statistics is marginal, taken at face value the authors conclude that “the inferred solar cycle dependence in the 400–600 nm visible band is too large to be of extraterrestrial origin”. Taken to its logical conclusion one could [and you could too] dispense with the solar cycle variation of TSI altogether and your question becomes: “can 0.00 watt/m2 amplitude of variation of TSI entering the oceans produce temperature oscillations with an amplitude of 0.04 – 0.05 oC?”.
Re: Ferd Berple at 5:51pm – “If you change the chemistry of the atmosphere and as a result reduce the rate of cloud formation… .” (emphasis mine)
It could as easily simultaneously increase cloud formation elsewhere. Result: no significant change in global temperature.
I Love Leif.
Leif, why do you keep harping on the stupid energy arguments? I am sure you realise that what heats the ocean is not the TOA energy flux but the flux at the Earth surface, which is influenced by the variable albedo, as many commenters have pointed out. Also, it does not – as you claim – take a lot of energy to make clouds. It takes energy to evaporate water but precipitation actually releases energy. It is in principle possible that for example the cosmic ray flux carrying very little energy can be a catalyst for precipitation.
I also think you are biased in your claims of debunking of papers by criticism. Take your reference http://www.leif.org/EOS/swsc120049-Cosmic-Rays-Climate.pdf to the paper by Laken et al. Like other commenters above I am unimpressed by the arguments in that paper. Take as an example Fig. 6, purporting to show a serious error in Svensmarks evaluation of errors in his paper on cloud changes following Forbush events. A straightforward comparison with Fig. 1 in that paper shows that the criticism is unfounded. The 2sigma standard errors are very similar in the two figures and the line referred to Svensmark in Fig. 6 is wrong.
Trees know when to change from the seasons. The climate of the Earth changes from Sun seasoning.
jens says: October 11, 2013 at 11:47 pm
Leif, why do you keep harping on the stupid energy arguments?
Allan says:
jens, please consider using words such as “inappropriate” instead of the word “stupid”.
I’ve had interesting discussions with Leif for a long time and am quite certain that he is not stupid. Some adjectives do come to mind, but “stupid” is not one of them.
I would also appreciate it if others would not act in this way – if you are upset by this discussion, please find some other way to vent your frustration.
I suggest that kicking a car door works surprisingly well – but definitely kick someone else’s car, not your own, which would only increase your rancor.
I do think there are objective methods of solving this thorny question, but so far this is the best I’ve come up with:
http://wattsupwiththat.com/2012/09/16/onset-of-the-next-glaciation/#comment-1090817
Allan MacRae says: September 26, 2012 at 3:32 am
So are you saying that the global cooling observed during the Maunder Minimum (circa 1645 to 1715) had nothing to do with reduced solar activity?
Leif Svalgaard says: September 26, 2012 at 5:09 am
Essentially, yes. As the Sun does not vary enough.
Dr Norman Page says: September 26, 2012 at 7:32 am
The Maunder minimum is almost certainly the result of reduced solar activity – specifically reduced solar magnetic field strength which leads to an increase in incoming GCRs and the resulting increase in cloudiness and albedo.
Allan says:
OK…… Glad we cleared that up.
Could possibly resolve this question through a scintillating game of rock, paper, scissors?
🙂
lsvalgaard says:
“It [the thermosphere] has energy to heat 5 feet of troposphere.”
From zero K. With a ~3km winter polar troposphere, and ~240K polar temperature, we are at say a 1/1200 relative energy content rather than your 1/100,000 estimate. And that is with a maximum 2000°C estimate for thermosphere temperature, but is the heating stronger than that in the polar regions?
lsvalgaard:
“Explain how any or all of these can supply 3.6 times MORE energy than the variation of the TOTAL energy received from the sun.”
==================================================
Perhaps part of the answer is time, as in energy residence time. A solar cycle may average 11 years. What is the residence time of that change in TSI which reaches the ocean at various depths. Is some of that energy still there for the next six solar cycles? If those six cycles are all stronger then the previous six cycles, does each cycle add accumulatively to the total increase over 66 years? Is there an 800 year cycle in the oceans heat flows which correlates to CO2 and T?
So we have the thermal inertia of the oceans to consider, with various residence times of energy within the oceans, much of which is not known, as far as I know. And of course we have surface changes in energy received, due to albedo changes, and or changes in disparate albedo locations, (IE jet stream latitude changes) We have dozens of cycles, each cycle being of different length. Atmospheric cycles, ocean cycles, tidal cycles, solar cycles, etc, etc. Over time, simply by chance, some of the positive forcing of numerous changes in energy residence time and total input, will line up in a particular forcing direction, either cooling or warming. When these many disparate factor go in phase, we have major changes in climate.
Due to the many factors, sometime in phase, sometimes opposed and canceling, one would not expect a consistent strong correlation from any one factor.
As an illustration of the above general questions and assertions, a question for anyone. Is the earth gaining or losing energy in the S.H. summer?
Lots of comments, if mentioned before my apologies. Waters warmed by the sun do not stay in one place. The Gulf Stream as it approaches the UK is not warmed by solar energy at that latitude, it was warmed much closer to the tropics. The annual range of SST in the Gulf of Mexico is normally between 55F and 90F (give or take a few degrees). This is solely dependent upon the orbital changes the Earth goes through each year. So, how can we really understand the small temperature changes supposedly caused by solar effects when you have vast ocean circulation and large annual temperature ranges that all happen at different times and places around the Earth and that are caused by things other than the Sun. Just wondering.
Tom in Florida says: October 12, 2013 at 5:27 am
………….
Tom
Agree, absolutely. See my comment above
http://wattsupwiththat.com/2013/10/10/the-sun-does-it-now-go-figure-out-how/#comment-1444342
Forget about the tiny TSI variability. Ocean currents are far from ‘static’ (excuse the pun) as the climate models assume.
Tom in Florida says:
“..vast ocean circulation and large annual temperature ranges that all happen at different times and places around the Earth and that are caused by things other than the Sun.”
Unless of course solar plasma variability effects pressure systems and the jet stream latitude and equatorial winds, then it would be forcing the AMO and ENSO.
lsvalgaard says:
Leif,
Looking for the source of the missing heat, I did a little math regarding the annual energy consumption of the world from various estimates found online and using consumption as production came up with roughly one millionth (1/1,000,000) of the Wh that the sun bequeaths upon the earth each year. Sound like a reasonable number? Not much heat added there.
What about the 70% of the planet covered by water and all of the potential thermal vents we don’t know about? Any estimates available regarding the potential ocean warming from these?
@ Allan Mcrae; An argument can be stupid without the person making it being so. It depends on the motivation, upon which one can only speculate. For example, saying that the “sun doesn’t vary enough” to cause climate change is just stupid. One can only say that we don’t really know what causes climate change, but there are many, often-conflicting variables, including the sun, and they depend on whether you are talking short-term or long-term.
… is the energy source from beneath our feet? Why is there such a good correlation between the recent increase in global temperature and the rate of movement of the magnetic north pole?
I completely get the energy mantra Leif is postulating.
The equatorial band is an important place on Earth in terms of variations in SWIR heating. The Sun beams away at the TOA at a steady rate and then must find its way through the changing atmosphere to the surface. In particular, the equatorial atmospheric band is highly variable but also somewhat predictable and could be the source of energy variation needed to produce heating trends.
Why an equatorial band in my thinking? As the angle increases in terms of irradiance at the ocean surface, shortwave infrared is less able to penetrate and is instead reflected away. Therefore irradiance location is an important metric in determining oceanic heating. The width of the “meaningful” equatorial band is of interest to me.
And why a focus on just equatorial clouds? Equatorial cloud formation and variations allow in or reflect away various amounts of SWIR in the place on the globe that matters the most in terms of oceanic heating. Variation in cloud formation within this equatorial band is an important metric in determining in situ oceanic heating in the short term as well as heat available elsewhere as oceanic currents take those waters away from the equatorial band in the long term.
I have said it before. We may not need to know cloud formation and SST everywhere on the globe. My hunch is that extratropical variations in clouds and SST are far more chaotic and unpredictable and could be what we call weather. But the equatorial band may be the “sweet spot” place to study regarding important long term climate trend information. Just how wide the band needs to be before hitting diminishing returns fascinates me.
lsvalgaard, “Taken to its logical conclusion one could [and you could too] dispense with the solar cycle variation of TSI altogether and your question becomes: “can 0.00 watt/m2 amplitude of variation of TSI entering the oceans produce temperature oscillations with an amplitude of 0.04 – 0.05 oC?”.”
Right, TSI variation as determined doesn’t have the energy to produce climate change of any significance as determine. So any correlation of climate with solar has to be either due to “other” solar amplifying effects or human error in making all the assumptions leading to the determinations 🙂
Leif,
Found one:
“The energy available is simply immense, far beyond anything ever before harnessed by mankind. National Geographic estimates the energy escaping from just the known vents to be 17,000,000 MW, an amount that approximates all human consumption on the planet, and there are tens of thousands of kilometers of ridge system that have never even been explored.”
Found an “estimate”. Now we are up to two one millionths. But that does not include all the ones we don’t know about.
Cooler says: “CO2 has nothing to do with warming atmosphere, in contrary it is a good cooler …”
And that statement is perfectly consistent with a systems view of temperature and CO2 in the ice core record. Increasing temperature drives up CO2 levels which then become large enough to first stop the temperature from increasing further and then they persist to cause temperature to decline again ultimately bringing CO2 back down again. The alarmists who perpetually claim that somehow “CO2 later takes over” from ~whatever~ initiated temperature rise cannot explain what enormous decrease in forcing could have caused temperature to start coming back down with so much more CO2 in the air given their religion of “CO2 drives temperature”.
Jim G says:
October 12, 2013 at 7:31 am
What about the 70% of the planet covered by water and all of the potential thermal vents we don’t know about? Any estimates available regarding the potential ocean warming from these?
Some number i have seen puts it at 0.05 W/m2, thus not much [however comparable to Stan’s 0.09 W/m2 🙂 ]
Allan, I did not say that Leif was stupid. Indeed, he appears to be quite bright and certainly knowledgeable. So much more surprising is it that he keeps insisting on these “inappropriate” arguments. I consider this stupid when the “inappropriateness” has been explained i detail in many comments.
jens:
Your post at October 12, 2013 at 7:54 am says in total
But his comments are very appropriate.
I refer you to my comment in this thread at October 10, 2013 at 4:48 pm. This link jumps to it
http://wattsupwiththat.com/2013/10/10/the-sun-does-it-now-go-figure-out-how/#comment-1443729
Richard
PS In that post I said “an order of magnitude” when I should have said “a factor of three” but that does not affect the point being made.
jens says:
October 12, 2013 at 7:54 am
he keeps insisting on these “inappropriate” arguments.
All I’m doing is seeking clarification and guidance. If I have misunderstood [or not understood] something I ask for explanation. Being meet with ‘stupid’ or ‘inappropriate’ is not helpful. When people seek explanation from me I go out of my way to do my utmost to provide some that are on a level that can be understood by the questioner. I ask questions that push the discussions to get to the mushy parts of it. And so far in this thread I have not gotten what I need. If you know better, you can be helpful by enlighten me.
Mike M says:October 12, 2013 at 7:50 am
Cooler says: “CO2 has nothing to do with warming atmosphere, in contrary it is a good cooler …”
And that statement is perfectly consistent with a systems view of temperature and CO2 in the ice core record. Increasing temperature drives up CO2 levels which then become large enough to first stop the temperature from increasing further and then they persist to cause temperature to decline again ultimately bringing CO2 back down again.
Thanks for bringing that up. My first take on looking at the ice core vs. temp reconstructions was ‘how could anyone believe CO2 causes unlimited heating, when every time CO2 gets high, we have another ice age’. It just never computed.
bones says:
October 11, 2013 at 7:59 pm
“The thermal diffusivity you mentioned would apply to a few cm of water in a beaker, but not to the oceans. The thermal diffusivity used to describe ocean temperature profiles is a turbulent mixing average diffusivity that accounts for wave mixing, tides, shears, salinity driven motions, etc. You have to do some reading on mixing length theories and averaging to sort it all out. It is an approximation, but one that was adequate for my purposes.
So there is one “beaker thermal diffusivity” which applies to water in beaker and another “ocean thermal diffusivity” instead applies to oceans, has values impossible for any real material, not speaking water -for the case of the beaker thermal diffusivity and if I understand it well, it is some approximation, which is adequate for falsification purposes of the hypothesis the rising TSI can heat ocean as observed, but instead of sound explaining at least principle I´m referred to to read extensively.
And although I don’t completely understand the way how you came to your conclusions it somehow makes blinking the credibility warning light in my head and again reminds me about certain Trenberth, you also mention, seriously talking about water having allegedly ε=0.9907 according to somebody in his flagship paper, then using ε=1 there anyway for whole surface getting his straighforwardly absolutely impossible 396,4W/m^2 figure for 289,15 K water temperature – itself highly suspicious value, but others are called ignorant when pointing out the obvious and referred to reading.
Just couple of notes which come to my mind:
– 390W/m^2 thermal radiation for 288K water is unrealistic, based on inadmissible assumption of ε=1 which no real material can achieve – even laboratory blackbody barely has ε=0.99 (value, which would already make 286 from the 390 figure in the real world) – and that is moreover for 0° emission angle. For the similar reason the outgoing additional 0.22 W/m^2 value looks to me like rather overestimation for 0.04C temperature change as looks to me being overestimation the 5.42 watt/m2 for each 1C increase of surface temperature – not so much gross as beyond realm of possible.
– 90% of ocean is at latitudes up to 61°, where the average insolation is well over the 160W/m^2. I can add that 70% of ocean is at latitudes up to 42°, and half is up to 29th parallel, implying considerably higher ocean insolation than global average.
– Reflectivity of water at 67° incidence angle is way lower than 6.7% – so the Trenberth´s 23W/m^2 of average surface reflection, even if true, doesn’t apply for ocean between polar circles (94%), which again calls also into question the 160 W/m^2 value itself, at very least when talking about ocean. And here again for similar reasons the 0.07W/m^2 amplitude derived for given spectrum looks to me like underestimation – and even the 1365 figure looks to me overblown several Watts per square meter, when I look into the SORCE-TIM TSI data.
– Although it definitely looks like the solar cycle signal is well prominent in the SST data, the variability of the ocean SST during solar cycle doesn’t seem to me being a sound base for conclusions as it seems to me being impossible to well quantify the temperature amplitude from data which seem to have uncertainty in order comparable to the 0.05C, as looks to me highly dubious the quantification of solar signal amplitude reaching the ocean. Not speaking that in frame of one solar cycle the solar variability largely cancels itself out, especially by the typically longer in time right tails of the signal (let alone its signal is quite different from sinusoid) allowing usually considerably more time for surplus heat dissipation than was there for its creation from the solar radiation during the rising activity period.
For at least this reasons which instaantly come to my mind (even ignorant about the ocean thermal diffusivity and some other stuff you name – and it is not explained in the article, nor discussion below) I doubt the analysis outcome and especially its quantification in the factor 3.6 figure.
Jim G says:
October 12, 2013 at 7:31 am
Undersea volcanism varies over time, of course. Air temperature in the Cretaceous, for instance, was warm, but not enough to heat the oceans to the degree observed in proxy data. Sea level was so high then not just because of lack of ice, but due to thermal expansion of the oceans, thanks to submarine volcanism-driven active seafloor spreading as the continents raced away from each other. They’re still doing that, of course, but not to the same extent as especially in the mid-Cretaceous.
If solar activity goes to the average solar parameters I have mentoined cooling will be the result.
avg solar parameters needed
solar flux sub 90
solar wind sub 350 km/sec
cosmic ray count per min. avg north of 6500
solar irradiance off .015%
euv light avg. sub 100
imf field avg 4.0 nt
ap index avg. sub 5.0
If solar activity stays as it has been for the last year or so expect neutral or no temperature change.
Which has been the case.
jens, bruce et al,
To be clear, I am asking for more courtesy in this dialogue.
And I too have been intemperate at times and have occasionally chosen “inappropriate” words. Mea culpa*3. Sincere apologies to Leif.
The popular debate in climate science suggests that this science is in its infancy. I further suggest that the majority of climate science has taken a giant step backwards in recent decades due to egregious political interference and scientific misbehaviour.
Notwithstanding all the wonderful data available especially since ~1979, we have an “ECS mainstream debate” that ASSUMES THAT CO2 SIGNIFICANTLY DRIVES TEMPERATURE and centres on the question of “climate sensitivity to atmospheric CO2” (“ECS”) that questions whether ECS is greater or less than 1 (that is, are there positive or negative feedbacks to increasing atmospheric CO2).
Since CO2 clearly LAGS temperature at all measured time scales, this ECS mainstream debate requires that, in total, “the future is causing the past”, which I suggest is demonstrably false.
To be clear, I suggest that atmospheric CO2 does NOT significantly drive Earth temperatures, and Earth temperatures clearly drive atmospheric CO2.
This does not preclude the possibility that the observed increase in atmospheric CO2 is primarily caused by some factor (natural and/or humanmade) other than temperatures, but such increase in CO2 is insignificant to Earths’ temperatures.
In summary, in climate science we do not even agree on what drives what, and it is probable that the majority, who reside on BOTH sides of the ECS mainstream debate, are BOTH WRONG.
It is also possible that I am wrong on this point ( possible, but not probable :-} ).
Next there is the subject of this thread – does the variability of the Sun significantly drive Earth’s climate?
Again, people of more-than-average intelligence sit on opposite sides of this question.
In their frustration to make their point, they call the argument of the other side “stupid”. I suggest that this sort of comment does little to bolster the credibility of the commenter’s argument.
So perhaps a little courtesy and forbearance is appropriate while we sort all this out.
***
Pamela Gray says:
October 12, 2013 at 7:38 am
***
I think you’re on the right track. Look at this pdf on D-O events Dr S provided. I think you’ll find it interesting:
http://www.leif.org/EOS/palo20005-D-O-Explanation.pdf
The most obvious question for an ignorant, non-physicist to ask is this:
Are there any wavelengths within the TSI which alter radically depending on the strength of the solar cycle??
After all, if you posit that solar effects can impact on ocean warming and that the amplitude of the sunspot cycle determines how much effect there is, then presumably the key is finding some specific solar irradiation which reaches earth in a manner which is somewhat proportional to the ‘strength’ of the solar cycle.
The 10.7cm radio flux is clearly one, but presumably there might be others also??
The next question is ‘what particular wavelengths does seawater absorb effectively? Are any of these radically altered during different solar cycle strengths?’
The third question is: ‘can algae, plankton species etc affect ocean temperature through harvesting sunlight and transmitting heat to the ocean in a manner which is proportional to the strength of the solar cycle?’
I”m sure there are others and it may well be that others have already asked these questions and answered them………
Salvatore Del Prete says:
October 12, 2013 at 9:45 am
I detected good idea from what you write – that the last decade and bit of nonwarming can serve as example for limited equilibrium state and if further “slump” in solar activity occurs (which is quite likely as the cycle will reach its end), then cooling will occur. Do I interpret it well?
Yes, that is what I suggest. There must be or I should say there are threshold values of change in solar activity that will impact the climate. The question is what are all those values and what kind of a duration do they require?
To make my point if the sun suddenly went dead we would all agree the earth would be frozen, therefore showing the sun does effect the climate at some point of change.
Now the question is how little of a change is needed in all the solar parameters to change the climate of the earth through primary solar changes and the secondary effects associated with those primary solar changes?
I suggest it is the solar average parameters I have listed which I think are similar to previous prolonged solar minimum periods which have impacted the climate in the past, if one looks at past history.
[snip – don’t accuse Dr. Svalgaard of impropriety without basis – take a 48 hour time out from WUWT – Anthony]
wayne says:
October 11, 2013 at 10:06 pm
You sure that was not a trick question and I just fell for it?
========
No, it wasn’t intended as a trick and thank you to Leif for taking the time to answer, as it has given me insight into the problem.
Consider this paradigm:
P = Perfect knowledge of the Sun (god view, present, past and future)
This might be considered the ultimate goal of science. To fully know the past history of the sun, the internal processes, how it affects the earth, and to be able to predict this going forward without error.
Our current paradigm (C) is less complete. We know something about the subjects above, and some of what we know is correct, but if the history of science tells us anything, it is that some of what we believe to be correct is incorrect.
It is this incorrect knowledge that I left out of my original question, and I realize now that it is perhaps the most important part. The reason being is that incorrect knowledge acts in a fashion like negative or “anti-knowledge”. New ideas that conflict with the false beliefs are held back, because they contradicts what we believe to be true.
Lets incorporate correct (True) and incorrect (False) knowledge. We now have:
P = perfect paradigm
K = known in perfect paradigm (true knowledge)
U = unknown in perfect paradigm (true unknowns)
C = current paradigm
K(C) = known in current paradigm
U(C) = unknown in current paradigm
F(C) = known in current paradigm but false in perfect paradigm (false knowledge)
T(C) = known in current paradigm and true in perfect paradigm (true knowledge)
where K(C) = F(C) + T(C)
From this we can say
K = K(C) – F(C) (true knowledge = current knowledge – false knowledge)
U = U(C) + F(C) (true unknowns = current unknowns + false knowledge)
History shows us that F(C) > 0, therefore it can be said that:
U > U(C) = 0.5 (from Leif)
that the true unknowns are greater than what we believe.
Rhys Jaggar says:
October 12, 2013 at 10:27 am
Are there any wavelengths within the TSI which alter radically depending on the strength of the solar cycle?? … The 10.7cm radio flux is clearly one, but presumably there might be others also??
10.7, UV, and cosmic rays vary linearly with the solar cycle
Allan MacRae says:
October 12, 2013 at 10:23 am
This does not preclude the possibility that the observed increase in atmospheric CO2 is primarily caused by some factor (natural and/or humanmade) other than temperatures, but such increase in CO2 is insignificant to Earths’ temperatures. In summary, in climate science we do not even agree on what drives what…
I would think that the estimations of the anthropogenic emissions clearly exceed the rate of rise of its content in the atmosphere.
Where the surplus CO2 in atmosphere is coming from is in my opinion clear – it is anthropogenic – for example in 2008 from the global emissions estimations were that there was 40% more anthropogenic emissions than the atmospheric level rise would suggest, in 2010 46%. So the rest must sink, not be released from nature by unknown drivers. But the sinks are unable to adapt so quickly. The sinks evidently start to saturate and while in 1989-1992 the seasonal “sink” was 6.3ppm, in 2009-2012 already only 5.6ppm, while real sink in 2010 was 2.1ppm, the anthropogenic surplus was 4.5ppm. From the numbers is clear that nature is unable to keep up with the emissions development.
But it all of course doesn’t say anything about dominant cause of the recent warming. Also we should pose ourselves question how long into the future the emissions rate can last with the known fossil carbon reserves. I would think not more than another 25years. It will still not be by far enough for sink saturation and I even seriously doubt the infamous “doubling” from the preindustrial levels is ever achievable -at least not with the known fossil reserves. So to me the “problem” with the anthropogenic CO2 emissions looks like non-issue – even the rising level of atmospheric CO2 is clearly overwhelmingly if not only caused by it. The CO2 is unable to poison the nature – in fact the opposite is true and green flora thrives on it, so whenever the fossil reserves are depleted, the surplus CO2 atmospheric content will simply sink again, maybe even with accelerated rate given by previous fertilization, and that’s it. I think much more actual problem is how this technological civilization will survive the fossil carbon resources depletion.
Salvatore Del Prete says: October 12, 2013 at 9:45 am
tumetuestumefaisdubien1 says: October 12, 2013 at 10:38 am
I detected good idea from what you write – that the last decade and bit of non-warming can serve as example for limited equilibrium state and if further “slump” in solar activity occurs (which is quite likely as the cycle will reach its end), then cooling will occur. Do I interpret it well?
Salvatore Del Prete says: October 12, 2013 at 10:48 am
Yes, that is what I suggest…
Allan says:
One faction (to which I belong) says that global cooling will soon resume, or has already commenced.
I (we) predicted imminent global cooling in an article written in 2002.
So I agree with Salvatore above.
What will happen then?
Will global cooling be mild or severe?
I suggest cooling could be similar to the Dalton Minimum, which coincided with an average 1 degree C decline in global average temperature and caused significant human suffering.
But the Dalton also included the Tambora eruption in 1816, one of the largest volcanoes in the past 2000 years. The year 1816 was called The Year Without a Summer.
Just in case, bundle up!
Regards, Allan
From wiki:
Year Without a Summer
This article is about the year 1816..
The Year Without a Summer (also known as the Poverty Year, The Summer that Never Was, Year There Was No Summer, and Eighteen Hundred and Froze to Death[1]) was 1816, in which severe summer climate abnormalities caused average global temperatures to decrease by 0.4–0.7 °C (0.7–1.3 °F),[2] resulting in major food shortages across the Northern Hemisphere.[3][4] It is believed[by whom?] that the anomaly was caused by a combination of a historic low in solar activity with a volcanic winter event, the latter caused by a succession of major volcanic eruptions capped by the 1815 eruption of Mount Tambora, in the Dutch East Indies (Indonesia), the largest known eruption in over 1,300 years. The Little Ice Age, then in its concluding decades, may also have been a factor.[attribution needed]
The Year Without a Summer was an agricultural disaster. Historian John D. Post has called this “the last great subsistence crisis in the Western world”.[5] The unusual climatic aberrations of 1816 had the greatest effect on the northeastern United States, Atlantic Canada, and parts of western Europe. Typically, the late spring and summer of the northeastern U.S. and southeastern Canada are relatively stable: temperatures (average of both day and night) average between about 68 °F (20 °C) and 77 °F (25 °C) and rarely fall below 41 °F (5 °C). Summer snow is an extreme rarity.
In the spring and summer of 1816, a persistent “dry fog” was observed in the northeastern US. The fog reddened and dimmed the sunlight, such that sunspots were visible to the naked eye. Neither wind nor rainfall dispersed the “fog”. It has been characterized as a stratospheric sulfate aerosol veil.[6]
At higher elevations, where farming was touch and go in good years, the cooler climate did not quite support agriculture. In May 1816,[1] frost killed off most crops, on June 4 frosts were reported in Connecticut, and by the following day most of New England was gripped by the cold front.[7] On June 6, snow fell in Albany, New York, and Dennysville, Maine.[8]
Many commented on the phenomenon. Sarah Snell Bryant, of Cummington, Massachusetts, wrote in her diary, “Weather backward.” Samuel Griswold Goodrich said the summer of 1816 in Connecticut was the coldest of the century.[9]
At the New Lebanon, New York Church Family of Shakers, Nicholas Bennet wrote in May 1816 that “all was froze” and the hills were “barren like winter.” Temperatures went below freezing almost every day in May. The ground froze solid on June 9. On June 12, the Shakers had to replant crops destroyed by the cold. On July 7 it was so cold that everything had stopped growing. The Berkshire Hills had frost again on August 23.[10]A Massachusetts historian summed up the disaster: “Severe frosts occurred every month; June 7th and 8th snow fell, and it was so cold that crops were cut down, even freezing the roots …. In the early Autumn when corn was in the milk it was so thoroughly frozen that it never ripened and was scarcely worth harvesting. Breadstuffs were scarce and prices high and the poorer class of people were often in straits for want of food. It must be remembered that the granaries of the great west had not then been opened to us by railroad communication, and people were obliged to rely upon their own resources or upon others in their immediate locality.”[11]
Farther north, nearly 12 inches (30 cm) of snow was observed in Quebec City in early June, with consequent additional loss of crops—most summer-growing plants have cell walls which rupture even in a mild frost. The result was regional malnutrition, starvation, epidemic,[clarification needed] and increased mortality.
In July and August, lake and river ice were observed as far south as Pennsylvania. Rapid, dramatic temperature swings were common, with temperatures sometimes reverting from normal or above-normal summer temperatures as high as 95 °F (35 °C) to near-freezing within hours.
The weather was not in itself a hardship for hardy Yankees accustomed to long winters. The real problem lay in the weather’s effect on crops and thus on the supply of food and firewood.
Farmers south of New England did succeed in bringing some crops to maturity, but maize and other grain prices rose dramatically. The price of oats,[12] for example, rose from 12¢ a bushel ($3.40/m³) in 1815, equal to $1.53 today, to 92¢ a bushel ($26/m³) in 1816 ($12.65 today).
U.S. areas suffering crop failures also faced an inadequate transportation network, with few roads or navigable inland waterways and no railroads; it was expensive to import food.[13]
Cool temperatures and heavy rains resulted in failed harvests in Britain and Ireland as well. Families in Wales travelled long distances as refugees, begging for food. Famine was prevalent in north and southwest Ireland, following the failure of wheat, oats, and potato harvests. In Germany, the crisis was severe; food prices rose sharply. With the cause of the problems unknown, people demonstrated in front of grain markets and bakeries, and later riots, arson, and looting took place in many European cities. It was the worst famine of the 19th century.[8][14]
In China, the cold weather killed trees, rice crops, and even water buffalo, especially in the north. Floods destroyed many remaining crops. Mount Tambora’s eruption disrupted China’s monsoon season, resulting in overwhelming floods in the Yangtze Valley. In India the delayed summer monsoon caused late torrential rains that aggravated the spread of cholera from a region near the River Ganges in Bengal to as far as Moscow.[15]
In New York City, the temperature dropped to −26 °F (−32 °C) during the bitter winter of 1816-17. This resulted in a freezing of New York’s Upper Bay deep enough for horse-drawn sleighs to be driven across Buttermilk Channel from Brooklyn to Governors Island.[16]
The effects were widespread and lasted beyond the winter. In eastern Switzerland, the summers of 1816 and 1817 were so cool that an ice dam formed below a tongue of the Giétro Glacier high in the Val de Bagnes. Despite engineer Ignaz Venetz’s efforts to drain the growing lake, the ice dam collapsed catastrophically in June 1818.[17]
Allan MacRae says:
October 12, 2013 at 11:25 am
I suggest cooling could be similar to the Dalton Minimum, which coincided with an average 1 degree C decline in global average temperature and caused significant human suffering.
But the Dalton also included the Tambora eruption in 1815, one of the largest volcanoes in the past 2000 years. The year 1816 was called The Year Without a Summer.
Helped along with the eruption of Mayon in 1814 and another [unnamed] volcano erupting in 1809 http://onlinelibrary.wiley.com/doi/10.1029/2009GL040882/abstract
Obviously, I don’t predict a 1C decline [barring similar volcanic eruptions]
Allan MacRae says: October 12, 2013 at 10:23 am
This does not preclude the possibility that the observed increase in atmospheric CO2 is primarily caused by some factor (natural and/or humanmade) other than temperatures, but such increase in CO2 is insignificant to Earths’ temperatures. In summary, in climate science we do not even agree on what drives what…
tumetuestumefaisdubien1 says: October 12, 2013 at 11:13 am
I would think that the estimations of the anthropogenic emissions clearly exceed the rate of rise of its content in the atmosphere.
Where the surplus CO2 in atmosphere is coming from is in my opinion clear – it is anthropogenic – for example in 2008 from the global emissions estimations were that there was 40% more anthropogenic emissions than the atmospheric level rise would suggest, in 2010 46%. So the rest must sink, not be released from nature by unknown drivers. But the sinks are unable to adapt so quickly. The sinks evidently start to saturate and while in 1989-1992 the seasonal “sink” was 6.3ppm, in 2009-2012 already only 5.6ppm, while real sink in 2010 was 2.1ppm, the anthropogenic surplus was 4.5ppm. From the numbers is clear that nature is unable to keep up with the emissions development.
Allan says:
Hello tume, attributing the increase in atmospheric CO2 to the combustion of fossil fuels is called the “Mass Balance Argument” and it has been ably debated by Ferdinand Engelbeen (FOR) and Richard Courtney (NEUTRAL) here and elsewhere for years.
I am more or less NEUTRAL as well. Some days I am more neutral and some days I am less.
Got to go now.
Regards, Allan :-}
Some recent stuff:
http://wattsupwiththat.com/2013/10/08/the-taxonomy-of-climate-opinion/#comment-1440967
Gail Combs says:October 8, 2013 at 11:12 am
…Plants use all of the CO2 around their leaves within a few minutes leaving the air around them CO2 deficient, so air circulation is important. As CO2 is a critical component of growth, plants in environments with inadequate CO2 levels of below 200 ppm will generally cease to grow or produce… http://www.thehydroponicsshop.com.au/article_info.php?articles_id=27
Thank you Gail. Interesting.
http://wattsupwiththat.com/2013/08/11/murry-salby-responds-to-critics/#comment-1395118
(PLANT) FOOD FOR THOUGHT
CO2 is such a scarce and excellent plant food that it is gobbled up very close to the source during the growing season.
In urban environments like Salt Lake City where CO2 is emitted, it is gobbled up so quickly by plants that there is NO DISCERNIBLE HUMAN SIGNATURE IN THE DAILY CO2 RECORD.
For proof, see http://co2.utah.edu/index.php?site=2&id=0&img=31
Recognizing the CO2 is NOT that well-mixed in the atmosphere..
http://svs.gsfc.nasa.gov/vis/a000000/a003500/a003562/carbonDioxideSequence2002_2008_at15fps.mp4
… this may be where the “Mass Balance Argument” (fossil fuel combustion is the certain cause of atmospheric CO2 increases (NOT)) falls apart.
Let’s suppose that humanmade CO2 from fossil fuel combustion is quickly gobbled up by plants close to its (usually urban) source. The rest of the world and its carbon cycle just carries on, unaware in every way that humankind is burning fossil fuels. It also may be that humanity IS causing the observed increase in atmospheric CO2, but that increase may be due to other causes such as deforestation, agriculture, etc. Fossil fuel is just a convenient bogeyman – everyone hates the oil companies when they gas up their car – it’s just that the alternatives are worse.
Regards, Allan
The problem with Isvalgaards many answers is that he is arguing as apposed to considering or even debating. Valid arguments have been made and he ignores the majority picks a nit considers it done. TSI as measured is probably not as accurate as it could be. The data set has some obvious problems not the least of which is measuring something from within the atmosphere which is roughly considered to have particles out to 190,000km. The Sattelites are not in a direct line between earth and sun so there will be some scatter and waveform changes based on collisions. A small error could be significant.
Many others have made valid points.
What makes the article interesting is that there is an obvious correlation between the sun and SST’s. He makes a valid point that understanding where the failure between our measurements and reality lie is a key to understanding climate. Which we need to understand to avoid a lot of wrong ideas that we can hardly afford. The two biggest players in climate and long term trends is the SUN and Oceans. One provides the largest bit of energy and the other is a huge heat sink, this heat sink transports, stores and provides balance to the climate system.
So having a sharp shooter commenting to the negative on everything is really not helpful. If there are valid issues surely bring them up but don’t say things like 20 kilometers up and your out of the atmosphere, that is not good science.
David Riser says:
October 12, 2013 at 11:42 am
TSI as measured is probably not as accurate as it could be. The data set has some obvious problems not the least of which is measuring something from within the atmosphere which is roughly considered to have particles out to 190,000km. The Sattelites are not in a direct line between earth and sun so there will be some scatter and waveform changes based on collisions. A small error could be significant.
Modern measurements of TSI since 2003 are extremely precise. All of the ‘problems’ you bring up are non-existent. The errors are of the order of 0.007 W/m2 which is 1 part in 200,000 and are not significant.
David Riser says:
October 12, 2013 at 11:42 am
don’t say things like 20 kilometers up and your out of the atmosphere, that is not good science
The TOA [Top Of Atmosphere] is considered to be at 20 km altitude “the optimal reference level for defining TOA fluxes in radiation budget studies for the earth is estimated to be approximately 20 km. At this reference level, there is no need to explicitly account for horizontal transmission of solar radiation through the atmosphere in the earth radiation budget calculation. In this context, therefore, the 20-km reference level corresponds to the effective radiative `top of atmosphere’ for the planet.” http://www.leif.org/EOS/TOA-20km.pdf the satellite is at 645 km and is above the atmosphere. What is further out attenuates to an un-measurable degree.
lsvalgaard says:
October 10, 2013 at 4:01 pm
milodonharlani says:
October 10, 2013 at 3:52 pm
Science has historically been full of surprises & strongly-held certainties frequently overthrown by better analysis & discovery of more information.
I’m not discussing this in general [and this is all the other people trotting out their usual stuff], but let us stick to the article if this thread: it claims that 0.33 W/m2 input is required and notes that TSI only provides 3.6 times as little, or 0.09 W/m2. How can that work? what discovery awaits us that can provide 3.6 times more energy than supplied by the variation of TSI? The Sun cannot, the deep ocean might, or the calculation is wrong.
—
During periods of higher solar activity cycles, Earth slows down, that slowing is caused by solar friction, creating more friction. Heat expressed outward through hydro thermal venting and other tectonic mechanisms.
Earth’s rotation can vary over solar cycles so if we had higher activity consecutive solar cycles more heat outwards. Ocean is then mixed during min. periods within each cycle, as the Earth speeds up during low solar activity.
Pull some intense heat of the land masses too, from manmade structures and send that heat over the oceans with pollution gas and add some atmospheric mixing wind patterns.
Probably more heat sources around..
Couple of questions if I may?
Eleven Spacecraft Show Interstellar Wind Changed Direction Over 40 Years
Wondering if Dr. S., might think that the change in heliospheric parameters (due to Interstellar wind change) began occurring around solar cycle 21 until present?
see page 11 of
Long-term Solar Synoptic Measurements with Implications for the Solar Cycle
Leif Svalgaard
23 April 2013
http://www.leif.org/research/Synoptic-Observations.pdf
Also, does TSI vary over Positive N. Pole (de-focusing) and Negative N. Pole (focusing) solar cycles at the top of Earth’s atmosphere?
Is there a relationship between the Asymmetric Solar Activity and Interstellar wind changes. Like from a head on head wind to a “T” bone type Interstellar wind configuration?
After the prompting of “The Sun Does It: Now Go Figure Out How!” , I offer the following under the category of “something interesting that I read on the internet” (where I also file WUWT).
Apologies for the long post. I encourage inquiring minds to read the whole thing.
From http://www.columbiadisaster.info/index.html#the_terminator
“…
The Terminator
The “terminator” is a name given to the “line” where night meets day, and day meets night. Obviously it’s location on the globe changes as the Earth rotates. There is significant evidence that the terminator would be more likely to attract electrical activity than other areas of the globe at any given time.
The following paragraphs … make reference to large sheets of electric current running through the morning side and evening side of the ionosphere,…
In 1973 the navy satellite Triad flew through the auroral zone region in a low-altitude orbit, its magnetometer indeed detected the signatures of two large sheets of electric current, one coming down on the morning side of the auroral zone, one going up on the evening side, as expected. Because Kristian Birkeland had proposed long before currents which linked Earth and space in this fashion, they were named Birkeland currents (by Schield, Dessler and Freeman, in a 1969 article predicting some of the features observed by Triad). Typically, each sheet carries a million amperes or more.
But that wasn’t all. Equatorward of each current sheet, Triad noted a parallel sheet almost as intense, flowing in the opposite direction: those field lines were no longer open, but closed inside the magnetosphere. It thus seemed that most of the electric current coming down from space (about 80%) did not choose to close through the ionosphere across the magnetic poles. Rather, it found an alternate way: it flowed in the ionosphere a few hundred miles equatorward and then headed out again to space, where the currents (presumably) found an easier path.
[…]
Further information Steven [Schwartz, former MIT research scientist] collected was on Auroral Activity Estimates from a series of NOAA satellites that orbit Earth between the North and South Poles. These Satellites can only monitor these Aurora when flying past the North or South polar regions so the data is only sporadically given every few minutes. The information shows the Auroral Activity Estimates for Northern Hemispheric power at 1345 UT = 8:45 AM EST was at 55 gigawatts (level 8) just prior to the Shuttle problems, average expected levels are 12 gigawatts (level 5). This information may confirm that the dawn current sheet had indeed extended southward to the Shuttle location, or close enough for a discharge to take place between the million amperes or more current sheet and the shuttle. …
In 1998 it was reported by Professor Louis Frank and colleagues from the University of Iowa that auroras mysteriously show a tendency to hug coastlines. They write, “coastline arcs can be as thin as tens of miles, align along coastlines for several hundred miles, and last several minutes. The phenomenon normally occurs during the early phase of an auroral storm. Though scientists cannot yet explain why this coastline effect occurs, part of the answer seems to lie in the knowledge that ground currents are much greater off shore because sea water is a better conductor of electricity than the land.” “It would appear,” notes Frank, “that at certain times the ionosphere is primed for the generation of the thin arcs over the coastlines and that the arcs are tickled into brightening by the magnetic or electric fields from the ground currents. This is quite remarkable because these auroral lights are occurring at altitudes of 60 to 200 miles above the shores.” …
…“The satellites have found evidence of magnetic ropes connecting Earth’s upper atmosphere directly to the sun,” said David Sibeck, project scientist for the mission at NASA’s Goddard Space Flight Center, Greenbelt, Md. “We believe that solar wind particles flow in along these ropes, providing energy for geomagnetic storms and auroras.” …
From http://wattsupwiththat.com/2013/10/10/the-sun-does-it-now-go-figure-out-how/#comment-1445749
But the Dalton also included the Tambora eruption in 1815, one of the largest volcanoes in the past 2000 years. The year 1816 was called The Year Without a Summer.
Helped along with the eruption of Mayon in 1814 and another [unnamed] volcano erupting in 1809 http://onlinelibrary.wiley.com/doi/10.1029/2009GL040882/abstract
Perhaps Willis should look into those volcanic eruptions and see if they were responsible for the cooling during the Dalton. Or maybe others might have techniques that may shed some light on whether the Dalton was all about Volcanoes.
I think the Maunder also had a degree of Volcanic activity. Does Leif have a similar list for the Maunder ?
But then, it seems there is some correlation between periods of low sunspots / minimums and volcanic activity going back further than the Maunder, so perhaps whatever process(es) are involved in reducing sunspots also play a part in increasing volcanic activity on Earth.
Ferd, absolutely. That is one thing I do “believe” is true in science…
ignorance grows at least linearly with knowledge. I see that happening to myself every day. Some seem to have a sort of ‘ego block’ and that prevents them from seeing that relationship. It’s almost like a fractal as science branches into a thousand sub-specialities and sub-sub-specialties. Now I see where you are were headed.
J Martin says: October 12, 2013 at 1:13 pm
J. I recall Willis wrote something on WUWT called Find the Volcano or similar.
allan macrae,a fantastic series of posts . an education in themselves .thank you.
Also, does TSI vary over Positive N. Pole (1 de-focusing) and Negative N. Pole (2 focusing) solar cycles at the top of Earth’s atmosphere?
Reason being is those pesky interstellar neutrals keep changing angles (like they are on a 3 sliding scale) we didn’t start getting our annual heatwaves around these parts till late july and well into august and sept. Is that when Earths atmosphere expanded the most for this year? Thinking about some helium focusing cone angle shifts and an ionization exchange rate and how an addition of neutrals in the Earth orbit might muck up some irradiance parameters mistaken for solar flux.
We can thank wiki for the questions today..
http://en.wikipedia.org/wiki/Solar_irradiation
The solar constant, a measure of flux density, is the amount of incoming solar electromagnetic radiation per unit area that would be incident on a plane perpendicular to the rays, at a distance of one astronomical unit (AU) (roughly the mean distance from the Sun to the Earth). The “solar constant” includes all types of solar radiation, not just the visible light. Its average value was thought to be approximately 1.366 kW/m²,[11] varying slightly with solar activity, but recent recalibrations of the relevant satellite observations indicate a value closer to 1.361 kW/m² is more realistic.[12] This radiation is about 50% infrared, 40% visible, and about 10% ultraviolet, at the top of the atmosphere.[3]
So, then also can we call the interactions at both the Earth’s magneto pause and the Solar helio pause, “Irradiation producing regions,” where irradiance may be greater?
Dancing with Myself
“nothing to lose and nothing to prove”
Billy Idol
Rhys Jaggar, I am in agreement with your statement that this needs to be analyzed at a more line-by-line basis. We have all seen the UV records of the recent drop, contraction of the atmosphere and somewhat likewise increase in lower frequencies in the last few years but each piece of matter whether it be seawater, organisms in the seawater, particles in the atmosphere, soil and rock all have their own lines of primary absorbance. You can’t just ignore these differences that is solar based. Good point there, that question has always been upstairs here also.
Carla says:
Eleven Spacecraft Show Interstellar Wind Changed Direction Over 40 Years
October 12, 2013 at 1:10 pm
Is there a relationship between the Asymmetric Solar Activity and Interstellar wind changes?
Like from a head on head wind to a “T” bone type Interstellar wind configuration? Which may easily be re produced by a corotating interaction region of two Interstellar shells. Their distribution in our neighbor hood, taken the solar orbital barry center motion, would give a N. S. change on the T bone approx. 66 to a 100 years.
The head wind from N. galactic pole is constant, but corotating regions are many and variable. And may have a 60 to 100 year periodicity during this epoch of the Solar Journey………………………………
Carla says:
October 12, 2013 at 4:40 pm
Is there a relationship between the Asymmetric Solar Activity and Interstellar wind changes?
No, as the solar wind keeps the interstellar stuff away from us.
If everyone asking about the absolute TSI accuracy should view this:
http://esto.nasa.gov/conferences/estc2008/presentations/RocheB3P3.pdf @ http://acrim.com/
and ask yourself, even though these instruments flying on various platforms all have a very precise ability to measure momentary differences in the TSI the absolute accuracy, a different parameter Leif, they give the distinct question why those back to the early ’80s are in the 1367-1372 range but current SOURCE/TIM of apprx. 1361-1362 W/m². I’m sure Leif will counter this, in his mind and his colleagues of like mind that the sun never changes it’s output, and, he will always highlight the relative precision small figure to draw attention away but each here should at least have the opportunity to see such plots that raise a question outside of the leveling adjustments if there could be some misapplied assumptions involved here.
J Martin says:
October 12, 2013 at 1:13 pm
At least two VEI 6 (Pinatubo order of magnitude) eruptions occurred during the Maunder Minimum (c. AD 1645 to 1715):
http://en.wikipedia.org/wiki/List_of_large_volcanic_eruptions
6 Long Island (Papua New Guinea) Bismarck Volcanic Arc 1660
6 Kolumbo, Santorini South Aegean Volcanic Arc Sep 27, 1650
milodonharlani says:
October 12, 2013 at 9:40 am
Jim G says:
October 12, 2013 at 7:31 am
“Undersea volcanism varies over time, of course. Air temperature in the Cretaceous, for instance, was warm, but not enough to heat the oceans to the degree observed in proxy data. Sea level was so high then not just because of lack of ice, but due to thermal expansion of the oceans, thanks to submarine volcanism-driven active seafloor spreading as the continents raced away from each other. They’re still doing that, of course, but not to the same extent as especially in the mid-Cretaceous.”
I cannot help but think that this, along with a multitude of other unknown quantities, might have a substantial and varying effect upon our climate over the shorter term, non-geologic time frames, just as land based volcanism does.
@milodonharlani
Also, another thought, since under sea activity injects heat directly into the water it would be much longer lasting in its effect than mere reflection of TSI components.
Jim G says:
October 12, 2013 at 5:15 pm
Submarine volcanism also has a long-term climatic effect, as I indicated for the Cretaceous. The split up of Gondwana let the sea in among the Americas, Europe & Africa, with active seafloor spreading between these formerly conjoined continents, thus heating these new seaways.
Jim G says:
October 12, 2013 at 5:22 pm
Indeed, especially when the heat injection process lasts for millions of years.
wayne says:
October 12, 2013 at 5:04 pm
have a very precise ability to measure momentary differences in the TSI the absolute accuracy, a different parameter
As I have pointed out already, the SORCE data has an absolute accuracy of 0.5 W/m2. For variations over time, what matters is the relative precision which is about a thousand times better. Earlier instruments had systematic errors [the precision aperture was in the wrong place allowing scattered light to enter the cavity thus giving too high values]. All this is now known and can be corrected for.
each here should at least have the opportunity to see such plots that raise a question outside of the leveling adjustments if there could be some misapplied assumptions involved
If you don’t care to read the explanation of the detection and correction of the systematic errors in older data, what does looking at the plots do for you? Here is the beef: http://www.leif.org/EOS/2010GL045777.pdf This is now a non-issue and no further misconceived questions should arise.
milodonharlani says:
I would assume that since the plates keep moving that it is a continuous process only varying in degree.
Jim G says:
October 12, 2013 at 5:30 pm
There is less volcanism when the plates are all run together, as during Pangaea. When that last supercontinent started splitting up, the oceans necessarily warmed up. Also, seafloor spreading doesn’t always occur at the same rate while it is going on, & as the Atlantic has gotten larger, the same amount of volcanism heats it relatively less per unit of volume.
For instance, the epicontinental seaways that spread & retreated across North America in the Jurassic & Cretaceous transgressed & regressed largely due to thermal expansion & contraction from varying degrees of volcanism. Extinction events both on land & in the seas are also often associated with, if not conclusively caused by, extensive rift volcanism. A notable example is the Triassic-Jurassic, one of the so-called Big Five.
Today plate rates of motion vary considerably, & have done so more in the past:
http://hypertextbook.com/facts/ZhenHuang.shtml
The Indian Plate has run into the Eurasian, lifting up the Himalayas, but before that it was a speed demon crossing the Indian Ocean from Antarctica, although at varying rates:
http://gji.oxfordjournals.org/content/early/2013/05/27/gji.ggt162.abstract
It passed over the Reunion Island Hot Spot around the end of the Mesozoic & start of the Cenozoic Eras, ie at the K-T mass extinction event. This caused the Deccan Traps flood basalts, implicated in that extinction, along with the bolide impact in the Yucatan.
lsvalgaard: Quote:The solar TSI variations that reach the earth’s surface are smaller than the 0.33 watt/m2 needed to account for sea surface temperature variations by a factor of 3.6 for this smallest estimate of sea surface temperature variability.
Reply:So, in normal science, that falsifies the assumption that solar variations are the cause.
So what causes the Earth mean temp, sea surface rise and ohc to fluctuate in synchrony with the solar cycle? Did you dispute that the synchrony has occurred?
What his calculations show is that in the standard model (time-and-area-averaged insolation, time-and-area-averaged response, etc), the Earth effect can not be obtained from the direct effect of the small TSI change. If the non-linearity of the dynamic response (Equator vs poles, day vs night, radiation vs vaporization, etc) is inaccurately modeled, then the fault is in the Earth model, not the claim that the fluctuations in TSI are responsible. If the effect of TSI is real, then the mechanism must be an indirect effect such as cloud-cover change. Only if the entire model is complete and accurate does this result show that solar variations are not the cause.
lsvalgaard: Quote: For a start, here’s 50 papers describing potential solar amplification mechanisms
Reply:None of those explain how 3.6 times more heat reach the surface than the variation of what the Sun puts out…Otherwise the climate system would be a nifty energy producer: you put 10 units in and you get 36 out. I want one of those 🙂
If some component of insolation causes variation in the cloud cover, then that component is acting more like a component of a triode, pentode, or transistor than like an amplifier.
Right now, evidence for and against such indirect mechanisms is not very complete. To claim that they can’t exist on the scale required to account for the Sun’s effects is premature.
lsvalgaard: The albedo is basically determined by clouds. It takes a lot of energy to make clouds. The solar wind does not have a lot of energy.
It is helpful to cloud formation if there are condensation nuclei, and the variation in the solar wind probably has some effect on those.
Leif Svalgaard, I think that you have shown conclusively that a direct effect of tiny variations of TSI on the Earth surface, expressed with respect to the standard simplified model of the mean Earth, is not demonstrated by the main post. As was admitted and shown in the main post. Your arguments that there can be no indirect effects by components of the solar radiation, broadly considered, are exclusively restatements of the fact that there is no evidence for a direct effect within the constraints of the standard model.
Whether mechanisms to account for a non-negligible, indirect effect is a research area with important unanswered questions.
Yes Leif, all should also also read http://www.leif.org/EOS/2010GL045777.pdf . Sorry I didn’t include that KL2010 paper and everyone should read it very carefully, I have before.
It is about TSI and the instruments that measure it, and you would think such a paper should be devoid of repeated mentions and ties to the like of IPCC, analyses of global surface temperatures, CRU, human anthropogenic warming and such, but it isn’t. I for one will await time to pass to see if this was all performed correct and proper.
One thing that raised my eyebrows in that paper was the mention that the previous radiometers were letting 2-3x (200-300%) the solar irradiance than what they were actually measuring yet the warmer readings were a mere 0.13% warmer. You would think it would be much more that reported. I’ll just keep that paper on hold for future confirmations or corrections.
It is interesting, in Leif’s link, figure 3a how PMOD, ACRIM and TIM show an almost identical fluctuation pattern since 2003, with TIM having the lower offset. They say that their aim is to increase the stability with time by a factor of ten which sounds good for future TSI readings. Wish we could do likewise with land/sea temperatures.
The article concludes
Quite a difference.
Ulric Lyons says:
October 12, 2013 at 6:38 am
Tom in Florida says:
“..vast ocean circulation and large annual temperature ranges that all happen at different times and places around the Earth and that are caused by things other than the Sun.”
Unless of course solar plasma variability effects pressure systems and the jet stream latitude and equatorial winds, then it would be forcing the AMO and ENSO.
——————————————————————————————————————
You forgot to post the link to the reference paper from which you are getting your information.
Matthew R Marler says:
October 12, 2013 at 6:07 pm
So what causes the Earth mean temp, sea surface rise and ohc to fluctuate in synchrony with the solar cycle? Did you dispute that the synchrony has occurred?
I have always said that the small variation of TSI is just enough to explain the small solar cycle variation of climate, but since that effect is observed to be small the Sun is not the driver of the much larger [and therefore important] variations that have taken place.
Right now, evidence for and against such indirect mechanisms is not very complete. To claim that they can’t exist on the scale required to account for the Sun’s effects is premature.
I say that they exist and have just the right size to explain the observed variation. The authors of the article [and many commenters and you, it seems] dispute that. Go figure.
is not demonstrated by the main post.
The main post denies that the variation of TSI explains the observed variation. I say that the observed variation on the time scale of a solar cycle is neatly explained by the variation of TSI. You seem to deny that.
wayne says:
October 12, 2013 at 6:38 pm
I for one will await time to pass to see if this was all performed correct and proper.
If you cannot see everything is above board and done properly now, then you can wait forever.
One thing that raised my eyebrows in that paper was the mention that the previous radiometers were letting 2-3x (200-300%) the solar irradiance than what they were actually measuring yet the warmer readings were a mere 0.13% warmer.
I don’t know where you get the 200-300% from. This is just wrong.
Keith Minto says:
October 12, 2013 at 7:03 pm
This new value, measured by SORCE/TIM….Quite a difference.
But the variation with time does not have that large difference and that is the most important. It is like your measuring the height of a wave on the surface of the sea to be 10 feet, but when you measure it from the bottom of the sea [5000 feet down] it will be 5010 feet. Then re-measurement of the sea bottom profile now shows that the bootom is actually 5015 feet down, so now the wave height is 5025 feet, but the wave you see at the surface is still only 10 feet, regardless of how deep the sea is…
UKSP Nugget: What is our current understanding of solar irradiance variations?
The thermal efficiency parameters calculated from this experimental data could result in an uncertainty of ±2.5 W/m² on TSI values:
http://www.issibern.ch/teams/solarirradiance/Meeting2_Presentations/DIARAD_Sabri.pdf
AJB says:
October 12, 2013 at 10:02 pm
The thermal efficiency parameters calculated from this experimental data could result in an uncertainty of ±2.5 W/m² on TSI values
On the DIARAD TSI values, luckily not on the SORCE/TIM series.
lsvalgaard says: October 12, 2013 at 10:07 pm
Sure, but will this not have an effect on reassessment of composites like PMOD?
From that link, AJB
and
Together with a discussion of the wavelength limitations of SORCE, brings us closer to answering my original question.
The TSI variance seems to getting larger, not smaller.
lsvalgaard says:
October 12, 2013 at 8:48 pm
Ok, you will find that on page 4 of 7 near the bottom:
Excerpt:
Well, yes, of course you would expect some warming effect on the instrument since dealing with direct solar radiation in the void of space. I’m just a bit surprised they found it was that small 0.0013 fraction of spurious warming in the readings. Maybe there was refrigeration to remove heat but I don’t see such fine details such as specific design descriptions.
Leif, I normally accept papers at their face value knowing all of the work that goes into them. But as we have seen over and over again in climate science especially propping IPCC’s entire reason to exist and you had better not do so at face value. I’m just sorry this paper had to be a mix of the two and I could trust it more.
Keith Minto says, October 12, 2013 at 10:51 pm
bit chilly says: October 12, 2013 at 4:10 pm
allan macrae, a fantastic series of posts . an education in themselves. thank you.
____________
Allan says: Thank YOU Chilly for your kind words.
The one certainty in this difficult and often-fractious debate on Earth’s climate and its causes and effects, is that we are all in this together.
I recall as a young man, in a moment of temporary youthful despair, walking into student housing and seeing this on the wall:
‘No Man is an Island’
No man is an island alone unto itself;
Every man is a piece of the continent, a part of the main;
If a clod be washed away by the sea,
Europe is diminished,
Even as a promontory were,
Even as a Manor of thy friends or of thine own were;
Any man’s death diminishes me,
Because I am involved with mankind.
And therefore send not to know for whom the bell tolls;
It tolls for thee.
***********
There was no attribution to an author.
I later determined that this was an edited modern version of Meditation XVII, Devotions upon Emergent Occasions, by John Donne.
I recall that these eloquent words put my (probably trivial) problem of the moment into better perspective.
But what really struck me at the time was the date of publication – 1624* – and the modernity of the ideas in a time of rigid social hierarchy and great violence at all levels of society.
Best regards, Allan
* James I was King, son of Mary Queen of Scots, beheaded by Elizabeth I, daughter of Henry VIII, who also tended to behead those who fell into disfavour. To his credit, Henry only beheaded two of his six wives. Apart from his wives and many others, Henry beheaded Sir Thomas Moore in 1535. More had in 1516 published the book “Utopia” which also espoused concepts of society that were remarkably modern for their time.
Keith Minto says:
October 12, 2013 at 10:51 pm
The SORCE mission is reaching an end so, for now, the potential range of solar cycle spectral variability is likely to remain quite large and therefore uncertainty will remain in the impact it has on the Earth’s climate system.
You are confusing TSI with SSI [the spectral variability, i.e. the variation with wavelength of the irradiance]. SSI is very difficult to measure. The errors are of the order of 10% or more, while the error on TSI is thousands of times smaller.
Together with a discussion of the wavelength limitations of SORCE, brings us closer to answering my original question.
There are no wavelength limitations in SORCE/TSI.
The TSI variance seems to getting larger, not smaller.
Again confusion of SSI and TSI.
wayne says:
October 12, 2013 at 10:56 pm
Additionally, this design allows into the instrument interior two to three times the amount of light intended to be measured; if not completely absorbed or scattered back out, this additional light produces erroneously high signals.
The interior has a system of baffles designed to eliminate this extra light, but a small fraction gets by anyway. SORCE/TIM does not have that problem.
Leif, I normally accept papers at their face value knowing all of the work that goes into them. But as we have seen over and over again in climate science especially propping IPCC’s entire reason to exist and you had better not do so at face value. I’m just sorry this paper had to be a mix of the two and I could trust it more.
The remedy is simple: read the paper and the supporting documentation. Your default assumption [that all papers cannot be trusted] is wrong. Now, it is a too easy excuse to blame the data producers for conspiracy and monkey business, but in case of SORCE/TSI that excuse is not valid. And the paper does not ‘mix the two’. On the contrary, it is critical of the models used by IPCC: “This response is larger by a factor of 2 or more than in the current models assessed by IPCC [Tung et al., 2008], possibly because of the models’ excessive heat uptake by the ocean”.
Leif writes “SSI is very difficult to measure. The errors are of the order of 10% or more, while the error on TSI is thousands of times smaller.”
And yet SSI is the area where the sun could have the most direct influence in the different levels of the atmosphere. Changes in UV resulting in changed atmospheric O3 concentrations and altitudes could have larger impacts on the surface temperature than the wattages needed to make the changes. Its a big unknown, routinely brushed aside by Leif.
Do you pretty much exclusively focus on TSI because that’s your area of expertise Leif?
TimTheToolMan says:
October 13, 2013 at 5:49 am
Changes in UV resulting in changed atmospheric O3 concentrations and altitudes could have larger impacts
‘could have’. But show that they ‘do have’
Do you pretty much exclusively focus on TSI because that’s your area of expertise Leif?
Not at all. The UV is actually where most of my interest lies. The UV creates the ionosphere and modulates the diurnal variation of the geomagnetic field, so is very important in studying the magnetic effects [which is my specialty]. Especially for long-term studies. We have know [and have data for] this modulation since 1722 when it was discovered by George Graham. The data shows that UV since then has varied just as the sunspot number and [therefore] TSI. So any changes in atmospheric properties must follow that same rythm, and yet there is little evidence of it in the climate record.
Leif says “So any changes in atmospheric properties must follow that same rythm, and yet there is little evidence of it in the climate record.”
SSI varies with TSI but what about the strength of the relative proportions of the wavelengths? There is no data for that and so we cant be sure if there are longer term changes. So for example the amount of UV in recent solar cycles may on average be a little higher (or lower) than in the past.
lsvalgaard says:
October 13, 2013 at 6:13 am
“The data shows that UV since then has varied just as the sunspot number and [therefore] TSI.”
First, as you surely know the causal relation between sunspots and TSI is negative – sunspot occurence on the disk causes TSI to drop – their correlation is typical example of correlation which has nothing to do with causation, because the factor – solar activity – which makes them correlate is independent from the two. Also if you have little or no sunspots the correlation of the TSI and SSN tends in principle to zero as tends to zero the SSN correlation with UV. So the relation between SSN and TSI and UV variation is not so simple as that UV [and therefore TSI] varies “just as the sunspot number”, it is mathematically ruled out straight away.
Now, the SORCE SIM data quite look, that what you say could even not be the case.
It seems to show, that generally the relative variability in UV region rises steeply with frequency (with descending wavelength) and that the XUV and EUV have considerably different than Planck distribution (maybe because Sun obviously isn’t a blackbody and doesn’t behave exactly like that – especially not in the UV region).
But the real point is that the absolute variability in UVA+UVB region is considerably higher than the variability of the TSI over whole spectrum and especially considerably higher than the variability in visible and IR region, which in some regions seem even show quite strong antiphase behavior. (see here
Basically the data show that the UVA+UVB+part of theNIR make the solar cycle characteristic signal, offsetting antiphase behavior in regions of visible and IR spectrum above 1 micrometer (see here). And because that part of the IR is unlike the UVA+UVB largely blocked by atmospheric water content (which is in larger quantities present especially above ocean and especially in well insolated regions due to higher air temperature) to get to surface, it could be argued that if the SORCE spectral data are indeed corresponding to reality without substantial error, then the variability of absolute UVA+UVB spectral irradiance of the surface during the solar cycle could be considerably higher than variability of the TOA TSI, suggesting, although it could seem being a paradox, that also surface TSI variability could be bigger than the TOA TSI variability due to absorbed part of the IR around the 1125nm,1375nm and 1875nm regions.
When I go back to the topic of the above article and I couple this to the steeply rising water extinction coeficient (from the minimum around 430nm deep blue) with descending wavelength in the UVA+UVB region I would bet that if the above analysis or generally a correlation of SST to solar activity would be done with the UVA+UVB absolute variation between solar cycle minimum and maximum calculated from the spectral data showing such behaviour as SORCE SIM data (reduced to that at the surface after passing atmosphere and filtering out the absorbed part of the NIR) and also adressed the other obvious problems with the analysis in the article I described in the post above (October 12, 2013 at 9:06 am), especially the clearly out of reality explicite or implicite assumptions that ocean receives average insolation, reflects 6.7% and that it radiates at ε=1 the resulting factor would be in my opinion considerably closer to 1 than the 3.6 and maybe even the closing question from the article “how the Sun does it”, would be answered.
Unfortunately the SORCE SIM data cover quite short period in time (04/21/2013 – 09/25/2010) not even over 1 solar cycle and not covering the cycle peak period, so the variability over solar cycle would need to be partially interpolated, which would of course introduce some more uncertainty.
The sun does interact with the earth beyond light.
Dr. Viktor N. Bokov predicts earthquakes based on solar storms.
He says, earthquakes are caused by the weight of the atmosphere in the tectonic plates.
There are cycles in the circulation of the atmosphere that allows us to predict future weather and that earthquakes, oddly enough, are regulated by the Sun and follow certain patterns that allow their prevention.
He works with the Vangengeim-Girs meteorological index. Studying three types of circulations C, W and E, Bokov is able to predict long-term weather, after reconstructing these patterns of the last thousand years.
Bokov’s Site: http://quake_vnb.rshu.ru/index_eng.html
V-G Index: http://www.fao.org/docrep/005/y2787e/y2787e03.htm
And here is a google-translated interview with graphs explaining his method.
http://translate.google.es/translate?sl=es&tl=en&js=n&prev=_t&hl=es&ie=UTF-8&u=http%3A%2F%2Fwww.cherada.com%2Farticulos%2Ffch93-s316-p25259-doctor-viktor-bokov-se-avecina-una-nueva-glaciacion-en-la-tierra
Extract:
“3.-You said in my book in 2005 Glacial Heat expected cooling or ice would start with the new solar cycle from 2010-2012, according to the meteorological index Vangengeim-Girs, do you still think the same?
Yes, start with the 2012-2015 cooling and indirectly be connected with the new solar cycle 24 (which has been advanced in January 2008). The influence of the Sun in time and climate of the Earth is shown through the transformations of the forms of atmospheric circulation that influence a condition of the world ocean with subsequent interference of the ocean and atmosphere. In connection with the prevalence of any form of flow paths cyclones (low pressure = bad weather) and anticyclones (high pressure = good time) vary warming causes an area of global warming and a cold snap in another .
Transforming atmospheric turbulence trajectories atmospheric conditions change in different areas of the Earth. These paths are maintained from 10 to 40 and then alter the subsequent return. The expected increase in the repeatability of the southern forms Circulation Vangengeim-Girs C will lead to a cold snap similar to what was observed in the XVII and XVIII (there was a mini ice age known as the Maunder Minimum.
But cooling does not begin abruptly but gradually slow growth in the number of snow and cold winters. Increased catastrophic natural phenomena is observed in a time interval when the circulation forms W and C and E are close to equal amount of repeatability. Well be seen in figure 1, which shows the forms W, C and E in the last thousand years reconstructed by myself. “
TimTheToolMan says:
October 13, 2013 at 3:36 pm
So for example the amount of UV in recent solar cycles may on average be a little higher (or lower) than in the past.
No, we know that is not the case. I assume that you mean for cycles of equal strength, otherwise your comment has no meaning. And since we know the UV flux and the sunspot number back 170 years, we can check if you assertion is true and it isn’t.
tumetuestumefaisdubien1 says:
October 13, 2013 at 5:16 pm
First, as you surely know the causal relation between sunspots and TSI is negative – sunspot occurrence on the disk causes TSI to drop – their correlation is typical example of correlation which has nothing to do with causation, because the factor – solar activity – which makes them correlate is independent from the two.
No, there is a strong causation: Magnetic fields are born as faculae, evolve into sunspots, which in turn evolve into faculae. Faculae brighten the Sun twice as much as sunspots darken the sun, and the faculae and spots vary closely together.
as that UV [and therefore TSI] varies “just as the sunspot number”, it is mathematically ruled out straight away.
Regardless, observations show that UV and sunspot number vary the same way.
It seems to show, that generally the relative variability in UV region rises steeply with frequency
So what? the UV is still the same fraction of solar activity, because UV varies closely with the sunspot number.
which in some regions seem even show quite strong antiphase behavior. …
People have looked at this and find effects of the order of 0.05C, so completely negligible.
The rest of your comment is just speculation and hand waving, granted that hand waving is the most common wave in all of climate science.
TimTheToolMan says:
October 13, 2013 at 3:36 pm
tumetuestumefaisdubien1 says:
October 13, 2013 at 5:16 pm
For both of you: http://www.iup.uni-bremen.de/gome/gomemgii.html
lsvalgaard says:
October 13, 2013 at 7:16 pm
“People have looked at this and find effects of the order of 0.05C, so completely negligible. The rest of your comment is just speculation and hand waving, granted that hand waving is the most common wave in all of climate science.”
So in your opinion the well established facts that 1: the ocean receives very considerably more effective insolation than is the Earth average (both because the bulk is at lower latitudes then the latitude of average insolation, and due to way lower than average Earth surface reflectivity), that 2: ocean water simply doesn’t have ε=1 or very close to 1, that 3: atmospheric water content very strongly absorbs IR around 1125nm, 1375nm and 1875nm bands (and I would add that in the >1 micrometer region of solar spectrum has very often several orders of magnitude higher absorbtivity than for UVA+B region – which by far cannot be ofsetted by the O3 atmospheric content when we talk about surface solar irradiance variability, not speaking that both contribute each at its point of occurence to atmospheric temperature, which is crucial factor directly determining radiative heat transfer rate from surface to space) is “speculation, handwaving”?
I’ll tell you something Leif: just the first 2 points from the 3 I’ve just named would cut the above 3.6 factor figure you liked so much (well, I suspect because it so well seems to confirm your well known bias) by factor >2.
How much the highly diverse and sometimes maybe even paradox SSI variabilities in various spectral regions of the solar spectrum (which seems the SORCE SSI now shows, and generally higher than thought until now) relatively to the TSI variability would contribute to the temperature changes I don’t well know, but it is you who names it (“order of 0.05C” – “completely negligible”), thank you. – It seems like you still haven’t noticed it, but nothing more than the 0.04-0.05C solar cycle SST amplitude and what&how causes it this whole debate is about. (ROFLMAO smiley)
tumetuestumefaisdubien1 says:
October 14, 2013 at 2:49 am
So in your opinion the well established facts…
A collection of facts of facts is one thing, the attempted conclusion drawn from that is something else. That is the hand waving comes in.
How much the highly diverse and sometimes maybe even paradox SSI variabilities in various spectral regions of the solar spectrum (which seems the SORCE SSI now shows, and generally higher than thought until now) relatively to the TSI variability would contribute to the temperature changes I don’t well know, but it is you who names it (“order of 0.05C” – “completely negligible”), thank you. – It seems like you still haven’t noticed it, but nothing more than the 0.04-0.05C solar cycle SST amplitude and what&how causes it this whole debate is about.
As I said, people have looked into this, e.g. see http://lasp.colorado.edu/sorce/news/2011ScienceMeeting/docs/presentations/6b_Cahalan_Sedona_9-15-2011.pdf and if all the Sun is doing is 0.05C then the Sun is not a major driver of climate, which is really what this whole debate is about.
Steven Mosher says:
October 10, 2013 at 10:14 pm
Do you seriously imagine that modelers know all the sources of climate forcings? Or that the assumptions they make about each even remotely correspond to reality?
Clearly, they don’t, since the GCMs fail so ludicrously epically.
milodonharlani says:
October 12, 2013 at 5:39 pm
Jim G says:
October 12, 2013 at 5:30 pm
Here’s an explanation for why there was so much thermal expansion in the Cretaceous:
http://serc.carleton.edu/research_education/cretaceous/superplume.html
I see a lot of confusion on this thread between energy and power. Power is the time flux of energy. TSI is a measure of areal density of power. It has units of Watts/m^2. A Watt is a Joule per second. A Joule is a measurement of energy.
It makes no sense to say that TSI does not provide enough energy to effect some temperature variation. TSI is continuously providing energy, some number of Joules per square meter per second. Over time, those Joules can accumulate. A small variation in Watts can integrate over a long period of time into a significant number of Joules.
I thought that it was understood that the integration time was the solar cycle period.
Bart says:
October 14, 2013 at 10:02 am
I see a lot of confusion on this thread between energy and power.
In this case the confusion is in the eye of the beholder.
It makes no sense to say that TSI does not provide enough energy to effect some temperature variation.
In that case it makes no sense to say “TSI is continuously providing energy”
Over time, those Joules can accumulate.
When you heat something up, it will immediately radiate the energy absorbed away, unless you provide isolation to keep it from radiating.
bones says:
October 14, 2013 at 10:19 am
I thought that it was understood that the integration time was the solar cycle period.
Why that?
“When you heat something up, it will immediately radiate the energy absorbed away, unless you provide isolation to keep it from radiating.”
Ah, so that’s why, when I put a pot of stew on the stove, it heats up immediately and then resumes room temperature as soon as I turn off the eye. I really think you enjoy disagreeing just to be disagreeable.
bones says:
October 14, 2013 at 10:19 am
“I thought that it was understood that the integration time was the solar cycle period.”
The “solar cycle” is only one component of TSI variation. Other components of longer duration have more time to integrate into something of significance.
Bart says:
October 14, 2013 at 11:20 am
“When you heat something up, it will immediately radiate the energy absorbed away, unless you provide isolation to keep it from radiating.”
Ah, so that’s why, when I put a pot of stew on the stove, it heats up immediately and then resumes room temperature as soon as I turn off the eye. I really think you enjoy disagreeing just to be disagreeable.
To reduce your confusion I probably should have said: “it will immediately begin to radiate…”, although I took that as going without saying, but, of course, it is dangerous to make assumptions about people’s abilities [so sorry about that].
The “sunspot time integral” and ocean oscillations explain 90-96% of observed global temperature variability
http://hockeyschtick.blogspot.com/2010/01/climate-modeling-ocean-oscillations.html
http://hockeyschtick.blogspot.com/2013/08/natural-climate-change-has-been-hiding.html
lsvalgaard says:
October 14, 2013 at 11:29 am
‘To reduce your confusion I probably should have said: “it will immediately begin to radiate…”’
Which renders your previous statement meaningless.
I’m not getting into this with you today, Leif. I have provided some contextual info for people to consider. That was my purpose, and I am done.
Bart says:
October 14, 2013 at 11:25 am
The “solar cycle” is only one component of TSI variation. Other components of longer duration have more time to integrate into something of significance.
What other components? The solar cycle itself varies with time [and with it TSI, UV, GCRs and all the rest], so what other components are there?
Hockey Schtick says:
October 14, 2013 at 11:31 am
The “sunspot time integral” and ocean oscillations explain 90-96% of observed global temperature variability
We have discussed this before. The fit uses a circular argument. Good to see that you admit there is something woolly about it by put the sunspot integral in quotes.
Bart says:
October 14, 2013 at 11:32 am
I have provided some contextual info for people to consider. That was my purpose, and I am done.
I don’t think anybody here was confused, except possibly yourself when you say that “TSI is continuously providing energy”. TSI is a measure of power [expressed as power density over 1 square meter], not of energy.
The fit uses a circular argument. Good to see that you admit there is something woolly about it by put the sunspot integral in quotes.
Don’t put words in my mouth. The only reason for the quotes is a shorthand way of referring to the accumulated departure in sunspots v. the monthly mean of 41.2 for the observational period of sunspots 1610-2009.
What do you specifically claim is a circular argument?
Hockey Schtick says:
October 14, 2013 at 2:04 pm
What do you specifically claim is a circular argument?
not ‘claim’, just telling. The fit already injects temperature dependent data. But you should know that best. Here is the sunspot integral over the time where we have reasonable data http://www.leif.org/research/SSN-Integral.png
This does not fit ‘almost perfectly’ as your link claims.
Hi I stumbled on this post and decided to address two points.
First, I saw that Overholt 2009 was mentioned as something refuting my work (together with Jan Veizer):
“It has already been shown by Overholt et al (2009) that the peaks and troughs in the Shaviv distribution do not correspond to crossings of the SA in the Galaxy. Here we show that the estimated intensity variations from the Shaviv distribution are also unrealistic”,
Well, it should be mentioned that their whole analysis has a major flaw. Instead of calculating the spiral arm passage with the relative pattern speed, they use the absolute pattern speed and don’t account for the rotation of the sun! It is that stupid! I wrote those guys, and they eventually published an erratum ( http://adsabs.harvard.edu/abs/2012ApJ…751L..45O ), but still claimed that their paper proves my analysis with Jan to be wrong. In fact they don’t because they take an unrealistically distorted spiral arm structure. They cannot admit that they are wrong to save face I guess.
The second point has to do with measuring the solar forcing. Because the climate acts as a low pass filter, the temperature response over the 11-year solar cycle is highly damped. This is why it is hard to infer a climate sensitivity from it (I didn’t appreciate this point when I wrote the sensitivity paper in 2005). However, for the same reason, the 11-year solar cycle is actually fantastic to measure the radiative forcing, because the climate system can barely respond to the varying forcing, which means that the oceans lose only a little amount of heat and they can be used as a calorimeter with a high efficiency (though not perfect). The bottom line in that analysis (from 2008) is that the solar forcing is about 1 W/m^2 over the solar cycle, not 0.17W/m^2 as satellites measure. Of course, the IPCC does not even mention this paper since it wasn’t refuted by anyone and its conclusions are very inconvenient for them…
Nir Shaviv says:
October 14, 2013 at 2:19 pm
Well, it should be mentioned that their whole analysis has a major flaw.
This is the usual porblem: everybody claims that everybody else’s analysis in flawed…
is that the solar forcing is about 1 W/m^2 over the solar cycle, not 0.17W/m^2 as satellites measure.
The author of the article heading this thread, claims 0.33 W/m2.
“This is the usual porblem: everybody claims that everybody else’s analysis in flawed…”
Well, in this case it is simple… they admitted that they are wrong and they even published an erratum!
“The author of the article heading this thread, claims 0.33 W/m2.”
If one neglects the mixing layer, one will underestimate the amount of heat that goes into the ocean and with it the forcing.
Dr. Shaviv,
We met at the Heartland conference, but you probably wouldn’t remember me. You were very gracious with your interesting explanations regarding our sun and its travels through the galaxy.
Anyway, here is an example of what is wrong with peer review. If you haven’t read it before, it seems to parallel some of the problems you’ve had.
dbstealey, great link!
p.s., I might have recognized your face… certainly not your alias. cheers.
Nir Shaviv says:
October 14, 2013 at 2:44 pm
Well, in this case it is simple… they admitted that they are wrong and they even published an erratum!
Overholt was just incidental to main issue in the paper I linked to: http://www.leif/org/EOS/1303-7314-Cosmic-Rays-Climate-billion-yrs.pdf “We have shown above that the changes in the GCR intensity as the Solar System moves from the IA to the SA of our Galaxy are of the order of 20%. These match roughly the changes in the intensity observed during the 20th century due to centennial effects and due to the 11 year solar modulation. It has been shown that changes at this level cause at most a 0.07C change in the present day mean global temperature (Erlykin et al., 2009b). Therefore, the changes in global temperature due to changes in the GCR intensity as we move from the IA to the SA are likely to be of the same magnitude. We conclude therefore that such changes cannot produce the large changes at the Ice Age epochs of the past 10^9 years as postulated by Shaviv and Veizer (2008).”
http://www.leif.org/EOS/1303-7314-Cosmic-Rays-Climate-billion-yrs.pdf
Leif, if you dig a little into their paper, you will find that they themselves have the answer. They write:
We (Rogers et al., 1988) and Bloemen et al.,(1989) presented evidence for the spectral shape of GCR depending on Galactic latitude and SA, IA intensity differences. Our own work gave a difference of spectral exponent between SA and IA of 0.4±0.2 for the Orion Arm and its neigh- bouring IA.
Clearly then if there is a small variance in the density for cosmic rays at 1 GeV (which is the average CR energy), then at an energy of 15 GeV, which is the typical energy needed to penetrate the atmosphere, the SA/IA contrast will be 15^0.4 = 3 or so. I find from meteorites that it should be larger than 2.5.
As you can see, there is no discrepancy. Their small contrast is simply at an energy which is irrelevant for the CR/climate link.
Good night. I have to wakeup early to teach
Leif Svalgaard: I say that they exist and have just the right size to explain the observed variation.
In that case, why are you claiming to be mystified by what you call an “amplification”? If the indirect effects have “just the right size” to explain that “amplification”, then why are you criticizing the “amplification”? Is it something different that they have just the right size to explain?
Matthew, the paper can be downloaded from http://www.sciencebits.com/calorimeter
lsvalgaard says:
October 14, 2013 at 2:54 pm
Thanks for the link. It looks like a good paper.
Matthew R Marler says:
October 14, 2013 at 3:10 pm
In that case, why are you claiming to be mystified by what you call an “amplification”? If the indirect effects have “just the right size” to explain that “amplification”
IMHO, no amplification is needed: the simple variation of TSI explains the 0.05-0.1C variation in temperature without the need for any mysterious ‘amplification’. And I’m not criticizing, just asking for clarification and explanation. Especially since the ‘experts’ disagree. Shaviv just said the forcing was 1 W/m2, while Robertson said 0.33 W/m2. Does that not puzzle you? And why not?
Nir Shaviv: The bottom line in that analysis (from 2008) is that the solar forcing is about 1 W/m^2 over the solar cycle, not 0.17W/m^2 as satellites measure.
A link to the paper would be welcome. I follow most links and download most available papers.
Nir Shaviv says:
October 14, 2013 at 3:18 pm
As you can see, there is no discrepancy. Their small contrast is simply at an energy which is irrelevant for the CR/climate link.
As I said: everybody claims that other’s papers are junk. BTW at 15GeV the solar cycle modulation is almost absent.
Hocky Schtick: For a start, here’s 50 papers describing potential solar amplification mechanisms
lsvalgaard: without the need for any mysterious ‘amplification’.
lsvalgaard: None of those explain how 3.6 times more heat reach the surface than the variation of what the Sun puts out…Otherwise the climate system would be a nifty energy producer: you put 10 units in and you get 36 out. I want one of those 🙂
lsvalgaard: Especially since the ‘experts’ disagree. Shaviv just said the forcing was 1 W/m2, while Robertson said 0.33 W/m2. Does that not puzzle you? And why not?
I think that the mean “forcing” can’t be estimated from the mean temperatures and other mean quantities like mean insolation and such. The insolation has different effects over land and water; some is absorbed high in the atmosphere and some is reflected. Mean radiation from the Earth surface is proportional to mean [T^4] not [mean T]^4; transport of energy from the surface to the upper troposphere includes convection of warm moist air, and that is not a simple linear function of temperature either, and is wind-dependent. (those things affect the rate of cooling of the Earth, and hence the temperature response to a change in “forcing”, which makes the mean temperature response to a given change in the amount and nature of forcing hard to estimate.)
Nir Shaviv, thank you.
lsvalgaard says: October 14, 2013 at 2:18 pm Hockey Schtick says:
October 14, 2013 at 2:04 pm
What do you specifically claim is a circular argument?
not ‘claim’, just telling. The fit already injects temperature dependent data. But you should know that best. Here is the sunspot integral over the time where we have reasonable data http://www.leif.org/research/SSN-Integral.png
This does not fit ‘almost perfectly’ as your link claims.
1. The sunspot time integral alone explains ~58% of global temperature variability. According to Leif, this means there is no evidence whatsoever of any correlation between sunspots/TSI and global temperature variability. This is before any consideration of lagged 2nd order effects, ocean thermal inertia, or ocean oscillations.
http://hockeyschtick.blogspot.com/2013/08/natural-climate-change-has-been-hiding.html
On the other hand, even if we assume CO2 changes precede & control temperature changes, CO2 only explains ~7.5% of temperature variability. Temperatures, however, lead CO2 on short, intermediate, and long-term timescales, and the cause does not follow the effect.
2. Leif claims using the PDO and AMO in a model of global temperature variability is “a circular argument” that “injects temperature dependent data.” However, “THE PDO DOES NOT REPRESENT NORTH PACIFIC SST ANOMALIES” and “THE PDO DOES NOT REPRESENT DETRENDED NORTH PACIFIC SST ANOMALIES” and “THE PDO DOES NOT REPRESENT VARIATIONS IN THE DELTA T BETWEEN NORTH PACIFIC SST AND GLOBAL TEMPERATURES”
http://wattsupwiththat.com/2009/04/28/misunderstandings-about-the-pacific-decadal-oscillation/
“SO WHAT DOES THE PDO DESCRIBE? The PDO represents a pattern of SST anomalies in the North Pacific. The operative word in that sentence is PATTERN.” – Bob Tisdale
Therefore, use of the sunspot time integral and the PDO & AMO temperature PATTERNs [which are not absolute SST changes] in a model is not based upon a circular argument.
On the other hand, IPCC climate models are based upon the circular argument that CO2 is the “control knob” of global temperature.
Hockey Schtick says:
October 14, 2013 at 4:18 pm
1. The sunspot time integral alone explains ~58% of global temperature variability.
No, it does not ‘explain’ anything. There is a correlation, but not necessary causation. The price of a U.S. postage stamp or the number of pirates also correlates with global warming, but does not explain GW.
2. Leif claims using the PDO and AMO in a model of global temperature variability is “a circular argument” that “injects temperature dependent data.” … The PDO represents a pattern of SST anomalies in the North Pacific.
This is where the circular argument comes in.
On the other hand, IPCC climate models are based upon the circular argument that CO2 is the “control knob” of global temperature.
That somebody else may be wrong does not mean that you are correct.
For the life of me I mistakenly assumed this was Dr. Robertson’s article and thread. Now where did I go so wrong? 😉
lsvalgaard says: October 14, 2013 at 4:25 pm
Hockey Schtick says: October 14, 2013 at 4:18 pm
1. The sunspot time integral alone explains ~58% of global temperature variability.
No, it does not ‘explain’ anything. There is a correlation, but not necessary causation. The price of a U.S. postage stamp or the number of pirates also correlates with global warming, but does not explain GW.
Some progress, at least, in that Leif admits that “There is a correlation, but not necessary causation” between the sunspot time integral and global temperature variability. Sure, even if the correlation was 97% or 100%, Leif could still say the same thing. At least for the Sun, the only significant source of energy to the Earth surface, there are multiple reasons supporting such a causal relationship, unlike for stamps and pirates. Don’t you understand the difference?
Likewise, there is a correlation between solar activity and sunspots, “but not necessarily causation”
The PDO represents a pattern of SST anomalies in the North Pacific.
This is where the circular argument comes in.
That would be true if the PDO represented mean SST anomalies in the North Pacific, but it clearly does not as shown by Bob Tisdale; it represents a PATTERN of cooling in one region vs. warming in another, not mean SST anomalies, and therefore Leif’s claim of a circular argument is incorrect.
Hockey Schtick says:
October 14, 2013 at 5:21 pm
Some progress, at least, in that Leif admits that “There is a correlation, but not necessary causation” between the sunspot time integral and global temperature variability.
A sure sign of a spurious correlation is that the correlation breaks down outside the cherry-picked interval it is first based on. Your particular correlation breaks down if you take it back in time, e.g. to 1850 or 1750.
Likewise, there is a correlation between solar activity and sunspots, “but not necessarily causation”
You are spouting nonsense as sunspots are solar activity.
That would be true if the PDO represented mean SST anomalies in the North Pacific, but it clearly does not as shown by Bob Tisdale; it represents a PATTERN of cooling in one region vs. warming in another, not mean SST anomalies, and therefore Leif’s claim of a circular argument is incorrect.
You impose a wave pattern on the correlation in the sense that PDO is positive for some time, then negative for some time. People claim that temperatures now are lower because we are in the negative phase of PDO, so there is the relation with temperature. As I recall from your detailed ‘analysis’ the solar cycle integral was a VERY minor constituent of the relation. So the end result is a long term trend with an imposed sine wave, that is the circular argument.
A sure sign of a spurious correlation is that the correlation breaks down outside the cherry-picked interval it is first based on. Your particular correlation breaks down if you take it back in time, e.g. to 1850 or 1750.
The ~58% correlation of the sunspot time integral to global temperatures IS FROM 1850.
http://hockeyschtick.blogspot.com/2013/08/natural-climate-change-has-been-hiding.html
So, your claim of cherry-picking is false. The HADCRU global temperature record only goes back to 1850, and the early data is quite sparse, based upon the crude thermometers available, and has been repeatedly adjusted to cool the past and warm the present. Even after all of that, and without considering any 2nd order or lagged effects or ocean oscillations, the correlation is still ~58%.
Likewise, there is a correlation between solar activity and sunspots, “but not necessarily causation” You are spouting nonsense as sunspots are solar activity.
That was simply in response to your nonsense conflating correlation between postage stamps as analogous to solar activity & GW. Sunspots are one manifestation of solar activity, and the causal relationship and proposed mechanisms postulated on the basis of the correlations first found.
As I recall from your detailed ‘analysis’ the solar cycle integral was a VERY minor constituent of the relation. So the end result is a long term trend with an imposed sine wave, that is the circular argument.
No, not true, as has already been pointed out several times above. The sunspot integral explains the majority [~58%] of the observed global temperature variation since the beginning of the record in 1850.
Hello Nir,
I met Jan Veizer at U of Ottawa, introduced by Tim Patterson, circa 2002 and prior to publication of Shaviv and Veizer GSA2003.
I liked your paper then and I still like it now.
I recall some negative screed in EOS circa 2003 that was very upsetting to Jan. I wrote about this in E&E.
I do not know if you have an opinion on this question, but if you do I would very much like to hear your thoughts .
Do you have an estimate as to whether average global temperatures will be warmer, cooler or about the same as today circa 2020-2030, and if so by how much?
Leif says about the same temperature as today and I say cooler, but I’m not sure how much.
Thanks and regards, Allan
Hockey Schtick says:
October 14, 2013 at 7:03 pm
The ~58% correlation of the sunspot time integral to global temperatures IS FROM 1850.
http://hockeyschtick.blogspot.com/2013/08/natural-climate-change-has-been-hiding.html
This is what the integral looks like: http://www.leif.org/research/SSN-Integral.png
Hockey Schtick says:
October 14, 2013 at 7:03 pm
The ~58% correlation of the sunspot time integral to global temperatures IS FROM 1850.
Here is the integral over the past 2000 years [derived from cosmic rays] compared to the average of Temperature Anomalies from Moberg and Loehle: http://www.leif.org/research/Solar-Activity-Integral-and-Temp.png
Here is the integral over the past 2000 years [derived from cosmic rays] compared to the average of Temperature Anomalies from Moberg and Loehle
What is the specific data source/proxy you are using for cosmic rays? From what location(s)? Why did you choose that particular proxy?
Hockey Schtick says:
October 15, 2013 at 10:02 am
What is the specific data source/proxy you are using for cosmic rays? From what location(s)? Why did you choose that particular proxy?
http://onlinelibrary.wiley.com/doi/10.1029/2009JA014193/abstract
Until their revised values come out later this year, this is the best there is covering such a long interval. The cosmic ray intensity has been converted to equivalent heliospheric magnetic field which is also a good proxy for the sunspot number [or rather for ‘real’ solar activity – independent of the counting problems there may be with the sunspot number].
Leif wrote: “As I said: everybody claims that other’s papers are junk. BTW at 15GeV the solar cycle modulation is almost absent.”
a. You said the word junk, not me, and in fact, you mean it and I don’t. I just pointed to a fact that was in THEIR paper which implies that their paper is totally consistent with the picture I am saying, once one realizes that they are not talking at the relevant energies. Suddenly when it doesn’t sit with your world view, you disregard it.
b. The solar modulation at 15 GeV is of order 10%, it is certainly NOT absent. Although the variations at 1GeV are much larger, they are irrelevant for the troposphere because those CRs and their secondaries cannot penetrate deep into the atmosphere.
The more recent work by the same authors [with additional authors] is linked here and shows solar activity in the latter half of the 20th century was at the highest levels of the past 9,000 years. In addition, the paper concludes “generally the agreement between solar forcing and Asian climate is good,” so glad to hear you agree “this is the best there is covering such a long interval.”
http://hockeyschtick.blogspot.com/2013/01/paper-finds-solar-activity-at-end-of.html
Hockey Schtick says:
October 15, 2013 at 12:59 pm
The more recent work by the same authors [with additional authors] is linked here and shows solar activity in the latter half of the 20th century was at the highest levels of the past 9,000 years.
The main authors are members of my team to re-evaluate solar activity and the preliminary conclusion [being written up as we speak] is that the earlier [although recent] paper was faulty in this regard. You can learn more by consulting the discussion of Figures 9 and 10 in http://www.leif.org/research/swsc130003p.pdf and http://www.leif.org/research/Svalgaard_ISSI_Proposal_Base.pdf
Apart from such inconsistencies, the overall accuracy is satisfactory and good enough for integration. And your quote “agreement between solar forcing and Asian climate is good” is curious because of the restriction to Asian [and not global] climate; in addition the cosmic ray record is contaminated by climate itself, so some of the minor wiggles are just circular.
Some of the same authors are also co-authors of http://www.leif.org/EOS/2009GL038004-Berggren.pdf : “A comparison with sunspot and neutron records confirms that ice core 10Be reflects solar Schwabe cycle variations, and continued 10Be variability suggests cyclic solar activity throughout the Maunder and Spoerer grand solar activity minima. Recent 10Be values are low; however, they do not indicate unusually high recent solar activity compared to the last 600 years”
I would be glad if you would keep up with the literature instead of cherry-picking what you like.
Hockey Schtick says:
October 15, 2013 at 12:59 pm
the paper concludes “generally the agreement between solar forcing and Asian climate is good,”
You misquote the paper. The statement is “Though generally the agreement between solar forcing and Asian climate is good, there are also periods without any coherence, pointing to other forcings like volcanoes and greenhouse gases and their corresponding feedbacks.” It seems you must agree with that as you take the paper as support for your ideas.
Nir Shaviv says:
October 15, 2013 at 1:14 pm
The solar modulation at 15 GeV is of order 10%, it is certainly NOT absent.
I think that is an overestimate. In any event it is too small to have any significant effect.
So, you are saying the 2010 paper is faulty rather than the 2012 paper, or both?
The problem you have with it is the “deep excursions” to zero or negative? If so, that is irrelevant to discussion of the higher values, and once again, the data shows an increase of solar activity over the past ~500 years to some of the highest levels of the past 9000 years.
And your quote “agreement between solar forcing and Asian climate is good” is curious because of the restriction to Asian [and not global] climate
Obviously, the authors wrote that because they compared the solar record to an Asian speleothem climate proxy. Obviously, the authors cannot comment on global climate because they didn’t obtain multiple climate proxies from around the globe for comparison.
“Recent 10Be values are low; however, they do not indicate unusually high recent solar activity compared to the last 600 years”
Well, in fact figure 1 in that paper shows 10Be values at the end of the record are indeed low and at some of the lowest levels of the last 600 years, therefore the above statement is a non-sequitur or at least misleading.
It appears Dr. S. that you are the one doing the cherry-picking, neglecting to mention the more comprehensive 2012 paper, claiming the 2010 paper from those authors is the most recent until an update is published, citing a 2009 paper that only has data from one site instead of the 2012 paper, and contains a quote which contradicts the data published within the same paper, etc. etc.
milodonharlani says:
October 11, 2013 at 2:06 pm
lsvalgaard says:
October 11, 2013 at 12:50 pm
Thanks. That’s a good hypothesis. I’ve corresponded with Dr. Clark regarding Heinrich Events.
However it remains to be shown what might cause variability of the AMOC, which could be comparable to the oceanic drivers of Bond Cycles referred to above.
—————————————–
This paper from way back in 2004 shows ENSO associated with D-O cycles in the North Atlantic record. If teleconnections exist between Pacific circulation & the AMOC, that could help answer the question I posed about what drives or affects the latter in producing the results your cited paper found, ie the impact of the AMOC on sea & land ice:
http://www.nature.com/nature/journal/v428/n6980/abs/nature02386.html
The El Niño/Southern Oscillation (ENSO) phenomenon is believed to have operated continuously over the last glacial–interglacial cycle1. ENSO variability has been suggested to be linked to millennial-scale oscillations in North Atlantic climate during that time2, 3, but the proposals disagree on whether increased frequency of El Niño events, the warm phase of ENSO, was linked to North Atlantic warm or cold periods. Here we present a high-resolution record of surface moisture, based on the degree of peat humification and the ratio of sedges to grass, from northern Queensland, Australia, covering the past 45,000 yr. We observe millennial-scale dry periods, indicating periods of frequent El Niño events (summer precipitation declines in El Niño years in northeastern Australia). We find that these dry periods are correlated to the Dansgaard–Oeschger events—millennial-scale warm events in the North Atlantic climate record—although no direct atmospheric connection from the North Atlantic to our site can be invoked. Additionally, we find climatic cycles at a semiprecessional timescale (approx11,900 yr). We suggest that climate variations in the tropical Pacific Ocean on millennial as well as orbital timescales, which determined precipitation in northeastern Australia, also exerted an influence on North Atlantic climate through atmospheric and oceanic teleconnections.
Hockey Schtick says:
October 15, 2013 at 2:45 pm
So, you are saying the 2010 paper is faulty rather than the 2012 paper, or both?
I’m saying that the whole issue is under vigorous investigation at the moment and the preliminary conclusion is that solar activity in the 20th century was not the highest in the past 10,000 years. Activity in the 18th century was just as high, and in the 19th almost as high. And the cosmic ray record has many excursions just as high [actually ‘low’ because of the inverse correlation]. I grant that the cosmic ray people are thrashing around on this issue, but they are in the process of cleaning up their act.
But whether is were is irrelevant for the lack of correlation between the integral of solar activity and the temperature anomalies.
You misquote the paper. The statement is “Though generally the agreement between solar forcing and Asian climate is good, there are also periods without any coherence, pointing to other forcings like volcanoes and greenhouse gases and their corresponding feedbacks.” It seems you must agree with that as you take the paper as support for your ideas.
I did not misquote the paper by quoting the main point i.e. “generally the agreement between solar forcing and Asian climate is good,” which remains true even if there are a minority of periods without any coherence. Hand-waving explanations for the minority of periods without coherence are suggested, but have not been investigated by this paper and thus are mere speculation. They could have also added ocean & atmospheric oscillations to the list of possible explanations.
I’m saying that the whole issue is under vigorous investigation at the moment and the preliminary conclusion is that solar activity in the 20th century was not the highest in the past 10,000 years. Activity in the 18th century was just as high, and in the 19th almost as high.
Where is the data supporting this assertion [besides your own sunspot re-count]? The data in the 2009, 2010, 2012 papers cited above, as well as others, do not support your assertion that “Activity in the 18th century was just as high, and in the 19th almost as high.”
Hockey Schtick says:
October 15, 2013 at 3:28 pm
I did not misquote the paper by quoting the main point i.e. “generally the agreement between solar forcing and Asian climate is good,”
You left out the caveat “Although” that counts as a misquote in my book.
Where is the data supporting this assertion [besides your own sunspot re-count]? The data in the 2009, 2010, 2012 papers cited above, as well as others, do not
You did not take the trouble to read my link http://www.leif.org/research/Svalgaard_ISSI_Proposal_Base.pdf
If you had you might have seen Figure 2 that shows Steinhilber’s reconstructions [purple, green, black] compared to ours [red] and the some of the papers claiming the ‘biggest in 10,000 years’ thing [orange].
If you actually READ the link [and note the team members] you will see that the workshop was approved [and is now concluded]. The result is a revision of the cosmic ray data that resolves the discrepancy and removes the notion of the huge 20th century grand maximum [that never was]. Because this result is at variance with cherished ideas [including yours] it is only natural that there will be rear-guard action to preserve the old, obsolete, and faulty notions. You are in good company.
Is the adjusted data from the workshop available & do you have a chart showing the “integral” of the adjusted data?
Hockey Schtick says:
October 15, 2013 at 4:28 pm
Is the adjusted data from the workshop available & do you have a chart showing the “integral” of the adjusted data?
The data is still under embargo [sorry] until the final report is published [later this year, we hope], and I don’t have a chart. However, most of the changes are to recent data [the past 400 years], and will only have little impact. You can get a feeling for the data from Figure 23 of http://www.leif.org/research/Reflections-on-IDV.pdf there is still some issue with volcanic influence on the cosmic ray counts, but it is being worked on.
Thanks for providing Fig 23, engaging in this discussion, and I look forward to the publication of the paper & data.
However, it’s doubtful that your sunspot data or cosmic ray data would substantially change the correlation of the solar activity “integral” to the global temperature anomaly since the beginning of the record in 1850. [i.e. substantially different from the ~58% correlation in the link I posted above]
Further, some of your co-authors have already stated in the 2012 paper that there is “generally” a “good” correlation between solar activity and Asian climate over the past several millenia. Asian climate also shows a very good correlation to other climate proxies worldwide. I’m well aware you reject the notion that solar activity changes have any significant effect on climate, so perhaps you can hash that out with your co-authors on the new paper. Regards
Hockey Schtick says:
October 15, 2013 at 7:10 pm
I’m well aware you reject the notion that solar activity changes have any significant effect on climate
No, you have that a bit wrong. I don’t ‘reject’ or ‘dismiss’ anything, but I have not been convinced by the meager evidence and lack of plausible mechanism that the Sun is a major driver, even though I in the past was leaning towards a solar influence, e.g. http://www.sciencemag.org/content/180/4082/185.short
so perhaps you can hash that out with your co-authors on the new paper
Part of the resolution of the puzzle might be that the climate is [at least partially – some claim more than half] responsible for some of the long-term variations of the observed concentration of radionuclides, e.g. .http://arxiv.org/abs/1003.4989 and http://arxiv.org/abs/1004.2675
lsvalgaard says:
October 14, 2013 at 7:11 am
“if all the Sun is doing is 0.05C then the Sun is not a major driver of climate, which is really what this whole debate is about.”
doing 0.05C where? – they speak about antiphase forcing at “surface”.
I didn’t mean antiphase forcing, I mentioned it, but that’s misunderstanding that I somehow implied it as sole cause of the above 0.04-0.05C SST amplitude, what I was talking about was UV forcing, which is strongly in-phase. And anyway it would be just one small of more much larger contributors to deconstruct the above analysis top to bottom – the pert absolute omission of latent heat transfer, nonsensical radiative transfer figures – the 390W/m^2 for 288K – LoL – result of thinking perhaps the ocean is more than perfect laboratory blackbody, or it doesn’t matter if it isn’t, perpetuated by endemic groupthink dilettantism in climatology, or the 160W/m^2 irradiation of ocean of which more than half is under 30° latitude, one would wonder where the people get such stuff, but unfortunately the hausfigures are repeated everywhere and nobody bothers with reality check …and when I pointed out the nonsenses suddenly it is a “collection of facts” and nobody cares to put the 1+1 together…
But to the point: It seems that you confuse two quite different relations:
A.* The relation between the solar cycle signal (quasi-periodic, asymmetric) magnitude and the SST amplitude – an intermittent change in SST which in principle gets completely canceled* by the heat dissipation rate change caused by the changed SST – through radiative heat transfer and latent heat transfer, convection…
AND
B. The relation between the solar irradiation trend longer than one cycle and the surface heat content trend, which in principle is not canceled and lasts until the solar irradiation trend direction (upward or downward) lasts and in principle results in persistently rising SST trend so long until the solar irradiation trend direction (upward or downward) persists***.
——–
* more or less the relation of “0.09”W/m^2 (– which I think is grossly underestimated) and not more than 0.04-0.05C SST amplitude the above article is about
** if there’s no solar irradiation trend longer than the solar cycle – due to asymmetric nature of solar cycle signal a linear trend through one cycle is usually downward which leaves more time for the accumulated heat to dissipate.
*** it is not completely simple to tell exactly when the solar irradiation trend direction overturns, (PMOD guys for example claim it overturned 26years ago…so clearly it is not simple 😉 because it is periodically obscured by the solar cycle steep and asymmetric up and down periodicity.
But under the assumption the SSN closely relates to the solar activity and irradiation changes (that’s you who emphasizes the evolution of sunspots into faculae resulting in brightening) I’m able to tell it from the SSN monthly data with less than 1 year exactness and tell you the likely chief and definitely significant cause why there was the recent warming since the 1970s and also why it is not there anymore since beginning of 2000’s – the whole story is more or less told by this graph
(Because you emphasize, there is the needed correction of the SIDC-SSN data before 1947 and although it has nothing to do with the recent warming, I made unanimated though, but using corrected SSN data version of my “wiggle” graph – which uses original, uncorrected SIDC-SSN data). What I changed was, that I didn’t use the tail value of the trends, which are meaningless, but their center value – which is not completely surprisingly equivalent of SSN integral development in time normalized to the data average and scale. The result is just approximation and maybe even a bit underestimated, because the OLS method is not perfect. The step is half of the solar cycle, resulting values exactly centered to cycle minima and maxima – which are the ends of the particular regressions.
– you can see on both (one derived by 75+ years regressions from monthly data!), that the solar activity trend clearly rose significantly since quite exactly the mid-1970’s – and well into the 2000’s
– to confirm it there is the yellow line – the simple 1964.8-2006.13 linear trend (I’ve chosen for sake of demonstration – because it is almost 42 years long and quite telling) is almost perfectly flat – which means the end of the trend-line is the point where the SSN trend since the 1964 solar minimum overturned and it was not sooner than in February 2006! Mind that the line also – at the same time marks the average SSN in the period 1964.8-2006.13 and compare it to the light blue thin line – marking the 1890-2013 SSN average – which is another confirmation. -one simple yellow line with one blue and both prima facie falsify Lockwood&Fröhlich07…
-To help see the relation I plotted the average line (the light blue) of the whole period – average SSN 1890.22-2013.72 and 1964.8-2013.72 are surprisingly both 61.92 – which is nothing I planned or somehow arranged – it just came out by itself and it means the 1890.22-2013.72 SSN trend is also flat – at least with the corrected SSN data using your suggestions.
– In my opinion the change of absolute heat content (which directly and only determines the temperatures) in the whole climatic system from bottom of the ocean mixed zone to top of the atmosphere during a period is determined not by TSI itself, but by surplus TSI integral over average for same period and the signal decay rate say in ocean would be likely related to the length of the rising trend (and although the above article suggest quite fast heat diffusion in ocean, the heat can’t disappear, nor traverse the thermocline in most of the ocean, simply because basic physics doesn§t allow anything like that, so sooner or later it intervenes), also the relation between heat content and temperature is not completely trivial because one must calculate it using absolute temperature – which is not the case of the surface temperature anomalies – so just the simple correlation of SST with TSI in principle never can work well – although it still works better than attempts to correlate the SST with the atmospheric CO2 content..
I don’t have empirical TSI for whole the period, so I tested the method with SSN. It looks like it works fine. Used data and calculations are of course available and suggestions welcome.
lsvalgaard says:
October 14, 2013 at 7:11 am
“if all the Sun is doing is 0.05C then the Sun is not a major driver of climate, which is really what this whole debate is about.”
doing 0.05C where? – they speak about antiphase forcing at “surface”.
I didn’t mean antiphase forcing, I mentioned it, but that’s misunderstanding that I somehow implied it as sole cause of the above 0.04-0.05C SST amplitude, what I was talking about was UV forcing, which is strongly in-phase. And anyway it would be just one small of more much larger contributors to deconstruct the above analysis – the pert absolute omission of latent heat transfer, weird radiative transfer figures – the 390W/m^2 for 288K – LoL – result of thinking perhaps the ocean is more than perfect laboratory blackbody, or it doesn’t matter if it isn’t, perpetuated by endemic groupthink dilettantism in climatology, or the 160W/m^2 irradiation of ocean of which more than half is under 30° latitude, one would wonder where the people get such stuff, but unfortunately the hausfigures are repeated everywhere and nobody bothers with reality check …and when I pointed out the nonsenses suddenly it is a “collection of facts” and nobody cares to put the 1+1 together…
But to the point: It seems that you confuse two quite different relations:
A.* The relation between the solar cycle signal (quasi-periodic, asymmetric) magnitude and the SST amplitude – an intermittent change in SST which in principle gets completely canceled* by the heat dissipation rate change caused by the changed SST – through radiative heat transfer and latent heat transfer, convection…
AND
B. The relation between the solar irradiation trend longer than one cycle and the surface heat content trend, which in principle is not canceled and lasts until the solar irradiation trend direction (upward or downward) lasts and in principle results in persistently rising SST trend so long until the solar irradiation trend direction (upward or downward) persists***.
——–
* more or less the relation of “0.09”W/m^2 (– which I think is grossly underestimated) and not more than 0.04-0.05C SST amplitude the above article is about
** if there’s no solar irradiation trend longer than the solar cycle – due to asymmetric nature of solar cycle signal a linear trend through one cycle is usually downward which leaves more time for the accumulated heat to dissipate.
*** it is not completely simple to tell exactly when the solar irradiation trend direction overturns, (PMOD guys for example claim it overturned 26years ago…so clearly it is not simple 😉 because it is periodically obscured by the solar cycle steep and asymmetric up and down periodicity.
But under the assumption the SSN closely relates to the solar activity and irradiation changes (that’s you who emphasizes the evolution of sunspots into faculae resulting in brightening) I’m able to tell it from the SSN monthly data with less than 1 year exactness and tell you the likely chief and definitely significant cause why there was the recent warming since the 1970s and also why it is not there anymore since beginning of 2000’s – the whole story is more or less told by this graph
(Because you emphasize, there is the needed correction of the SIDC-SSN data before 1947 and although it has nothing to do with the recent warming, I made unanimated though, but using corrected SSN data version of my “wiggle” graph – which uses original, uncorrected SIDC-SSN data). What I changed was, that I didn’t use the tail value of the trends, which are meaningless, but their center value – which is not completely surprisingly equivalent of SSN integral development in time normalized to the data average and scale. The result is just approximation and maybe even a bit underestimated, because the OLS method is not perfect. The step is half of the solar cycle, resulting values exactly centered to cycle minima and maxima – which are the ends of the particular regressions.
– you can see on both (one derived by 75+ years regressions from monthly data!), that the solar activity trend clearly rose significantly since quite exactly the mid-1970’s – and well into the 2000’s
– to confirm it there is the yellow line – the simple 1964.8-2006.13 linear trend (I’ve chosen for sake of demonstration – because it is almost 42 years long and quite telling) is almost perfectly flat – which means the end of the trend-line is the point where the SSN trend since the 1964 solar minimum overturned and it was not sooner than in February 2006! Mind that the line also – at the same time marks the average SSN in the period 1964.8-2006.13 and compare it to the light blue thin line – marking the 1890-2013 SSN average – which is another confirmation. -one simple yellow line with one blue and both prima facie falsify Lockwood&Fröhlich07…
-To help see the relation I plotted the average line (the light blue) of the whole period – average SSN 1890.22-2013.72 and 1964.8-2013.72 are surprisingly both 61.92 – which is nothing I planned or somehow arranged – it just came out by itself and it means the 1890.22-2013.72 SSN trend is also flat – at least with the corrected SSN data using your suggestions.
– In my opinion the change of absolute heat content (which directly and only determines the temperatures) in the whole climatic system from bottom of the ocean mixed zone to top of the atmosphere during a period is determined not by TSI itself, but by surplus TSI integral over average for same period and the signal decay rate say in ocean would be likely related to the length of the rising trend (and although the above article suggest quite fast heat diffusion in ocean, the heat can’t disappear, nor traverse the thermocline in most of the ocean, simply because basic physics doesn§t allow anything like that, so sooner or later it intervenes), also the relation between heat content and temperature is not completely trivial because one must calculate it using absolute temperature – which is not the case of the surface temperature anomalies – so just the simple correlation of SST with TSI in principle never can work well – although it still works better than attempts to correlate the SST with the atmospheric CO2 content..
I don’t have empirical TSI for whole the period, so I tested the method with SSN. It looks like it works fine. Used data and calculations are of course available and suggestions welcome.
tumetuestumefaisdubien1 says:
October 15, 2013 at 9:55 pm
I didn’t mean antiphase forcing, I mentioned it, but that’s misunderstanding that I somehow implied it as sole cause of the above 0.04-0.05C SST amplitude, what I was talking about was UV forcing, which is strongly in-phase.
There is a suggestion [by Jerry Harder] that the SSI measured by SORCE shows that UV and Visible varies in anti-phase, so when UV goes up, Visible goes down by the same amount such as to keep TSI almost constant, see Slide 11 of http://lasp.colorado.edu/sorce/news/2011ScienceMeeting/docs/presentations/6b_Cahalan_Sedona_9-15-2011.pdf
Either with or without that assumption, the solar influence on temperatures at the surface and the sea temperatures at several depths are of the order of 0.05C.
But to the point: It seems that you confuse two quite different relations:
A.* The relation between the solar cycle signal (quasi-periodic, asymmetric) magnitude and the SST amplitude …
B. The relation between the solar irradiation trend longer than one cycle and the surface heat content trend,…
As there has been no upward trend in solar activity the last 300 years it would seen that only A comes into play.
lsvalgaard says:
October 16, 2013 at 3:55 am
As there has been no upward trend in solar activity [and neither in UV] the last 300 years it would seen that only A comes into play.
I forgot to link to the evidence for that. Here it is:
http://www.leif.org/research/The%20long-term%20variation%20of%20solar%20activity.pdf
Especially slides 31 and 37.
lsvalgaard says:
October 16, 2013 at 3:55 am
There is a suggestion [by Jerry Harder] that the SSI measured by SORCE shows that UV and Visible varies in anti-phase, so when UV goes up, Visible goes down by the same amount such as to keep TSI almost constant
Yeah, I know.
There’s just the little petty problem for the above analysis, that Ermolli et al question reliability of the antiphase effect in visible and anyway it doesn’t even much matter whether they’re right or not – the >5 mW/nm variability in UVA, which would put together nice >0.425W/m^2 variability, which – although maybe ofsetted by the 1+ micrometer IR in TOA TSI, would not look so well after passing atmosphere, after which still will persist at least third of the 0.425 figure, 95+% from it get into the ocean, to orders of magnitude higher depths than the >1micrometer IR, or more exactly what left from it, and mix up not only the surface layer, but also the Robertson’s diffusivity figures and in any case the 0.09W/m^2 figure – already quite untenable due to absolute omission of the ocean geographic stratification and reflectivity making the 160W/m^2 figure untenable straight away.
So yes, you’re maybe right with the antiphase offseting of TSI, and surely I didn’t claimed anything else, but it somehow doesn’t help the above article about SST amplitude dependence on the solar cycle magnitude enough.
Concerning the seeming only A comes to play even stated in direct context of the claim “there has been no upward trend in solar activity the last 300 years” I must say that despite I’m not much a fan of modern grand maximum thesis and I never use the SSN data without the correction you suggested to me, I don’t even see there any data for 300 years on the slide 31 and the slide 37 the graph beggins 1750.
And anyway contrary to what you claim what I see at the graph there is SSN ~+4.5/per century trend throughout the whole 1750-2000 period, at least +15/century for 1800-2000 and at least +35 for 1900-2000 and what I remember about the SSN data before 1750 the 300 years 1700-2000 trend would be >5/century and even considerably higher it would be if going before 1700. And in any case I also don’t remember nothing to the sense there would be only one solar cycle since 1713. Of course my eyes and memory can deceive me, but anyway I have strong feeling that they don’t and that this your 300 years no secular trend(s) claim in context of the implicite seeming/claim that B doesn’t come to play is so far the most ridiculous take I’ve heard from you. Are you OK? I’m bit worried.
ok, I maybe overstated it, sometimes I use the SIDC-SSN data without correction at the WFT if I just need quick check and it is about short period in 2nd half of 20th century, but I always bear in mind that the data need correction and because it is nonpractical to correct the data after 1947, so I do before.
tumetuestumefaisdubien1 says:
October 16, 2013 at 10:45 am
and at least +35 for 1900-2000
And at least +180 for 1954-1958…
Allan MacRae says: October 12, 2013 at 11:25 am
I suggest cooling COULD be similar to the Dalton Minimum, which coincided with an average 1 degree C decline in global average temperature and caused significant human suffering.
BUT the Dalton also included the Tambora eruption in 1815, one of the largest volcanoes in the past 2000 years. The year 1816 was called The Year Without a Summer.
lsvalgaard says: October 12, 2013 at 11:33 am
Helped along with the eruption of Mayon in 1814 and another [unnamed] volcano erupting in 1809.
Obviously, I don’t predict a 1C decline [barring similar volcanic eruptions]
Allan says:
OK Leif – that`s why I mentioned Tambora. let’s find some common ground here – we both agree on LESS than 1C of cooling :–}
[Actually, you say no significant temperature change]
But Napoleon’s’ Grande Armée froze to and from Moscow in 1812 – clearly the French had a remarkable and prescient sensitivity to future global cooling events – or was it that un-named 1809 volcano thingy?
By the way, Tambora blew its stack on 10 April 1815, just two months before Napoleon lost for the last time at Waterloo on 18 June 1815. Coincidence? I think NOT!! :–}
____________________
Royal Highness,
Exposed to the factions which divide my country, and to the enmity of the great Powers of Europe, I have terminated my political career; and I come, like Themistocles, to throw myself upon the hospitality (m’asseoir sur le foyer) of the British people. I claim from your Royal Highness the protections of the laws, and throw myself upon the most powerful, the most constant, and the most generous of my enemies.
—Napoleon (letter of surrender to the Prince Regent – translation)
Allan MacRae says:
October 17, 2013 at 8:58 am
I suggest cooling COULD be similar to the Dalton Minimum
And I COULD win the lottery tomorrow.
COULD is not a valid prediction.
But Napoleon’s’ Grande Armée froze to and from Moscow in 1812
And Hitler has similar trouble in 1942. Russian winters can be harsh. But clearly the Russians didn’t die from the cold. It is all a question about proper preparation and logistics, not the weather. And I think the ‘to’ is not correct.
By the way, Tambora blew its stack on 10 April 1815, just two months before Napoleon lost for the last time at Waterloo on 18 June 1815. Coincidence? I think NOT!! :–}
We have different bars on what constitutes coincidence. Yours may be set too low.
Joke Leif!
Joke!
Smile – your face will not break.
:-}
Allan MacRae says:
October 17, 2013 at 10:00 am
Joke!
Many comments on WUWT are such that it is hard to tell the difference…
Better not to act as a comedian and stick to science.
Lighten up my friend, you are a barrel of Leifs! :-}
Re your crusty comment “Better not to act as a comedian and stick to science”:
We’ve already sorted out much of the science; just waiting for the rest of you to catch up. Bada-boom!! :-}
2002
[PEGG, reprinted at their request by several other professional journals , the Globe and Mail and la Presse in translation]
http://www.apegga.org/Members/Publications/peggs/WEB11_02/kyoto_pt.htm
On global warming:
“Climate science does not support the theory of catastrophic human-made global warming – the alleged warming crisis does not exist.”
On green energy:
“The ultimate agenda of pro-Kyoto advocates is to eliminate fossil fuels, but this would result in a catastrophic shortfall in global energy supply – the wasteful, inefficient energy solutions proposed by Kyoto advocates simply cannot replace fossil fuels.”
2002
[Calgary Herald, September 1, 2002, based on a phone conversation with Paleoclimatologist Dr. Tim Patterson]
On global cooling:
“If (as I believe) solar activity is the main driver of surface temperature rather than CO2, we should begin the next cooling period by 2020 to 2030.”
2008
http://icecap.us/index.php/go/joes-blog/carbon_dioxide_in_not_the_primary_cause_of_global_warming_the_future_can_no/
On falsifying the CAGW hypothesis:
The rate of change dCO2/dt varies ~contemporaneously with temperature.
Atmospheric CO2 lags temperature at all measured time scales. CO2 does not drive temperature; temperature drives CO2.
**********
Enjoy your weekend Leif.
Best personal regards, Allan
On the ECS Mainstream Debate
http://wattsupwiththat.com/2013/10/10/the-sun-does-it-now-go-figure-out-how/#comment-1445683
[excerpt]
“Since CO2 clearly LAGS temperature at all measured time scales, this ECS mainstream debate requires that, in total, “the future is causing the past”, which I suggest is demonstrably false…
… In summary, in climate science we do not even agree on what drives what, and it is probable that the majority, who reside on BOTH sides of the ECS mainstream debate, are BOTH WRONG.”
Regards to all, Allan
Epilogue
And all our yesterdays have lighted fools
The way to dusty death. Out, out, brief candle!
Life’s but a walking shadow, a poor player
That struts and frets his hour upon the stage
And then is heard no more. It is a tale
Told by an idiot, full of sound and fury,
Signifying nothing.
Nir Shaviv says:
October 14, 2013 at 2:44 pm
. . .“The author of the article heading this thread, claims 0.33 W/m2.”
If one neglects the mixing layer, one will underestimate the amount of heat that goes into the ocean and with it the forcing.
—————————————–
I do not believe that the neglect of the mixing layer is a problem because the ocean heat content calculation constrained the diffusivity. There are three ways our results differ. One, that regrettably confused some, seems to be that my 0.33 w/m^2 was an amplitude, not a peak to trough variation. A second is that for the purpose of a blog article, I obviously did not take the care that you did. Third, I produced a deliberate minimal estimate by not going into detail about the roles of evaporation, convection and downwelling thermal infrared at the surface. That is the main difference between our results. Evaporation and convection remove heat and thus it will require more than my estimate to produce the observed temperature variations, however, this is also partially compensated by using the same approximation on the ocean heat content data. I was hoping that a clean minimal estimate that was much larger than TSI variations that reach the surface would persuade Leif to take a hard look at calorimetry. Doesn’t seem to have worked.
Stan
bones says:
October 21, 2013 at 3:16 pm
I was hoping that a clean minimal estimate that was much larger than TSI variations that reach the surface would persuade Leif to take a hard look at calorimetry. Doesn’t seem to have worked.It was hard cutting though to the beef. My take-home-message was that you were trying to explain a 0.05 C solar-cycle variation of the Sea Surface Temperature. IMHO the variation of TSI is sufficient for that.
Glad to know that it is an opinion and not based on anything as well established as calorimetry.
I might also add that if you are OK with 0.05 C rather than the 0.04 C that I used for a minimal estimate, it pushes the requirement up to 0.41 watt/m^2.
bones says:
October 21, 2013 at 6:35 pm
Glad to know that it is an opinion and not based on anything as well established as calorimetry.
Snide comments are not helpful.
bones says:
October 21, 2013 at 6:39 pm
it pushes the requirement up to 0.41 watt/m^2.
since the solar cycle variation of TSI is of the order of 1.5 W/m2 there is enough to make that requirement.
Not at sea level. You are forgetting albedo, latitude and day/night cycle averaging. That cuts the TSI entering the upper atmosphere to an amplitude of 0.13 w/m^2. Plus, I think that your 1.5 is overestimated by about 50% and some of that 0.13 w/m^2 gets scattered back out and never reaches sea level. When all it said and done, the TSI variations that enter the oceans aren’t capable of producing even 0.04 C amplitude. To me this is very, very simple physics and opinions don’t count for much in comparison. You may call that snide, but I think that you need to respond to the physics of the situation.
bones says:
October 21, 2013 at 8:25 pm
You are forgetting albedo, latitude and day/night cycle averaging. … To me this is very, very simple physics
To me, so is this argument [that automatically takes albedo, latitude and day.night cycle into effect: dS/S = 4 dT/T S= radiative flux, T = temperature. dS/S is generally accepted to be of the order of 0.1%, so dT/T becomes 0.025% of 289K = 0.072K, more than enough to account for your 0.04C.
I agree that over a solar cycle, there should be a radiative balance at the top of the atmosphere. So what? That has little to do with what goes on at sea level. (As a minor aside, the temperature at the top of atmosphere is more like 255 K on average and who knows what the temperature variations are. The 0.05 C wasn’t measured there.) Your calculation might apply at the unit IR optical depth level at the top of the atmosphere where there is no appreciable heat capacity, but it does not apply at the ocean surface.
What happens at the ocean surface has been settled empirically. The 0.09 w/m^2 of intrinsic TSI variations that reach the surface simply cannot modulate water temperature by even 0.04 C. Not even if the oceans were only 20 meters deep. Since the extra energy variation obviously must come from the sun, the reasonable conclusion is that the amount of solar flux that gets to the surface is modulated in passing through the atmosphere.
Your calculation does not apply at the sea surface because it is based on the assumption that the radiating surface has no ability to take in heat and store it.
bones says:
October 21, 2013 at 9:12 pm
I agree that over a solar cycle, there should be a radiative balance at the top of the atmosphere. So what? That has little to do with what goes on at sea level. (As a minor aside, the temperature at the top of atmosphere is more like 255 K
The difference between 255 and observed 289 K at the surface is the ‘greenhouse effect’, so 289 K is the correct number to use at sea level.
Too bad that your calculation doesn’t apply at sea level, isn’t it?
bones says:
October 21, 2013 at 9:21 pm
Too bad that your calculation doesn’t apply at sea level, isn’t it?
I think it applies at the surface, so I don’t think that is so bad. Your comment is rather vacuous, isn’t it?
lsvalgaard says:
October 21, 2013 at 9:23 pm
bones says:
October 21, 2013 at 9:21 pm
Too bad that your calculation doesn’t apply at sea level, isn’t it?
I think it applies at the surface, so I don’t think that is so bad. Your comment is rather vacuous, isn’t it?
I don’t think so. You seem to be wanting to say that 0.09 watt/m^2 variation can make its way all the way down from the top of the atmosphere, enter the ocean and cause its temperature to oscillate by 0.04 C and then be reradiated back out. Can’t happen. 0.09 w/m^2 will produce temperature variations of only 0.01 C. Your calculation would apply only if the ocean surface were a blackbody surface with no heat capacity and then only if thermal infrared could get out as easily as UV/VIS and NIR below about 2 micron got in.
bones says:
October 21, 2013 at 9:44 pm
I don’t think so.
Not that I agree with everything in the following link, but it does contain the basics:
http://www.geo.utexas.edu/courses/387h/Lectures/chap2.pdf
Worth studying.
Seems to me that I have seen this link before. A quick search revealed no mention of heat capacity other than storage in a middle layer of atmosphere. It won’t be of much use if all it is going to do is discuss radiative equilibrium. I think that I have shown that to be an incorrect approach to understanding what goes on in the upper oceans during solar cycles. Nevertheless, thanks for passing it along. I will read it carefully tomorrow. It’s sack time here.
bones says:
October 21, 2013 at 10:10 pm
Nevertheless, thanks for passing it along. I will read it carefully tomorrow. It’s sack time here.
Here too. Keep in mind that all gases with more than two atoms in a molecule [H2O, C2O, CH4, O3, …] are greenhouse gases, not just CO2.
lsvalgaard says:
October 21, 2013 at 9:59 pm
Not that I agree with everything in the following link, but it does contain the basics:
http://www.geo.utexas.edu/courses/387h/Lectures/chap2.pdf
Worth studying.
Keep in mind that all gases with more than two atoms in a molecule [H2O, C2O, CH4, O3, …] are greenhouse gases, not just CO2.
———————————————
My ocean surface energy balance condition included the aggregated effects of downwelling IR from all of your listed molecules. I agree that that they contribute to energy flux that reaches the surface, but it was not necessary to consider them explicitly or to include the negating effects of convection and evaporation in detail. At one meter depth, the only question to be answered is how much net heat flux is required to change the water temperature by 0.04-0.05C. There is nothing in your linked article that negates the fact that 0.09 w/m^2 can only change the water temperature by an amplitude of 0.01 C.
Let me give you a little physics problem that will help us sort this out. Consider an ocean of 25 meter depth that is such a good thermal conductor that there will be no significant temperature gradients within. Let it take in heat per unit area at a rate q sin(wt) and radiatively discharge heat at the surface at a rate hT watt/m^2, where T is the change of water temperature, h=5.42 w/m^2/C and w= 2 pi radians per 11 yr. Assume that there are no other heat losses or inputs at the surface. After transients die out, if q=0.09 w/m^2, what will be the amplitude of water temperature variations? (I got 0.013 C.)
My guess is that you will object to the problem because it doesn’t include any back radiation. If so then you are free to choose the amount you wish to add with two provisions. First, if you wish to provide more surface heat input than the amplitude of TSI variations that actually enter the atmosphere (0.105 w/m^2 for 1.2 w/m^2 peak to trough TSI) then you will need a very, very good explanation for it. Second, we then must agree on an appropriate amount of surface evaporation and convection losses to include. Perhaps in discussing these we will get past the point where we are presently stuck in disagreement.
bones says:
October 22, 2013 at 12:55 pm
My ocean surface energy balance condition included the aggregated effects of downwelling IR from all of your listed molecules.
I think that we are talking past each other. In my view the surface [sea or land] receives energy from two sources: 1) the Sun, and 2) the atmosphere. The latter is about twice the former. Can we agree on that?
I would be happy to accept the Trenberth et al energy budget from their Fig 1. for the surface. Have a look. http://i1244.photobucket.com/albums/gg580/stanrobertson/Trenberth-tfk09_zps8b335def.jpg
bones says:
October 22, 2013 at 8:42 pm
I would be happy to accept the Trenberth et al energy budget from their Fig 1. for the surface
Good, so incoming in 161+333 = 494 W/m2. The solar cycle variation is 0.1% [assuming that both contributions scale the same way] or 0.49 W/m2.
I don’t buy your assumption. To get the ocean temperature you are going to have to do an energy balance in the water. So let’s start with incoming shortwave. Assuming TSI variation entering the atmosphere is 1.2 w/m^2, the amplitude that will enter the surface is 1.2x(161/1365)/2=0.07 w/m^2.
bones says:
October 22, 2013 at 8:53 pm
I don’t buy your assumption.
Well, then there is really no common ground and we are stuck.
lsvalgaard says:
October 22, 2013 at 8:59 pm
bones says:
October 22, 2013 at 8:53 pm
I don’t buy your assumption.
Well, then there is really no common ground and we are stuck.
———————————————-
I would like to get unstuck, but I think that the way to do that is to get you to understand how much heat is required to change the water temperature. I am not likely to be persuaded by one of your surface radiation balance arguments. I have seen them previously and consider them to be flawed. But go ahead and state your case and I will try to follow.
bones says:
October 22, 2013 at 9:02 pm
I am not likely to be persuaded by one of your surface radiation balance arguments. I have seen them previously and consider them to be flawed.
I consider them self-evident, so where do we go from there?
I don’t think that you can say what the change of downwelling IR will be without knowing the change of surface temperature. So it is not at all clear to me that you can say that 0.1% of 333 w/m^2 will be the new contribution. It might be, but we don’t have to assume that. You might try to make the self-evident apparent.
bones says:
October 22, 2013 at 9:10 pm
I don’t think that you can say what the change of downwelling IR will be without knowing the change of surface temperature.
But we know the change of the surface temperature…
OK, the problem can be addressed by considering the amount of heat required to produce the assumed change of surface temperature. Go ahead.
bones says:
October 22, 2013 at 9:21 pm
OK, the problem can be addressed by considering the amount of heat required to produce the assumed change of surface temperature. Go ahead.
We have been down this road before: dS/S = 4 dT/T.
Then since it ended at a cliff, let’s take another path. Tell me how you are going to calculate the heat that went into the water to get your dT. I am not ready to think about your dS yet. There has not yet been any mention of evaporation, convection or even outbound thermal IR. With respect to the latter, I would suggest that (396-333)/396=0.159 is the appropriate net fraction of surface thermal IR that makes it out. For a surface at 289 K you would get an additional 5.47 watt/m^2/C out. So tell me what you want for dT and we will have .159×5.42 dT as the NET outgoing thermal IR from the surface.
bones says:
October 22, 2013 at 9:35 pm
I am not ready to think about your dS yet. There has not yet been any mention of evaporation, convection or even outbound thermal IR.
Those things are automatically accounted for by using T = 289 K [the actual observed T] instead of the 255 K we would have without the atmosphere and oceans.
Great! if they are all accounted for, then tell me how large dT was and how much heat went into the water.
bones says:
October 22, 2013 at 9:45 pm
Great! if they are all accounted for, then tell me how large dT was and how much heat went into the water.
dT = 0.072, 0.49 W/m2, obviously.
I thought dT had been measured to be 0.04-0.05C. How did you get 0.072C?
bones says:
October 22, 2013 at 10:08 pm
I thought dT had been measured to be 0.04-0.05C. How did you get 0.072C?
Perhaps your unfortunate choice of amplitude rather than valley-peak range plays a role here. Actually dT has never been measured. Various people claim a variation [v-p] of the order 0.1C or a bit less but with large error bars. dS/S is generally accepted to be 0.1% [1.36 W/m2], so dT/T becomes dS/S/4 = 0.025% which with T = 289K gives dT=0.072C.
Well, I thought that you must have taken 0.1% of 396 watt/m^2 as the increment of outgoing sea surface IR and at 5.47 w/m^2/C, (for 289K surface) that gets 0.072 C. OK, so far you have 0.49-0.39=0.1 w/m^2 as the net IR entering the ocean. Now tell me how much evaporation you are going to subtract, as this also comes off the surface. At that point we will know how much net heat will actually go downward into the water.
bones says:
October 22, 2013 at 10:37 pm
so far you have 0.49-0.39=0.1 w/m^2 as the net IR entering the ocean.
No, we have 0.49 W/m2 impinging on the surface.
Actually, that 0.1 watt/m^2 is net IR plus UV/VIS and we also have to subtract convection losses (so-called sensible heat).
0.49 impinges, 0.39 is outgoing. The difference, less evaporation and convection losses is the NET that enters the water and might get down more than a cm or two.
bones says:
October 22, 2013 at 10:41 pm
Actually, that 0.1 watt/m^2 is net IR plus UV/VIS and we also have to subtract convection losses (so-called sensible heat).
As per Trenberth [who you were happy with], we have 333 W/m2 absorbed by the surface from the atmosphere plus 161 W/m2 from the Sun absorbed by the surface for a total of 494 W/m2. For small changes everything scales linearly, so 0.1% is 0.49 W/m2.
Leif, if you will have a look at Trenberth’s diagram you will see that there is 396 w/m^2 outgoing surface thermal infrared. It emits more than it receives as back radiation. So if you are wanting to say that .333 w/m^2 of thermal IR is absorbed at the surface, you also have to accept that it will radiate .396 w/m^2. That is required of a blackbody with surface temp change of 0.072C.
bones says:
October 22, 2013 at 10:51 pm
you also have to accept that it will radiate .396 w/m^2.
It radiates after it has been heated, so the incoming 0.49 W/m2 heats the surface to increase the temperature as observed. I think this is clear.
I am dying for lack of sleep. Been up too long. I suspect that I will have to wait for you to digest the last exchange. But let me leave another comment or two to consider, I would suggest that of the increment of UV/Vis that enters the ocean, 0.14 w/m^2 (2x my amplitude), the fraction that would be removed by evaporation and convection would be 97/161. That gets another surface heat loss of 0.084 w/m^2, leaving a NET 0.016 w/m^2 to heat the ocean at depths below a few cm. and pleasant dreams to you, too.
bones says:
October 22, 2013 at 11:10 pm
I suspect that I will have to wait for you to digest the last exchange.
I’m fine with what I have explained to you so far. Makes perfect sense.
lsvalgaard says:
October 22, 2013 at 11:10 pm
bones says:
October 22, 2013 at 10:51 pm
you also have to accept that it will radiate .396 w/m^2.
It radiates after it has been heated, so the incoming 0.49 W/m2 heats the surface to increase the temperature as observed. I think this is clear.
——————————————————
Let me ask you to set up the simple first order differential equation that would control the rate of heating of a 25 m deep ocean. It will have a derivative of the temperature change in the right member. You are missing an important point. This process of heating and cooling is cyclical and there is never going to be much of a thermal lag between surface heat inputs and surface temperature. You have to consider that when the temperature change from equilibrium is T, then there will be a net surface radiative heat loss of (5.47T less the back radiation.)
You think that you have a NET 0.49 w/m^2 to heat the water, but that is dead wrong after the first few solar cycle transients are done. On that I really am going to give up for the night. I am pretty sure that you can solve a freshman physics heat problem, so why not give it a try?
bones says:
October 22, 2013 at 11:23 pm
Let me ask you to set up the simple first order differential equation that would control the rate of heating of a 25 m deep ocean.
There are assumptions about thermal diffusion [conduction, mixing, etc] that cannot easily be incorporated. I don’t see how those uncertainties can be overcome in a simple [and non-objectionable] manner, so I doubt the usefulness of such an exercise.
I think that you know what would be reasonable assumptions for 25 m of water with no internal thermal gradients. Humor me, please. It took me far less time to solve the problem than we have spent here in trying to define it.
Bones, you might find this paper rather interesting, found UV varies up to 100% over cycles creating an amplification via ozone. I haven’t read it all yet but you came to mind.
http://www.atmos-chem-phys.net/13/10113/2013/acp-13-10113-2013.pdf
wayne says:
October 23, 2013 at 1:43 am
Bones, you might find this paper rather interesting, found UV varies up to 100% over cycles creating an amplification via ozone. I haven’t read it all yet but you came to mind.
http://www.atmos-chem-phys.net/13/10113/2013/acp-13-10113-2013.pdf
—————————————————————-
Wayne, thanks. I will read it and see how it works out. The basic problem that I pointed out is that there must be some mechanism that modulates the solar energy that reaches the surface because the fraction of intrinsic solar TSI variation that enters the surface is inadequate.
lsvalgaard says:
October 22, 2013 at 11:10 pm
bones says:
October 22, 2013 at 10:51 pm
you also have to accept that it will radiate .396 w/m^2.
It radiates after it has been heated, so the incoming 0.49 W/m2 heats the surface to increase the temperature as observed. I think this is clear.
————————————————-
If you are wanting to say that you have the full effect of 0.49 w/m^2 to heat the water until the surface has heated, I would say that you are wrong. Bearing in mind that we are supposed to be starting from Trenberth’s balanced conditions, you don’t have any fraction of that 333 w/m^2 of downwelling infrared to provide additional heat for the water at the outset. At wavelengths below 2 micron, you have about 161/1365 of the TSI variation that enters the surface. About half of the difference between this amount and the TSI variation that enters the atmosphere can be added. The other half of the difference would be either scattered upward or reradiated to outer space. So what enters the surface is about [161/1365 + (0.7/4-161/1365)/2]x1.2=0.1465 w/m^2. Back radiation, evaporation and convective heat losses must be subtracted from this when the surface temperature changes, and it will change significantly long before the TSI has changed from trough to a peak that is 1.2 w/m^2 higher.
The basic flaw in your thinking is that you are relying on the atmosphere to provide two thirds of the heat to the water. But for even 25 meters of water, the ocean has over ten times the heat capacity of the atmosphere. The atmosphere cannot provide the heat. Any excess heat that it provides to the ocean must come from the fraction of TSI that is absorbed by the atmosphere. (I gave it half, you may quibble if you provide a good reason.) Further, it’s heat capacity is so small in comparison to the oceans that it cannot ever lead or lag ocean temperature by more than seasonal lag.
Bones, I like your approach of this problem very much, it’s like a breath of fresh air and with my limited time it may take quite a while to delve into this as detailed as I wish to do so, so be patient. This climate science posture, their way of looking at radiation to somehow create an impression that two thirds of the energy comes from the atmosphere is so foreign to me, so I usually just ignore it as such. It is primary in temperature differentials, any use of Stefan’s law should be via temperature differentials and never as if all is against the void of space at zero K and an emissivity of one so when I write back later that is the framework I will be using, two-way e/m fields that can cancel effects. The temperature at the surface and the temperature at an altitude of say one hundred meters is what guarantees that so very little real radiation is leaving the surface, mostly through the window, in contrast to common climate science talk.
To me, you amplification must, or it seems at first must, be via albedo or emissivity in some manner and that is where I will attack this to begin with. That is why I thought that article may possibly hold something of value, maybe not, for it seems on first skim that it alters the temperature profiles plus a variance in the depth of absorption in the oceans. Also, to me, UV has the ability to break water vapor covalent bonds and could have some effect there lowering cloud thickness, possible amplification there.
(the “Post Comment” seems to have failed… this may be a duplicate)
wayne says:
October 24, 2013 at 6:15 pm
. . . To me, you amplification must, or it seems at first must, be via albedo or emissivity in some manner and that is where I will attack this to begin with. That is why I thought that article may possibly hold something of value, maybe not, for it seems on first skim that it alters the temperature profiles plus a variance in the depth of absorption in the oceans. Also, to me, UV has the ability to break water vapor covalent bonds and could have some effect there lowering cloud thickness, possible amplification there.
————————————————————-
Wayne, thanks for being appreciative. I agree with you that albedo is the prime suspect in modulating the incoming solar energy. Low level cloud changes would do that nicely. This would fit with changes in ocean evaporation as temperatures change and might also be modulated by cosmic rays. There are already some measurements that show large surface flux variations associated with the solar cycle http://www.atmos-chem-phys.net/11/1177/2011/ .
About that two thirds of the energy impinging on the sea surface coming from the atmosphere: the bulk of it is back scatter that got its start as IR as outgoing radiation from the surface. Only an idiot would consider the atmosphere to be its source. The energy derives from the sun, which heats the surface and allows it to radiate. If not for the backscattering all of that radiation would escape. The atmosphere is pretty well optically thick in the IR beyond about 2 micron. Nevertheless, you can’t do a surface energy balance correctly without considering the backscattered IR.
bones: “… the bulk of it is back scatter that got its start as IR as outgoing radiation from the surface.”
Exactly, nothing more, proper physics of the isotropic nature of the atmosphere’s radiation at every level and definitely not a source. I said that hoping you would realize that I’m in perfect agreement with what you are saying so far. Just wanted you to know I have no strange views of radiation that you see bouncing about the blogs about climate science. I monitor radiosondes very regularly, watch ESRL/ARM stations for long periods, I realize the radiation aspects correctly. But I also said that because I tend to speak in net terms and shy from this seperation into two flows in case you every question something I say later, to me it’s one way, up, except in the most rare cases when the clouds are literally the warmer of the two. Just didn’t want us to get crosswise on that touchy subject right off the bat. 🙂
Was mulling over in my head what I had said earlier and it dawned on me, a mistake… the breaking of hydrogen bonds in clouds… not covalent.