From the University of Wisconsin:
Greenland ice may exaggerate magnitude of 13,000-year-old deep freeze
Ice samples pulled from nearly a mile below the surface of Greenland glaciers have long served as a historical thermometer, adding temperature data to studies of the local conditions up to the Northern Hemisphere’s climate.
But the method — comparing the ratio of oxygen isotopes buried as snow fell over millennia — may not be such a straightforward indicator of air temperature.
“We don’t believe the ice cores can be interpreted purely as a signal of temperature,” says Anders Carlson, a University of Wisconsin–Madison geosciences professor. “You have to consider where the precipitation that formed the ice came from.”
According to a study published today by the Proceedings of the National Academy of Sciences, the Greenland ice core drifts notably from other records of Northern Hemisphere temperatures during the Younger Dryas, a period beginning nearly 13,000 years ago of cooling so abrupt it’s believed to be unmatched since.
Such periods of speedy cooling and warming are of special interest to climate scientists, who are teasing out the mechanisms of high-speed change to better understand and predict the changes occurring in our own time.
In the case of the Younger Dryas, average temperatures — based on the Greenland ice — plummeted as much as 15 degrees Celsius in a few centuries, and then shot back up nearly as much (over just decades) about 1,000 years later.
“In terms of temperature during the Younger Dryas, the only thing that looks like Greenland ice cores are Greenland ice cores,” Carlson says. “They are supposed to be iconic for the Northern Hemisphere, but we have four other records that do not agree with the Greenland ice cores for that time. That abrupt cooling is there, just not to the same degree.”
Working with UW–Madison climatologist Zhengyu Liu, collaborators at the National Center for Atmospheric Research and others, Carlson found their computer climate model breaking down on the Younger Dryas.
While it could reliably recreate temperatures in the Oldest Dryas — a similar cooling period about 18,000 years ago — they just couldn’t find a lever in the model that would simulate a Younger Dryas that matched the Greenland ice cores.
“You can totally turn off ocean circulation, have Arctic sea ice advance all the way across the North Atlantic, and you still will have a warmer climate during the Younger Dryas than the Oldest Dryas because of the carbon dioxide,” Carlson says.
By the time the Younger Dryas rolled around, there was more carbon dioxide in the air — about 50 parts per million more. The warming effects of that much CO2 overwhelmed the rest of the conditions that make the Oldest and Younger Dryas so alike, and demonstrates a heightened sensitivity for Arctic temperatures to rising greenhouse gases in the atmosphere.
The researchers zeroed in on the Northern Hemisphere’s temperature outlier, Greenland ice cores, and found that the conversion of oxygen isotope ratio to temperature typically used on the ice cores did not account for the sort of crash climate change occurring during the Younger Dryas. It assumes prevailing winds and jet streams and storm tracks are providing the moisture for Greenland precipitation from the Atlantic Ocean.
“The Laurentide ice sheet, which covered much of North America down into the northern United States, is getting smaller as the Younger Dryas approaches,” Carlson says. “That’s like taking out a mountain of ice three kilometers high. As that melts, it allows more Pacific Ocean moisture to cross the continent and hit the Greenland ice sheet.”
The two oceans have distinctly different ratios of oxygen isotopes, allowing for a different isotope ratio where the water falls as snow.
“We ran an oxygen isotope-enabled atmosphere model, so we could simulate what these ice cores are actually recording, and it can match the actual oxygen isotopes in the ice core even though the temperature doesn’t cool as much,” Carlson says. “That, to us, means the source of precipitation has changed in Greenland across the last deglatiation. And therefore that the strict interpretation of this iconic record as purely temperature of snowfall above this ice sheet is wrong.”
By the study’s findings, Greenland temperatures may not have cooled as significantly as climate headed into the Younger Dryas relative to the Oldest Dryas, because of the rise in atmospheric carbon dioxide that had occurred since the Oldest Dryas.
“You can say at the end of the Younger Dryas it warmed 10, plus or minus five, degrees Celsius. But what happened on this pathway into the event, you can’t see,” Carlson says.
It’s a fresh reminder from an ancient ice core that climate science is full of nuance, according to Carlson.
“Abrupt climate changes have happened, but they come with complex shifts in the way climate inputs like moisture moved around,” he says. “You can’t take one difference and interpret it solely as changes in temperature, and that’s what we’re seeing here in the Greenland ice cores.”
The National Science Foundation and Department of Energy funded the research.
=======================================================
Note: as of this writing, the article is not yet online at PNAS – I’ll update this post when it becomes available – Anthony
=========================================
Commenter and Contributor Bill Illis submitted this comment to Tips and Notes with the request that it be moved here. Since we cannot move comments from one thread to another and since the comment is quite relevant to this thread, I decided to post this as an update. (Bill if you had trouble posting the comment, please let us know what the trouble was.) -REP
=================
(A long post meant to explain the problem with the Greenland ice core temperature reconstructions thread posted earlier today. If this could be moved there, I consider it an important problem which is not noted that often).
The problem with the Greenland temperature reconstructions is that, starting about 20 years ago, they began calibrating the isotope data with “borehole temperature” reconstructions rather than the typical measured formula.
This has overstated the temperature change by more than twice what the normal isotope formula for Greenland’s circumstances would have indicated and set-back the science 20 years.
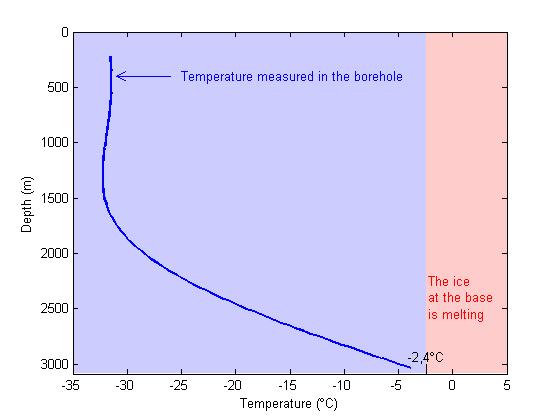
The Borehole temperature profile for the Greenland ice cores at this link (just slightly different in each location). The ice sheet is melting at the bottom since it is -2.4C which is just enough to melt the ice at the pressure levels at the bottom of the ice-sheet (the new recently completed Neem ice core, however, is at -3.0C and appears to be unmelted).
http://www.iceandclimate.nbi.ku.dk/images/images_research_sep_09/Temp.jpg/
So they use a model about how temperatures at the surface and temperatures at bedrock migrate through the 3 km deep ice-sheet and they can guesstimate what the surface temperatures were in the past. They then recalibrate the dO18 isotopes to those guesstimates rather than the known conversion formula. The problem is that the borehole models appear to be wrong by a factor of 2.
If one used a more typical formula for the isotopes in Greenland’s ice cores, we get temperatures that are more consistent with what we know about the North Atlantic, Northern Hemisphere, Antarctica and Europe (during the ice ages and during the Younger Dryas). In addition, now that the Greenland ice cores go all the way back to the Eemian interglacial, 123,000 years ago, we can say the borehole temperature conversion formula is wrong because it has temperatures in Greenland at +9.0C for the Eemian. This would have melted out most of the glaciers given a few thousand years and this did not happen. The typical isotope formula provides a number of +4.0C which is more consistent with Antarctica, sea level and global conditions during the Eemian.
The Younger Dryas temperatures only declined by about half what is typically quoted.
Related articles
- Younger Dryas -The Rest of the Story! (wattsupwiththat.com)
- New evidence of Younger Dryas extraterrestrial impact (wattsupwiththat.com)
Summary:
Greenland ice core data does not agree with climate models that have CO2 as a main forcing. Therefore Greenland ice core data needs to be adjusted.
I have explained why isotopes are not paleothermometers, but that has been moderated away.
Maybe I can try again now, after this study. Just verify in the textbooks that the isotope signature of precipitation is mainly determined by two factors, the temperature at condensation and the rain out of heavy isotopes during transport of the cloud.
The first factor temperature of condensation is assumed to be related to ambient temperature at the surface. But meteorologist know that this is not the case, if you compare the rainforests with the deserts.
Temperature at condensation is dewpoint, hence the isotope are a proxy of the absolute humidity of the airmass and not of the ambient temperature.
I have been telling this for years now. But obviously so many wise men can’t be wrong.
“You can say at the end of the Younger Dryas it warmed 10, plus or minus five, degrees Celsius. But what happened on this pathway into the event, you can’t see,” Carlson says.”
You can say that the tolerance in an engine bearing is 1 micron plus or minus 0.5. That would be some reliable engine.
Incredible. Just say: Nobody has a clue what temperatures where before instrument measurements began within in any kind of reasonable error margin and be done with it.
Refreshing to see professional scientists moving away from blind reliance on proxies, and paying some attention to calibration and metrology.
One thought that comes to mind is thatof possible “mobility”, similar to that of electrons in a semi-conductor. Such migration would be somewhat biased by isotopic mass/weight.
This type of question about the provenance and properties of isotopes now found in ice cores has been noted before. Even with deuterium in the Antarctic, we have this –
……………………………………….
Dome F and Vostok deuterium excess reveal homogeneous variations in East Antarctica moisture origin at orbital scale
* Vimeux, F (vimeux@lsce.saclay.cea.fr) , LSCE, CE Saclay, Orme des Merisiers, Bat 701, Gif-sur-Yvette, 91191 France, and others from year 2005.
“Deuterium excess (d) in polar ice cores is now of a widespread use to reconstruct temperature variations at the oceanic moisture source. At glacial-interglacial timescale, only two deuterium excess profiles are available at Vostok and Dome Fuji in East Antarctica. Those two sites of snow deposition undergo very different moisture origin. Dome F is located in the Atlantic sector whereas Vostok mainly receives moisture from the Indian ocean. In this context, we explore here the similarities between the two profiles regarding the Vostok d interpretation involving obliquity as a key parameter in controling the meridional ocean temperature gradient variations. We further explore this obliquity impact by discussing new simulations done with an intermediate complexity model (CLIMBER). We also examine differences between the two d profiles in order to estimate potential local and specific effects on deuterium excess. Especially, we discuss the Vostok d feature before 250 ka. (Abstract from AGU)
…………………………………….
There are many papers that point to the provenance problem. This is but the first that appeared on a long keyword search.
First rule of climate ‘science’ if reality and the models differ in values , its reality which is wrong .
“Ice samples pulled from nearly a mile below the surface”
Question?
What is the formula for pressure as a function of depth and would this pressure have an effect on oxygen isotopes?
Lake Missoula was larger then Lake Erie and Lake Ontario combined.
In my simple mind if one removes one of the largest bodies of water in North America then one changes the precipitation patterns for North America,
“…In the case of the Younger Dryas, average temperatures — based on the Greenland ice — plummeted as much as 15 degrees Celsius in a few centuries, and then shot back up nearly as much (over just decades) about 1,000 years later…”
No wonder they can’t depend on the ice cores as a temp proxy – they show wild temp extremes driven by natural causes. And since any CO2 in the air was BEFORE man (pre-fossil fuel use), it shows just how volitile natural “climate change” can be.
leftturnandre:
“Temperature at condensation is dewpoint, hence the isotope are a proxy of the absolute humidity of the airmass and not of the ambient temperature.
I have been telling this for years now. But obviously so many wise men can’t be wrong.”
It’s kind of obvious when you put it that way!!
As for CO2 — who knows what kind of rubbish they have in their model of CO2 forcing. Trying to build a climate model on the current non-science of CO2 forcing is like trying to build the empire state building on a foundation of cheese.
This looks like the paper, with supplemental here.
Their models are very sensitive to CO2. Hence they are unable to model a cold Younger Dryas because CO2 levels then were too high. Perhaps their models are too sensitive to CO2? But this is a conclusion that they cannot allow themselves to consider. So instead they conclude that the data must be wrong.
Started out reasonably but fell at the CO2 hurdle. The assumption that a 50ppmv increase in atmospheric CO2 will raise temperatures is just that an assumption based on the GHG theory. Recent atmospheric CO2 levels have recently risen by 50ppmv but the expected warming has not occurred. So perhaps this research could be repeated to ignore CO2 and see if the observations become explainable.
No problem. Leave CO2 forcing out of your models and look for a different forcing factor.
Here we go again, adjusting the data to fit the models. No one apparently thought to ask if the reason why conditions were similar was because the models are wrong. That perhaps CO2 sensitivity is lower than models predict, because H2O feedback in the tropics is strongly negative, due to increased convection with increased temperature.
How is it that every single climate model assumes positive H2O feedback as one of its parameters, without ever having established this scientifically? Why not repeat the model run of the Older and Younger Dryas with negative H2O feedback and see if it matches reality?
Of course, negative H2O feedback is unacceptable politically in models. It would mean that there is zero chance of CAGW occurring, so it is never tested in any model anywhere, because it would mean there is no need to spend billions on climate science. Every climate scientists would be up in arms complaining about the model, because the implications would directly threaten their phoney baloney jobs.
So if real data from the real world can’t be replicated by computer models, then the real data must be wrong? You’ve got to be kidding! That’s like saying, it rained today but computer models said it wasn’t supposed to rain: therefore, it didn’t rain!
Aside from the absurdity of trying to prove the real world is wrong by computer models, there is abundant evidence of the existence, abruptness, and extent of the Younger Dryas in the global glacial record (i.e., the real world) and many other proxies. These cannot be brushed aside by some computer model that says it didn’t happen! The correlations between the Greenland ice cores and the global glacial record is excellent and they confirm each other. Remember that the oxygen isotope data records temperatures in Greenland, not the entire world. However, what the isotope data show is the abruptness of the YD climate changes, their chronology, and intensity of the changes, all of which are amply confirmed by many other real world proxies
So if I understand them correctly:
Ice cores including Greenland outside of the YD = purely temperature. Greenland and only Greenland and only during the YD =/= temperature.
Seems to me that every part of every ice core should be questioned in terms of how representative of temperature it is, and how large of temperature changes they can be associated with. Not just the few we have trouble understanding.
Always happy to use any proxy that matches my model’s predictions…and will instead til I’m dead that such proxies justify my model’s predictions for future warming…. Blah blah blah. This type of nonsense is central to the plain truth that AGW-oriented “science” simply IS NOT scientific.
In great puzzlement they said, “they just couldn’t find a lever in the model that would simulate a Younger Dryas that matched the Greenland ice cores”. Oh, dear!
However, one cannot allow one’s model to not explain everything, so they play the CO2 card. “By the time the Younger Dryas rolled around, there was more carbon dioxide in the air — about 50 parts per million more.”
Where did all that CO2 come from? Could the abrupt warming between OD and YD cause more CO2 to bubble up, supporting the data that natural warming comes before the elevation of CO2?
“The Laurentide ice sheet, which covered much of North America down into the northern United States, is getting smaller as the Younger Dryas approaches,” Carlson says. “That’s like taking out a mountain of ice three kilometers high. As that melts, it allows more Pacific Ocean moisture to cross the continent and hit the Greenland ice sheet.”
And did they show specifically how an infusion of Pacific isotopes would affect the conclusion?
And did they explain how the Rocky Mountains which their invigorated winds would have to cross before the ice also disappeared?
Just the latest in a series of preposterous mechanisms, but the all-time champion remains the suggestion that increased weathering from plant root tilling caused the Ordovician glaciation.
Outside the obvious problems with the assumed AlGorithms, does ANY “modeling” software go through any kind of validation process? You know… like putting in known good data, purposely out-of-bounds values, random number sets, etc — the things that CSC101 taught you about testing software to insure it does what it was purported to do when designed??? Good software simply returns an error flag and quietly shuts down when bad stuff happens. It does not produce the “required” hockey response! Does anyone in climastrology even know what “software validation” means??? Just askin’
The level of CO2 cannot explain this episode, and THAT’S their grounds for questioning the temperature proxy? Guy must be bucking for archbishop.
“(T)easing out the mechanisms of high-speed change to better understand and predict the changes occurring in our own time,” or to look for similarities to current conditions that may be used to further justify alarmism?
“Teasing’ out conclusions from data is no longer the exclusive domain of climate ‘scientists.’
Social psychologist Dirk Smeesters of Erasmus University Rotterdam in the Netherlands resigned effective 21 June after an investigative panel found problems in his studies and concluded it had “no confidence in [their] scientific integrity.” The panel asked for the retraction of two of his papers after he admitted to “massaging” the data in some papers to “strengthen” outcomes, while defending his actions as common in his field.
news.sciencemag.org/scienceinsider/2012/06/rotterdam-marketing-psychologist.html
Don J. Easterbrook said:
there is abundant evidence of the existence, abruptness, and extent of the Younger Dryas in the global glacial record (i.e., the real world) and many other proxies.
Yes but, but, but,…. these real world proxies may tell a completely different story. Not about cold and warm but humid and dry, continental and sea climate changes. Dry versus wet summers, it all makes a huge difference in vegetation and isotope proxies.
You’d really need to scrutinize what you’re seeing and you’ll be surprised.