US Tornado Trends–Updated to 2011
Guest post by Paul Homewood
2011 has obviously been a disastrous year for tornadoes in the USA, but does this reflect an increasing trend in either the number or severity of tornadoes?
The NOAA graph below is often used to show trends of severe F3+ tornadoes and certainly indicates that there has been no upward trend up to 2010.

The provisional March-August figure for 2011 is 79 EF3-EF5 tornadoes, which would be much less than 1974 and on a par with 1965. However, this only gives part of the picture as it only runs from March – August, and excludes weaker tornadoes. Nevertheless comparing total tornado numbers can be misleading.
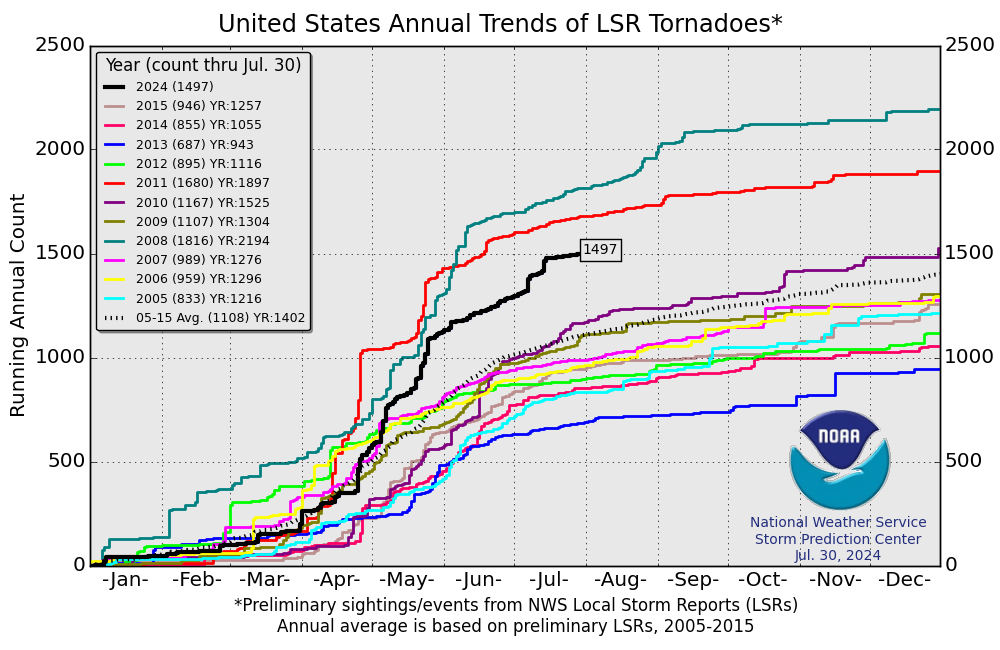
(Added by Anthony – For the entire 2011 year, the count is slightly higher:)

An NOAA study by McCarthy and Schaefer in 2002 identified a sharp rise in total tornado numbers between 1970 and 2002, but made it absolutely clear that this was changes in methods of detection, e.g.
There was a significant increase in tornado occurrence during two periods in the last 33 years – in the early 1980s when National Weather Service (NWS) warning verification began, and in 1990 when the WSR-88D became operational.
The increase in reported tornado frequency during the early 1990s corresponds to the operational implementation of Doppler weather radars. Other non meteorological factors that must be considered when looking at the increase in reported tornado frequency over the past 33 years are the advent of cellular telephones; the development of spotter networks by NWS offices, local emergency management officials, and local media; and population shifts. The growing “hobby” of tornado chasing has also contributed to the increasing number of reported tornadoes.
(The WSR-88D Doppler system was phased in between 1992 and 1997).
As a result of these changes, the proportion of F0 tornadoes (which Doppler detects) increased from an average of 39% between 1970 and 2002, to 64% for 1998-2002. As the authors stated,
“ Finally, it will be seen that the number of strong and violent tornadoes has not varied much since 1970.”
So bearing this in mind, and using data supplied by NOAA’s Storm Prediction Center, I have analyzed all reported tornadoes by category since 1970.
AVERAGE NUMBER OF US TORNADOES PER YEAR
(2000’s are 2000-2011)
| 1970’S | 1980’S | 1990’S | 2000’S | |
| F0 | 274 | 331 | 739 | 812 |
| F1 | 343 | 334 | 331 | 369 |
| F2 | 188 | 124 | 109 | 108 |
| F3 | 50 | 33 | 38 | 33 |
| F4 | 14 | 9 | 9 | 7 |
| F5 | 3 | 1 | 1 | 1 |
| TOTAL | 872 | 832 | 1227 | 1330 |
| TOTAL F1+ | 598 | 501 | 488 | 518 |
F0-F5 are based on the Fujita tornado intensity scale
The following graph shows the trends well.

(P.A. – per annum)
Conclusions
There has been no significant trend in F1+ tornadoes since 1980, and each decade since then has been less than the 1970’s. The 2000’s show more F0 tornadoes, but this is the first decade Doppler systems have been fully operational, so we should now have a good basis for the future.
==========================================================
Addendum by Anthony –
The graph for 2011 Total Tornadoes (all F0-F5 reported) shows that even though 2011 had some notable and terrible disasters, such as May 22nd Joplin EF5 tornado and the April 27th Mississippi-Alabama outbreak, it did not exceed the year 2008:
The ONLY things that are increasing are: the technologies and data sources used to detect and report tornados, and the hysteria created by CAGW acolytes that wish to push forward an agenda.
Any other interpretation of the scientific tornado data is hokum.
Maybe they could do it like they do it with sunspots – detect all events using available technology, then adjust these numbers to be comparable with historical records.
A year or two of “old method” and “new method” overlap would be good here as well. It’s the same issue as with the surface stations: If the instrumental methods themselves are a function of time, making anything better than a rough “proxy” for something is self-delusional.
Don’t forget that people have spread out since the 70’s. Towns have spread out and become small cities and there are more subdivisions where people like to live close to town but away from the traffic and noise. So they can’t really say there was an increase, just better reporting of them now than in the past.
In the UK, the Met Office failed to do its job once again.
A spokesman said: “The squally nature of the winds meant that gusts were much stronger than we were expecting.
“Given the impact the winds have caused, had we known, we would have put out a warning across the south.”
http://www.telegraph.co.uk/topics/weather/8995705/Britain-battered-by-hurricane-force-winds-after-forecasters-underestimate-strength-of-gusts.html
Doesn’t this bit -> 2000’s are 2000-2011
Mean the 2000’s cover 12 years and the rest only 10 oer decade ?
It is good to see that F3-5 tornadoe numbers are actually falling. These storms would be obvious over the years so these accumulated numbers will tell the real story. F0-2 numbers have risen due to detection technology so historic comparisons are difficult if not impossible.
Eyeballing the first chart :-
I see that from 1950-1974 when the climate was cooling the tornado trend was up. Since then with a warming climate the trend has been down, which is opposite to what the MSM tell us. So now if the climate cools the trend should one again go positive/up.
Makes perfect sense to me.
Let’s see what happens over the next few years.
But wait – they’ve been telling us its the worst in eleventy billion years or something. It couldn’t be as simple (as most rational folks understand) as better communication, better equipment and detection and better and more extensive storm reporting?
!970 shows a significantly higher incidence of strong tornado’s …. hmmm, wasn’t that when the scientists were warning of impending global cooling?
Man Bearpig
Doesn’t this bit -> 2000’s are 2000-2011
Mean the 2000′s cover 12 years and the rest only 10 oer decade ?
That’s right. The SPC data is batched together as 1970-79, etc, so it seemed sensible to continue with 2000 as the start point for the current “decade” of 12 years!
Excellent work. The chart tells the story! ALL the increase is in F0, which generally went unnoticed before the improvements in radar and communication.
In the types that have always been noticed (because they destroyed things and killed people) there’s no change.
You miss MBP’s point. That would mean the 2000s should be 2000-2009. The next decade is 2010-2019.
Study it. It’s not all that hard once you realize that under this convention a decade ends on a ‘9’, not a ‘0’ or a ‘1’. You could choose to start with ‘1’ and end with ‘0’, but never the reverse.
In dong trend spotting most people end up seeing what suits their mindset. The claim “still no upward trend” is so vague as to me impossible to agree or disagree with.
If I squint at the graph I’d say there was a rise from the beginning until about 1975, a decline until 2001 and a small but definite rise since.
Tornadoes are an event that accompanies cooling (according to some of the more credible articles on this site). So what I would see here is a fairly clear indication that we are in a cooling period (or at least the US mainland is).
Invert this graph and you have a rough match to last 60 years global temps.
Someone could look at doing some proper stats on that but I’d say there is a clear correlation in that sense.
RexAlan says:
January 6, 2012 at 2:34 am
Eyeballing the first chart :-
I see that from 1950-1974 when the climate was cooling the tornado trend was up. Since then with a warming climate the trend has been down, which is opposite to what the MSM tell us. So now if the climate cools the trend should one again go positive/up.
This was my thought on an simple eyeball / guesstimate level too. Which to me, if indications play out as I have seen and believe to project forward – then over the next few years, we could expect the numbers to start increasing again as the temperatures drop (similar to the 70’s). But, that’s just my non-climate ‘edumacated’ guess and not looking much deeper than the graph itself.
Brian H
You miss MBP’s point. That would mean the 2000s should be 2000-2009. The next decade is 2010-2019.
I could have run 2000-2009, but then it would not have been up to date and I could stand accused of deliberately ignoring 2011. (And taking 2010/11 as a two year slice would hardly give a long term trend).
Don’t get too tied up with “decades”. The data shows that tornadoes in the last 12 years are at a similar level to 1980-99.
P Solar
If I squint at the graph I’d say there was a rise from the beginning until about 1975, a decline until 2001 and a small but definite rise since.
McCarthy and Schaefer say “Finally, it will be seen that the number of strong and violent tornadoes has not varied much since 1970.” (This of course is up to 2002).
The average of F3+ since 2000 = 41 p.a., compared to 43 in the 80’s and 48 in the 90’s. I am not sure if these differences would be regarded as significant.
F0’s 1980’s 331 + doppler radar = 1990’s 739
A. Scott says:
January 6, 2012 at 2:36 am
“But wait theyve been telling us its the worst in eleventy billion years or something.”
Yes – THEY (aka the mainstream climate scientists) can now tell us UNEQUIVOCALLY that storms are worse now than ever by reading…you know… tree rings…and other proxies. Proxies can tell us SO MUCH using the right mathematical processing techniques…
Here in Blighty we have had some bad weather recently and, sadly, someone died when a fallen tree crushed him in his car (gale force winds, gusting to 100+ on high ground in the North and Scotland). My apologies to those of you in the USA, Canada, Russia, Australia, India, et al. You are probably all thinking: “with storms like that, what the hell are they worrying about?” Please understand that over here, ably led by our politicians and the BBC, all weather is disastrous and the worst ever known. The article below puts present reality into perspective:
http://www.dailymail.co.uk/news/article-2082939/Think-weeks-gales-bad-Theyre-storm-drowned-Britain.html#comments
From your table, even including F2’s would still show a decline. Only F0 and F1’s have “increased”.
I think it’s confusing to use TOTAL to mean “total average”. That’s why people are confused about you using 2000-2011 as a group, even though the graph title states that it’s the average per year.
“No upward Trend in Tornadoes” is clearly caused by Climate change. Try to keep up 😉
Yet more Windmills destroyed…..by the wind.
http://www.dailymail.co.uk/news/article-2083149/Wind-turbines-cope-UK-weather-3-blown-pieces.html
Whirled off pain. (It’s a pun).
http://www.telegraph.co.uk/news/picturegalleries/picturesoftheday/8997144/Pictures-of-the-day-6-January-2012.html?image=9
Show a trend line for the stronger ones from 1950 on. It’s easy to see for the commenters here, but the general population – if not the media – might benefit a bit if it’s spelled out for them.
Wow! Imagine if they had the same current methods of tornado detection during the 1960 to 1975 time frame! It must have been hell on earth!! How did we manage to survive with all that ignorance??!!