I have been asked to present this for review by readers here, and to solicit critical comments for the purpose of improving the presentation. Moderators please remove any off-topic comments and commenters please stick to the issues of review. – Anthony
[…]
Now, about the climate science:
‘‘It’s unchallengeable that CO2 traps heat and warms the Earth and that burning fossil fuels shoves billions of tonnes of CO2 into the atmosphere,”
“But where you can get challenges is on the speed of change.”
— Professor John Beddington
The British government’s chief scientific adviser, John Beddington, has called for more openness in the global warming debate. He said climate scientists should be less hostile to sceptics who questioned man-made global warming. He condemned scientists who refused to publish the data underpinning their reports. He also said public confidence in climate science would be improved if there were more openness about its uncertainties, even if that meant admitting that sceptics had been right on some hotly disputed issues.
“I don’t think it’s healthy to dismiss proper scepticism. Science grows and improves in the light of criticism. There is a fundamental uncertainty about climate change prediction that can’t be changed.” [As reported in The Australian“i. Other reports were similar.]
I would like [the two speakers] to address the specific issue of the deleted data in reconstructed temperature graphs.
The issue is as follows: In their third report (“TAR”), the IPCC published the following graphii:

This is a graph of several temperature proxies, with the instrumental temperature record from around 1900 added. What it shows is that temperatures had been declining fairly steadily for nearly 1000 years, but then suddenly shot up in the 20th century.
It has now been discovered that some of the data series had been truncated in the graph. The result of these truncations was to make the data series look more consistent and therefore convincing. (NB. I make no statement about intent.). If the data series had not been truncated, the end result would have been very differentiii:

The two red segments are the truncated data. These two segments and the dotted curve connecting them are a single data series “Briffa-2000”1. Note that the first downward segment of the black graph (instrumental temperature) has also been deleted in the version used by the IPCC.
The extreme divergence between the “Briffa-2000” proxy and the instrumental temperature record shows that this proxy is completely unreliable (the “divergence problem”). To delete segments from the graph – especially without a prominent explanation – is bad scientific practice. Contrary to claims by various climate scientists, the deletions were not disclosed in the TAR. Nor was the “divergence problem” discussediv. As Professor Richard A Muller of University of California, Berkeley, has said “You’re Not Allowed to Do This in Science“v.
Was the “Briffa-2000” data series the only unreliable proxy data series? It seems not. Phil Jones’ 1999 “Climategate” email indicated that other proxy data series had been truncated to “hide the decline“vi.
It has been argued that this “hide the decline” graph (aka the hockey-stick) is not important in the overall scheme of things, ie. in climate science as a whole. Gavin Schmidt put it this way on RealClimate.com, “if cherry-picked out-of-context phrases from stolen personal emails is the only response to the weight of the scientific evidence for the human influence on climate change, then there probably isn’t much to it.“vii.
Unfortunately, the “hide the decline” graph is much more important than that. In the fourth IPCC report (“AR4”), the effect of solar variation on climate is discussed. Theories such as Henrik Svensmark’s are dismissed as “controversial” and then ignoredviii. Consequently, solar variation is included in the climate models purely as the direct climate forcing from total solar irradiation (TSI). Since variations in TSI are quite small, in percentage terms, the climate models allow only for small temperature changes from TSI changes.
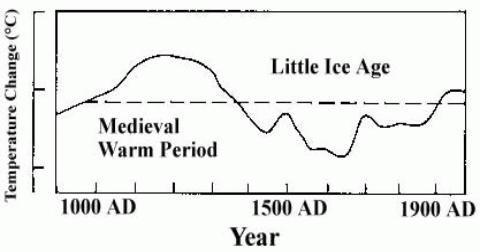
Such small temperature changes are quite consistent with the “hide the decline” graph, because that graph shows only small temperature changes prior to the 20th century. If the IPCC had persisted with their original estimate of earlier temperatureix …

… then the climate models would have been unable to replicate the temperature changes in either the MWP or the LIA, because the total effect of all natural factors (including TSI variation) allowed for in the models is far too small. If the climate models were unable to replicate the MWP and LIA, then they would lack credibility, and any scientific conclusions based on the models could be disregarded.
But it gets worse.
With the “hide the decline” graph representing global temperature, the climate modellers had only one factor which could give a sudden upward movement in temperature in the 20th century – CO2. This was the only factor whose pattern changed significantly then and only then. The IPCC analysis is based on “equilibrium climate sensitivity” (ECS), which is defined as the equilibrium change in the annual mean global surface temperature following a doubling of the atmospheric equivalent carbon dioxide concentrationx. The way ECS was arrived at was to map the 20th-century temperature rise to the increase in CO2 concentration : “Estimates of the climate sensitivity are now better constrained by observations.“xi.
The IPCC and the climate modellers still had a problem: the scientific studies on CO2, and the physical mechanism by which it warmed the atmosphere, gave an ECS which was far too low. But the discrepancy was explained by climate feedbacks. A climate feedback is defined as follows: “An interaction mechanism between processes in the climate system is called a climate feedback when the result of an initial process triggers changes in a second process that in turn influences the initial one. A positive feedback intensifies the original process, and a negative feedback reduces it.“xii
This leads us to clouds. The IPCC state repeatedly that they do not understand clouds, and that clouds are a major source of uncertainty. For example: “Large uncertainties remain about how clouds might respond to global climate change.“xiii There are many statements along these lines in the IPCC report. Now simple logic would lead one to think that clouds would be a negative feedback:- as CO2 warms the oceans, the oceans release more water vapour, which forms clouds, which have a net cooling effect (“In the current climate, clouds exert a cooling effect on climate (the global mean CRF [cloud radiative forcing] is negative).“xiv).
But the IPCC report claims that clouds are a massive positive feedback: “Using feedback parameters from Figure 8.14, it can be estimated that in the presence of water vapour, lapse rate and surface albedo feedbacks, but in the absence of cloud feedbacks, current GCMs would predict a climate sensitivity (±1 standard deviation) of roughly 1.9°C ± 0.15°C (ignoring spread from radiative forcing differences). The mean and standard deviation of climate sensitivity estimates derived from current GCMs are larger (3.2°C ± 0.7°C) essentially because the GCMs all predict a positive cloud feedback (Figure 8.14) but strongly disagree on its magnitude.“xv.
The IPCC provide no mechanism, no scientific paper, to support this claim. It comes in some unspecified way from the climate models themselves, yet it is acknowledged that the models “strongly disagree on its magnitude“.
So, to sum up, the situation is that the “hide the decline” graph leads to nearly all of the 20th-century warming being attributed to CO2, thanks to a factor (clouds) which is not understood, is not explained, and comes from computer models which strongly disagree with each other. The inevitable conclusion is that without the “hide the decline” graph, the clouds “feedback” as described in the IPCC report would not have existed.
Now, returning to Gavin Schmidt’s comment. When he talks about “the weight of the scientific evidence for the human influence on climate change“, a very large part of that evidence is the IPCC report and everything that references it. But as I have just shown, the IPCC report itself relies for its credibility on the “hide the decline” graph. In other words, the entire structure of mainstream climate science depends on a single work which is itself based on methods which are “not allowed” in science.
So of course there are, in Professor Beddington’s words, challenges on the speed of change. If the MWP, which was of course completely natural, was about as warm as today, then it is entirely reasonable to suppose that natural factors are largely responsible for today’s warm temperatures too, and that the speed of change from CO2 has been grossly overstated by the IPCC.
Mike Jonas
References:
1 There are number of different versions of this graph, in the various IPCC reports and elsewhere, where different versions of the proxy data have been used.
viii http://www.ipcc.ch/pdf/assessment-report/ar4/wg1/ar4-wg1-chapter2.pdf para 2.7.1.3
ix http://climateaudit.files.wordpress.com/2008/05/lambh23.jpg (I could not provide a link to this graph in an IPCC web page, because earlier IPCC reports are no longer linked there. http://www.ipcc.ch/publications_and_data/publications_and_data_reports.shtml)
xi http://www.ipcc.ch/pdf/assessment-report/ar4/wg1/ar4-wg1-chapter9.pdf Executive Summary.
xiii http://www.ipcc.ch/pdf/assessment-report/ar4/wg1/ar4-wg1-ts.pdf para TS.6.4.2
An excellent summation of the facts as I understand them. I will leave the scientific points of order to the more qualified readers of your great blog.
Excellent, concise dissection. There appears to be no reasonable answer to this but the spin will be entertaining.
The hockey stick always mattered. It was the central icon that this political project was sold on. Now we see how much it mattered to everything.
The assumption that the only factor which rises in the latter half of the 20th century is only ” valid” if you base your CO2 history on indirect Antarctic ice core data (known to be a violent process in reality and prone to CO2 losses for a variety of reasons) fused with direct CO2 data from a volcano in Hawaii (Mauna Loa). This is patently unacceptable and invalid scientifically, but there are also 80,000 direct CO2 chemical bottle measurements (a la E Beck) being specifically ignored and discounted.
Since when are direct measurements not as good as indirect? When the direct readings show periods of recent history (in the last 200 years) when CO2 has been higher than now. This cancels the CO2-warming connection, regardless of how the temperatures data and proxies have been adulterated. And, thus, it is required that other factors be considered, such as solar, clouds, ocean cycles, and the Easter Bunny.
He’s nicely framed my part of the discussion with this statement. Problem is, this is not the centrepiece of the sceptical movement. Not even close. The first problem is the globe has not warmed globally. It has warmed regionally, and only during certain hours of the day. We don’t yet know the cause but many suspect human contribution to CO2 in the atmosphere. Fine – prove it is unprecedented, and also unique and so, unusual, and that the trail of blame leads directly to humans. Explain why, even if humans stop releasing CO2, the level CO2 in the atmosphere will continue to grow, and explain what we do to stop that and why we should. Show your work. Be prepared to answer questions and defend your science.
But don’t frame my position – that is my job.
One small detail.
The author references problems with “Briffa-2000”. However, on close examination it looks as though that series runs through just fine (the light green line). The problem appears to be with the “Briffa-Osborn MXD” series which appears truncated (the light blue line with dashed lines overlayed connecting the two deleted portions of that series). IE9 has a neat magnification capability which helps bring out these hard to discern details.
It would seem apparent that an honest discussion about the true context of the “hide the decline” comment would be in order to really get at the meaning and intent when discussing its ramifications in any type of paper. This is especially true when bringing up the issue of truncated data, and reasons why it may be indeed a prudent thing to have truncated certain data. It gets rather discouraging to see quotes from discussion between professionals taken out of context, when the full meaning and intent among those professionals could be easily explained if non-professionals would truly understand the full context.
The “hide the decline” is of course referring to the apparent decline in temperature in the high northern latitudes as shown in in tree-ring data from about 1960. This divergence of reconstructed temperatures shown in tree-ring data after 1960 in HIGH NORTHERN LATITUDES diverges from the actual measured temperatures during this period, as there were actual measurements of temperatures during this period. This “problem” is known among professionals as the “divergence” problem. It is not as though anyone is questioning the rise in temperatures during the period, for we have actual measurements, but rather, these actual measurements did not match what the tree-ring reconstructions were showing. Obviously, there was something wrong with the accuracy of what the tree-rings were showing, and so the data was, quite justifiably truncated. This truncation was hardly ignored by the IPCC reports, as professionals were quite award of the “divergence problem” and it was discussed in the 3rd IPCC report in 2001 and in even more detail in the 4th report in 2007. Discussions about the divergence problem can be found here:
http://www.skepticalscience.com/Tree-ring-proxies-divergence-problem.htm
Discussions about the “hide the decline” comment, in full context can be found here:
http://www.skepticalscience.com/Mikes-Nature-trick-hide-the-decline.htm
It is, in my opinion, very dishonest at best to use the “hide the decline” comment to insinuate that there was any attempt at dishonesty, academic or scientific, but rather, the truncation of the data was valid, as everyone knew the truncated N. Latitude tree-ring reconstructions were wrong, and they would skew the data in an erroneous way. Before any discussion of truncated data can be included in any paper, one needs to look at the full scope of reasoning behind that truncation, and to do that, a discussion of the true nature of the “divergence problem” needs to be addressed.
Were he honest (!) he’d also mention the direction of change (for the next few decades).
Here’s an argument that using grey-body physics to analyse CO2 efficacy cuts its contribution to atmospheric temperature by a factor of 500:
http://jennifermarohasy.com/blog/2011/03/total-emissivity-of-the-earth-and-atmospheric-carbon-dioxide/
The claim is made that this tightly matches observations and engineering principles, as opposed to the Consensus Average of the 23 IPCC GCMs’ spaghetti graph “projections”. SoD and “gavin” weigh in with vociferous objections to the dissing of true GCM science. Etc.
It’s good to see Beddington moving on, in only a few weeks, from asking for ‘zero tolerance’ for climate sceptics to this new position. But it will be an even bigger step for him to come to terms with this excellent article. As someone said a few months ago, climbing down is easier than climbing up. We must do all we can to help the Beddingtons of this world, the most important of them being outside science, in politics.
By the way, the Global Warming Policy Foundation currently has an exquisite top post by Lord Turnbull which widens the duscussion of the article above.
All right if others have not I will start the ball rolling.
Read carefully the statements of Beddington and note the inconsistencies.
1. We do know that the atmosphere and the oceans affect the climate but not how or why because we cannot quantify it with any degree of precision: perhaps it keeps us warmer than we would otherwise be: or perhaps cooler. And calculations on the back of envelope using Steff Boltz and the rest do not tell us much.
2. What if any role CO2 plays in this is unclear and again cannot be quantified to any degree of precision: other than to say it must be minor to nonexistent.
3. It is undoubted that we are adding CO2 to the atmosphere by burning fossil fuels but again because we only imperfectly understand the enormous carbon cycle we cannot say what effect this has on global atmospheric levels of CO2. It might affect them or not: we have no way to tell.
4. Before you consider the speed of change you must define what change you are talking about. Which raises the question of exactly what change? there does not seem to have been much change in the weather or the climate beyond what we have seen before in recent times. So whence the speed? and of what?
5. As to the treenometers all that shows is that you can find a correlation over a period of time between almost any two variables: if you pick you period carefully. The need to truncate at either end simply demonstrates that there is no relation between correlation, and actual causation, that is temperature. It is an elegant demonstration that treenometers don’t work.
6. What the IPCC has considered or not is largely irrelevant, we barely understand the great natural forces which drive the enormous weather systems of our planet: and to imagine we can predict their effects beyond a few days let alone years or centuries is risible.
7. The earlier and serious work done on climate thirty years and more ago is essentially sound, yes there was a MWP and so on. We cannot quantify this very well, our proxies are too limited in terms of temporal and temperature resolution. But we can still see the Viking farms buried under the permafrost in Greenland.
In short we do not even understand enough to appreciate how little we actually know.
Written in haste so I apologise for any oversights.
Kindest Regards.
There are already enough observations to disprove the hypothesis of AGW. The hockey stick fabrication was absolutely necessary to show a correlation with emissions and temperature. The fact it had to be doctored to fit, the fact it didn’t show the well reported LIA and MWP and the fact that real world observations do not support the hypothesis should have been enough to falsify it utterly.
The fact that the hypothesis continues says much for the politics and the media let alone scientists who are too proud to admit their error. However every day this scam is allowed to persist costs the world any chance it might have of facing up to the real environmental problems and fi9nding non biased solutions.
The scientists involved in AGW may well have thought they had found something important and acted honourably. Now there is no doubt to perpetuate the lie is not simply a mistake or a case of hubris but blatant criminality. The AGW scam could be put to bed today if the likes of Phil Jones and Jim Hansen issued a press release saying they were wrong.
It is vital that scientists with expertise in associated disciplines be given the same access to data and journals as the chosen few. If that means on line peer review then so be it. It also means an end to scientific associations speaking of consensus among their members when it is obvious none exists.
Brilliant – the sceptic position cannot really be put much clearer than this.
As for the warmists, their basic arguments are based on the interpretations of deeply flawed/manipulated/fraudulent data, combined with an almost complete disbelief in natural climate cycles. These arguments include the deliberate misinterpretation (a spurious theory which cannot be proved otherwise, except by the application of reasonable logic) of the ‘feedback’ from cloud formation – a cornerstone of warmist theory for which there is absolutely no foundation.
“We must act now against climate change” has got to be one of the stupidest things to ever spout from a warmist or politician’s mouth. Climate change is completely natural – it’s been happening for hundreds of millions of years and it will continue to happen for hundreds of millions of years. The Earth will get hotter and it will get cooler, but there will not be any massive heating up of the climate, until the next super-continent is formed in a couple of hundred millions of years from now.
Mankind can do virtually nothing about climate change on our planet, short of creating a nuclear winter after a full blown atomic war.
Many of the major western economies are in a dire state (USA, UK and much of the European Union) due to the irresponsible/wasteful spending policies of politicians prior to the recent economic crisis. Loading these tottering economies up with further tax burdens to support bloated bureaucracies and welfare systems on the basis of a ‘science’, whose practices would not be accepted in any real scientific field, is simply insane.
This article will undoubtedly provoke some warmist comments – it is always amusing to see how they defend the indefensible logic of their position.
TFN Johnson says:
March 27, 2011 at 10:16 pm
It’s good to see Beddington moving on, in only a few weeks, from asking for ‘zero tolerance’ for climate sceptics to this new position.
Yes, I heard Beddington use the term ‘climate denier’ several times in an interview for BBC radio. He also claimed that deniers were solely responsible for the decline in CAGW belief and if only he was not forced to debate these ‘climate deniers’ then all would be well. It speaks volumes of the mans intent when he uses the term ‘climate denier. Nobody denies we have a climate, the fact that he so openly attempts to misrepresent his political enemies shows us who we are dealing with.
Mr Beddington is a thoroughly nasty and unpleasant individual, a typical CAGW alarmist and in fact he has been a primary agent in the spread of this malignant theory and owes his high position not to his qualifications in chemistry but his fanatical support of CAGW theory. This man has more in common with Trofim Lysenko than with with Robert Boyle and if I ever meet him in person I will tell him so.
I have three points:
(1) expand CO2 to read carbon dioxide whenever it appears
(2) in relation to feedbacks from clouds – your comment is quite weak.
You only talk about common sense or somesuch, which is not scientific.
Roy Spencer had done a lot of work on feedback and has shown that it is negative, rather than positive.
While it is not peer reviewed, at least it describes scientific research by Professor Spencer who is the lead scientist for NASA in the management of the satellite system which measures atmospheric temperature.
No work of this kind can ignore Roy Spenser’s findings.
(3) it is often said that this is the hottest decade “ever” or at least since instrumental measurements of temperature began.
That claim should also be challenged.
There was a post at WUWT several months ago, which showed that up to ten tears ago, the GISS series showed that the 1930’s was the hottest period.
In the intervening years, the temperature data for the 1930’s has been lowered by very small increments, year by year, until now it is well below current values.
That should be strongly emphasized as bringing the whole carbon dioxide is the sole controller of climate” story into complete disrepute.
You should be able to find this item by searching WUWT.
In high level real world mathematical modelling for a model to be validated, it must back predict on the hypothesised main variables (ot variable functions) against the reality measured.
I leave the physics to physicists. This is a journey man mathematical test. if you can’t accept this mathematically then your degree should be revoked. If the models can’t back account for MWP and LIA, then they fail. No if buts or maybes they are missing variables or inaccurately reflecting variables and functions of variables.
Many interesting concepts outside of the futile experiment of post modern science have been developed because of skepticism, not contrived consensus. This is the only bright part of the debate.
“The IPCC and the climate modellers still had a problem: the scientific studies on CO2, and the physical mechanism by which it warmed the atmosphere, gave an ECS which was far too low. But the discrepancy was explained by climate feedbacks. A climate feedback is defined as follows: “An interaction mechanism between processes in the climate system is called a climate feedback when the result of an initial process triggers changes in a second process that in turn influences the initial one. A positive feedback intensifies the original process, and a negative feedback reduces it.”
From memory, and I am sure a blog or two will have the cite, the IPCC was happy to explain the somewhat low temps as being caused by aerosols which were, in the 80’s and 90’s lessened in the NH by more stringent pollution controls. This was the explanation for the “too low” temps in the 50’s through 70’s.
But my memory may be incorrect.
As well, were I reviewing the paper I would want you to make your claim “But as I have just shown, the IPCC report itself relies for its credibility on the “hide the decline” graph.” even more express and, more importantly, deal with the claims by the IPCC that a whole host of observations – sea ice, glaciers, plant and animal habitat – all point in the direction of significant climate change. I see your point vis a vis the strong CO2 claim; but the ankle biters will be out in force on this and you need a bullet proof argument.
good grief.
TFN Johnson says:
March 27, 2011 at 10:16 pm
“It’s good to see Beddington moving on, in only a few weeks, from asking for ‘zero tolerance’ for climate sceptics to this new position. ”
Hmmm, it seems Beddington will be on the BLACKLIST now?
Anyway, it is all too late;
http://thescotsman.scotsman.com/latestnews/Brown-Fifty-days–to.5747301.jp
haha!
To be more specific about cloud feed back, you said in part “Now simple logic would lead one to think that clouds would be a negative feedback …..”
R. Gates in a comment above states that “It gets rather discouraging to see quotes from discussion between professionals taken out of context, when the full meaning and intent among those professionals could be easily explained if non-professionals would truly understand the full context.” UNQUOTE
I see that you have already read the analysis by Steve McIntyre, who has over the years put the “hide the decline” comment into proper context. His latest work can be found at:
http://climateaudit.org/2011/03/23/13321/#comments
‘‘It’s unchallengeable that CO2 traps heat and warms the Earth and that burning fossil fuels shoves billions of tonnes of CO2 into the atmosphere,”
Seems to be a lot of academic discussion about the graphs which is pointless without verification of the above statement that “CO2 traps heat” in the atmosphere. Just why is this statement “unchallengeable”?
R Gates – the first link you give, http://www.skepticalscience.com/Tree-ring-proxies-divergence-problem.htm, says “Tree-ring growth has been found to match well with temperature and hence tree-rings are used to plot temperature going back hundreds of years. However, tree-rings in some high-latitude locations diverge from modern instrumental temperature records after 1960. This is known as the “divergence problem”. Consequently, tree-ring data in these high-latitude locations are not considered reliable after 1960 and should not be used to represent temperature in recent decades.“.
Surely this means that they should not be used, period. If the tree-rings have been found not to match temperature over any significant period, eg. 1960 onwards, then the tree-ring data is necessarily unreliable over all periods. You can’t just pick the bits that line up and say they are reliable, while rejecting the bits that don’t line up. That’s cherry-picking.
And please note : Neither of your links addresses the deletion of data before about 1550, or the deletion of the instrumental record up to about 1900.
In relation to the 1930’s being hotter than at present, here is one reference to an article by Ryan Maue which provides the relevant details.
http://wattsupwiththat.com/2011/02/15/controversial-nasa-temperature-graphic-morphs-into-garbled-mess/
Mike Jonas, you demonstrate some logical weakness which, if cleaned up would strengthen your conclusions.
A more accurate statement would be everything it references, as the report references hundreds if not thousands of documents, some documents which may be more important or accurate than others. It doesn’t matter that people point to the IPCC report as authoritative as it is primarily derivative.
You need to deal with this issue, the actual edifice of evidence being relied upon by AGW proponents, and not dismiss it with a hand wave that it’s just the IPCC. Despite the contempt many hold the IPCC, this is not enough to make a case.
No, and if you don’t know why the above quote is wrong, you have much research to do. Much, if not most, of the research is severable from the work of Mann, Briffa, and Jones. I’m not saying it’s valid, just that much of it stands without this single line of evidence.
R. Gates;
Obviously, there was something wrong with the accuracy of what the tree-rings were showing, and so the data was, quite justifiably truncated. >>>
C’mon sir Gates, you’re really twisting yourself in knots to justify this one. The temperature record runs from about 1880 to current, and based on that they “justifiably”truncated data that didn’t agree with it. Oh, the data with no temp record to verify against for 900 years before that is all OK though, just trust us.
Ooooops, it turns out we truncated some data from back then too. No temp record to justify it, we just decided it was wrong. We knew it was wrong because….well it was either that or WE were wrong, so obviously….
Gimme a break.
Review:
then the climate models would have been unable to replicate the temperature changes in either the MWP or the LIA, because the total effect of all natural factors (including TSI variation) allowed for in the models is far too small. If the climate models were unable to replicate the MWP and LIA, then they would lack credibility, and any scientific conclusions based on the models could be disregarded.
Where is the evidence to support that the GCM’s cannot replicate the MWP or LIA? Despite the fact that warmists tend to ignore them, this statement seems unsupported.
Equilibrium Climate Sensitivity
This is generally regarded as the very long term that includes the total warming of the oceans to the new equilibrium temperature. Transient climate sensitivity involves year to year increases in CO2 levels to a new higher level. This is strongly used to explain why warming is delayed since this better represents the behavior in the real world.