By Steve Goddard
Summer has come to a premature and frosty end at Santa’s workshop.
")
http://psc.apl.washington.edu/northpole/webphotos/noaa2.jpg
It has been the coldest summer on record north of 80N, and temperatures have dropped below freezing ahead of the average date.
")
The entire ice covered region is now below freezing.
")
http://www.esrl.noaa.gov/psd/map/images/fnl/sfctmp_01.fnl.gif
It also appears that the summer melt season will be the shortest on record. The maximum was reached very late in March, and it appears likely that we are headed for an early minimum.
")
Mark Serreze at NSIDC has stated :
As the climate warms, the summer melt season lengthens …”
He was also reported as saying :
Mark Serreze of the center forecast the ice decline this year (2010) would even break 2007’s record.
Another interesting fact is that we are almost certain to see a large increase in the amount of multi-year ice (MYI) next year. The reason being that almost all of the 1-2 year old ice (turquoise) in the NSIDC map below will become classified as MYI next spring.
")
We have seen a remarkably rapid recovery from the 2008 low volume.
PIOMAS continues to report record low volumes of ice, despite all evidence to the contrary. The image below shows in red how far off the mark their August 15 forecast was. Their modeling error will get much worse over the next two weeks – because they model much of the thick multi-year ice in the Beaufort Sea and Arctic Basin as only a few tens of centimetres thick.

With the cold temperatures, ice area loss has almost stopped.

http://arctic-roos.org/observations/satellite-data/sea-ice/observation_images/ssmi1_ice_area.png
However, ice extent continues to drop – because the Arctic Oscillation has turned negative and winds are compacting the ice towards the pole. This bodes well for continued growth of ice in 2011.
")
http://www.ijis.iarc.uaf.edu/seaice/extent/AMSRE_Sea_Ice_Extent.png
PIPS shows average ice thickness increasing, due to the compression of the ice.
")
There has not been a lot of ice loss during August. The modified NSIDC image below shows in red, areas that have lost ice since August 1. Note that the Greenland Sea appears to have lost ice. This is due to the fact that there has been very little transport out of the Arctic Basin through the Fram Strait, which again bodes well for ice gain in 2011.

The modified NSIDC image below shows ice gain since 2007.

NSIDC maps continue to show more gain (16%) than their graphs (10%.) I have not been able to get a satisfactory explanation from them about the cause of that discrepancy. DMI shows a 25% gain in 30% concentration ice over 2007.
My forecast (dashed line below) minimum of 5.5 million (JAXA) continues to look conservative. It all comes down to what the winds do over the next few weeks. If the winds keep compressing the ice, the minimum may go a little below 5.5. If the winds quiesce, the minimum may come in a little above 5.5 – which is looking like a pretty good number right now. Some people at NSIDC started out with a 5.5 forecast this year, but seem to have backed away from it since.

Academic theories about the Northwest Passage becoming a commercial shipping opportunity appear pretty clueless.
“The plans that you make can change completely,” he says. This uncertainty, delay, liability, increased insurance and other costs of using the Northwest Passage are likely to deter commercial shipping here. A ship with a reinforced hull could possibly make it intact through the passage. But if it got stuck, it would cost thousands of dollars for an icebreaker like the Amundsen to come to the rescue. So even if the Northwest Passage is less ice-choked than before, the route may not become a shipping short-cut in the near future, as some have predicted.
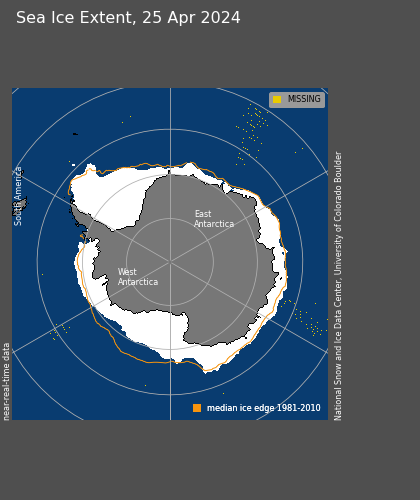
The South Pole will almost certainly set a record for most sea ice this season. It is almost there, and there are still several months of growth remaining.
")
http://www.iup.uni-bremen.de:8084/amsr/ice_ext_s.png

http://nsidc.org/data/seaice_index/images/daily_images/S_daily_extent.png
As seen below, the symmetry between the North and South Pole is impressive through the satellite record. They always seem to move opposite each other and produce an approximately constant amount of sea ice. It would be nice if the experts focused on solving this relationship rather than making up forced explanations like the “Ozone Hole” – which has just started forming for the year and will be gone before Christmas.

UIUC North/south anomalies overlaid on top of each other.
http://arctic.atmos.uiuc.edu/cryosphere/IMAGES/seaice.anomaly.arctic.png
http://arctic.atmos.uiuc.edu/cryosphere/IMAGES/seaice.anomaly.antarctic.png
(Note to posters and ice experts. Before you embarrass yourself making comments about how seasons are out phase at opposite poles, remember that this is normalised data and the period is in excess of 30 years.)
Conclusions:
The “long term trend” (30 years) in Arctic ice continues to be downwards, and would be even if the ice minimum was a record high this summer. But the three year trend shows strong growth of extent, thickness and age. Meanwhile, Antarctic ice is blowing away the record books. Yet the press continues to spread massive disinformation about the state of ice at both poles. Who could possibly be responsible for that?
Sponsored IT training links:
Get COG-112 materials along with 352-001 dumps to practice and pass 000-977 exam in timely and cost saving manners.
Morning Gates
Great article, please keep pushing on the disparities between different sea ice measurements. How can they differ so much? Also, the data that is most striking is the sea ice thickness in the Arctic in 2007, when supposedly we had little ice. As you have stated previously, the thickness makes up for the lack in extent, even in 2007.
Amazingly bad science by the national labs here, only eclipsed by Mann and possibly the idiots using proxies for sunspot number/solar output.
Something must have happened in the atmosphere or sea currents have been changed. Otherwise I find no explanations for it.
How will they spin the outcome to make it consistent with the orhodoxy if arctic ice extent and area are greater than in 2009? It will be easy to state the trend towards ice-free arctic continues if they are less. I can already picture all the reports and “studies” claiming that 2008 and 2009 were mere blips in a long-term trend!
Steve, the maps show even more Global Sea Ice extent then yesterday.
http://arctic.atmos.uiuc.edu/cryosphere/IMAGES/seaice.anomaly.arctic.png
Arctic: -1.294, up by almost .6 in a day.
Antarctic: 1.451, up by 1.5 in a day, approaching a record high, AGAIN
http://arctic.atmos.uiuc.edu/cryosphere/IMAGES/seaice.anomaly.antarctic.png
Global Sea Ice is Above Normal, to a modest proportion.
http://arctic.atmos.uiuc.edu/cryosphere/iphone/iphone.currentarea.global.html
-Snowlover123
Can you explain why pips shows latitude circles so clearly? I mean, I’ve heard it’s a model and not data. I might think that it shows thickness increasing because of date not fact. Also, there is only the arctic basin ice remaining and not many isolated melting areas. But the less ice border there is, the less thin ice there is, of course, which means average thickness increasing. But you say:
“PIPS shows average ice thickness increasing, due to the compression of the ice.”
Couldn’t you say a bit more about this? How are the pips thickness numbers construed? Further, wasn’t it deviced long ago by the same people who have now studied the phenomena 20 more years and are now at the NSIDC claiming thinning of the ice?
Browsing the Arctic temp here:
http://ocean.dmi.dk/arctic/meant80n.uk.php
This is unlike any other mid-August EXCEPT 2001. I wonder if there’s anything to be learned from looking at how the ice behaved in late August 2001.
However, this year, there is a second unusual effect — no ice is migrating through the Fram Strait right now. I don’t know how unusual this is but I’ve never seen a gap like that before.
http://nsidc.org/data/seaice_index/images/daily_images/N_daily_extent_hires.png
This could have big implications for next year.
5.5 million?
The Arctic would have to set a record low melt for the period August 14 to September 15. Slim chance, but can’t be excluded of course. I think we’ll get closer to 5 million.
Ahhh, but no need to worry, the folks funded by our tax dollars continue to push the AGW meme – why in the world would the videos available only show the period to 2006, and only in the Arctic? Hmmmm….why would that be….?
http://arctic.atmos.uiuc.edu/cryosphere/
Any thoughts on what this portend for the continental US this coming winter? I’m think early…
Where did you get the data for the last (red and green) graph? I am interested in shifting one of the data sets by 6 months to see how well they follow each other — just out of curiosity. — John M Reynolds
I don’t see any indication of significant melt occurring. It is compaction, not melt, we are seeing.
Hoskald-
I have asked this previously, it might make sense that a cold, early Arcitc would lead to a cold NA, but, noone has ever answered…
Mind experiment:
The map Frederick linked to shows that during the period when “average” was calculated, ice generally invaded Fram Strait and showed up as ice extent, even though it was likely on its way leaving for warmer waters. The Arctic Oscillation and weather systems likely set up a wind pattern that forced ice South in order to accomplish this. This tells me that during the period when “average” was calculated, it would be instructive to see how often the wind blew ice south compared to when the wind blew ice north.
So it stands to reason that if there is a multi-decadel pattern to this wind shift, and the wind begins to generally blow ice north year to year during the Summer, the Arctic will gain ice during the Winter. Lots and lots of ice. Now, during the winter when melting is not a concern, if Arctic cold air invades the lower latitudes, WE will gain ice. Lots and lots of ice. Rivers could begin to freeze from the bottom up and Lakes from the top down. This type of thing causes ice jams and frozen flooding, and is cold enough to freeze sewer systems. All of these things are indeed cause for regional-wide crisis management, and usually all winter long, not just during a “cold spell”.
One of the tenets of ice buildup (some call it recovery) says that lack of summer melt is the best indicator of an eventual return to abundant Arctic ice. I don’t know why they call it a “recovery” because under the above circumstances, the Earth’s flora and fauna struggle to recover from ice buildup, and some do not.
Steve,
Great post.
This year’s arctic sea-ice has been a continuation of arctic ice growth since 2007. Looking into the future (5-10-30 years) could 2007 be a local arctic sea-ice minimum with following years showing ever more arctic sea-ice? Antarctic sea-ice is high in comparison to the records for the last 30 years. I realize it is highly speculative to say this, but what if we are at a turning point in global temperatures?
The melt ponds are have frozen solid in front of the NOAA pole cam and if they have frozen then its certain that all the other melt ponds are also frozen or freezing.
So much for the positive feedback theory as dictated by our esteemed colleague R Gates in which melt ponds would absorb the suns energy and melt the surrounding ice. So the melting is not coming from below which was always the fall back position and its not coming from above so expect lots more fire’N’floods and no sea ice news.
I would have thought that the early freezing of the ice would make compaction less certain though a close inspection of a polar ice image would sort that out.
There will of course be an MSM blackout of the events in the Arctic unless it can be claimed that the ice is experiencing a death spiral. The evidence is showing an end to the melt season and it will be very interesting to see how the MSM and NOAA spin it.
But, but, but … I thought we’d reached a ‘tipping point’ in 2007?
Joking aside, very interesting ice update, and I must confess that the ice updates on this site are my favorite ongoing reports. Keep up the great work.
Casper says:
August 15, 2010 at 6:59 am
Something must have happened in the atmosphere or sea currents have been changed. Otherwise I find no explanations for it.
One guess – the AMO is starting its sinusoidal downturn from the top. Barents sea temps match the sinusoidal AMO quite closely. This could reduce Atlantic drift warm water input to the Arctic.
See:
http://wattsupwiththat.com/2009/10/08/new-paper-barents-sea-temperature-correlated-to-the-amo-as-much-as-4%C2%B0c/
BTW in a thread this spring when arctic air temps were high, many pro-AGW posters were arguing that air temps determine thickness. It makes sense that air temps influence thickness. Air temps right now would indicate thickening of the ice.
Anthony,
Sorry for addressing my post to Steven! I should wake up before hitting enter!
Here is another break up of Sea-Ice:
http://ocean.dmi.dk/arctic/images/MODIS/Joekelbugt/20100809AQUA.jpg
650 KM2 according to DMI
If they really want a commercially viable Northwest passage, why not build some nice efficient, reliable thermal powerstations up there with some big heating pipes to melt the ice?
They could even tap into all the methane they reckon is under the ice.
Ridiculously expensive, of course. But more affordable than going to a ‘low carbon economy’ NOW. And the plants would LOVE some extra CO2!
I’m assuming the overlaid anomalies are area? You would think that some researcher somewhere would be all over this. As I understand it, the argument has always been that the arctic and antarctic would behave differently because you have water surrounded by landmasses in the north and a landmass surrounded by water in the south. I could see the antarctic responding to AGW at a slower rate than arctic just due to thermal mass of the ocean but for the poles to respond in different directions would seem to imply another mechanism at work.
With the temps below freezing in the arctic, if the winds continue to compact the ice (if they’re not blowing things out of the basin or too strong) then we should see an increased divergence between the area and extent. So we might see the area increase while the extent is still decreasing.
The next question is how far south is the freeze line extending and what’s the rate of change.
Steve,
What are the correlation numbers between the monthly Arctic and Antarctic anomalies? Before you make claims about “symmetry” between the two, you really need to at least do a basic correlation calculation.
In NSIDC’s monthly extent data, it is about -0.16 – essentially uncorrelated.
Walt Meier
NSIDC
Also, the article that says Mark Serreze forecast this year would break 2007’s record is not a direct quote and is incorrect. Mark is not a forecaster, so he didn’t forecast anything. Second, I’ve never heard him say that we would break the record; he may have said “we could break the record”, which was a possibility.
walt
Here is what the “experts” are prognosticating:
http://www.arcus.org/search/seaiceoutlook/2010/july
For Details click on “Pan-Arctic”.
The Wegener Institute (who know about Eisdeckendicken thanks to Polar 5): 5.56
Hadley Center: 5.5
Meier at al (NSIDC): 4.74
I stick to my prognosis from last year: 5 (because it has never grown 3 years in a row)