By Steve Goddard
July 4, 2010. Celebrating independence from traditional sources of polar ice news.
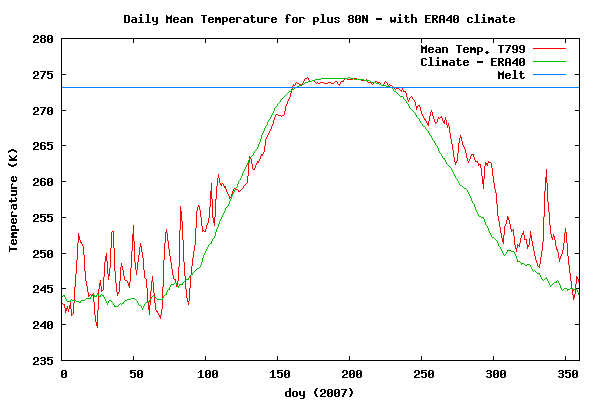
Last week we discussed the importance of wind in determining the summer minimum. In 2007, the winds blew consistently from the south and compacted the ice towards the North Pole. This led to a tremendous amount of news coverage claiming that the Arctic was heating and melting. In fact – the spring and summer of 2007 was slightly cooler than normal for about half of the melt period north of 80°N, according to DMI (below)

http://ocean.dmi.dk/arctic/plots/meanTarchive/meanT_2007.png
Around mid-June of this year, the winds in the Arctic set up in a similar pattern – spiraling inwards and pulling the ice away from the coast. This led to an early decline in ice extent inside the Arctic Basin.

Towards the end of June, this pattern reversed and now the winds are circulating counter clockwise – pushing the ice towards the coasts. As a result, there has been very little change in extent inside the Arctic Basin over the last week.

You can see the changes in extent in the modified NSIDC map below. Areas marked in red show extent loss since June 27, and green shows extent gain.

Most of the ice loss over the last week has been in the Hudson Bay, which nearly melted out a few days ago. As a result of the Hudson Bay being depleted of ice and the changes in wind, we have seen the JAXA and DMI graphs take a break in slope.

http://ocean.dmi.dk/arctic/icecover.uk.php

http://www.ijis.iarc.uaf.edu/seaice/extent/AMSRE_Sea_Ice_Extent.png
Since July 1, there has been almost no ice loss in the Arctic Basin, as seen in the modified NSIDC image below.

The video below shows the wind and ice patterns over the last two weeks, culminating in a strong counterclockwise flow.
The modified NSIDC image below show differences between 2010 and 2007. NSIDC still shows 2007 ahead of 2010, but the differences are mainly in the Hudson Bay and other areas that normally have little or no ice in September. In the Arctic interior 2010 has more ice (green.)

Last week I made the forecast below for the remainder of the summer.
The image below shows current JAXA in pink vs. my forecast. So far, the forecast is right on track.

Temperatures north of 80N have been running slightly below normal for several weeks. The summer melt season is nearly half over. There are less than 60 days remaining of possible melt in the high Arctic.
")
http://ocean.dmi.dk/arctic/meant80n.uk.php
Temperatures in Barrow have also been running below normal. It appears quite possible that the landfast ice breakup date at Point Barrow will beat the record for the latest ever (July 10.)
Meanwhile down south, as Anthony pointed out, Antarctic sea ice is at a record high for the date.
")
Global sea ice is close normal.

http://arctic.atmos.uiuc.edu/cryosphere/IMAGES/global.daily.ice.area.withtrend.jpg
So what do the experts tell us?
The North Pole has become an island for the first time in human history.
Leading ice expert says entire Arctic Ocean sea ice may be gone sometime between August 8th and September of this year. (H/T to Tom Moriarity.)
Hopefully Lewis Pugh is waxing up his kayak to take advantage of the clear paddling to the North Pole next month.
On this July 4th, we celebrate the freedom provided by the Internet to propagate the accurate information which governments apparently don’t want us to know.
Happy Fourth!
“The North Pole has become an island for the first time in human history.”
Or in-human history for that matter. When did we get land up there?
Washington:
“Conditions this year have been difficult for our growers across Washington, from Clark County to Okanogan,” Gregoire said. “Cold temperatures have harmed our tree fruit crops, while excessive rain made it difficult for bees to pollinate strawberries and other berry crops. A declaration will help our businesses absorb a difficult year and look forward.”
The request includes disaster declarations for Adams, Benton, Chelan, Clark, Columbia, Cowlitz, Douglas, Franklin, Grant, Grays Harbor, Island, King, Kitsap, Kittitas, Klickitat, Lewis, Mason, Okanogan, Pacific, Pierce, San Juan, Skagit, Skamania, Snohomish, Thurston, Wahkiakum, Walla Walla, Whatcom and Yakima counties.
Idaho:
As the dawn of last Saturday unfolded, the light fell upon mealy apples still clinging to trees whose leaves had turned blackish-brown, ready to fall without glorious fall colors.
Mother Earth had struck again, with record low temperatures reaching the low 20 degrees Fahrenheit, and down into the teens and lower in the subsequent nights.
Wayne Shull, a Washington State University agricultural research technician, said the Tukey Horticulture Orchard on Airport Road in Pullman saw temperature get down to 12 degrees Fahrenheit.
off topic (but vaguely arctic related):
I’ve been checking activity near the Katla volcano (under the myrdalsjokull icecap) every day for the last month, and it seems to me that activity under the western edge of the crater has been increasing a lot in the last week:
http://en.vedur.is/earthquakes-and-volcanism/earthquakes/myrdalsjokull/
Steve, Anthony and all at WUWT, HAPPY 4th!
You just keep posting up that great information, there are so many who greatly appreciate it. (hope you even got a chance to look at that de-sine waved data and graph, it’s a real eye opener, maybe you could include some in a future post (but careful how you word it!). It’s amazing what the same data looks like when you remove all unnecessary information from it, that’s proper science though some will disagree who tend to obfuscate.)
It would be more fun if you could provide use with an Anu-Phildot-Gates forecast alongside yours. Do you think they play along?
ditto
Happy 4th. Here is a more informed overview of Antarctic climate:
http://www.pewclimate.org/global-warming-basics/antarcticfactsheet
If these polar experts don’t stop digging there could be serious climatic changes. Don’t they know it’s millions of degrees down there?
robert says:
July 4, 2010 at 11:45 am
‘off topic (but vaguely arctic related):
I’ve been checking activity near the Katla volcano’
If that scares you, take a look at the Tjornes fracture zone – large or the Reykjanes ridge. Many more and much stronger quakes in those areas.
You know, by that video of 2007, did that reversal of circulation just move much of the ice into open sea where the extent or concentration was less than the XX percent cutoff? You know, same ice quantity but spread thin enough that it was then below the cutoff percentage and therefore ignored?
I guess I’m asking whether the actual data values you download and the drawn maps handle thinly-spread-out ice differently.
But but but …. I was told that you don’t talk about the Arctic ice because it is too inconvenient.
Nice presentation, Steve. Every time I read one of these presentations, however, I keep asking myself what the contribution of ice-breakers is to the “melt”. I’m a lazy kind of guy and keep hoping someone else will take an interest in the topic and dig out the data, which does not seem to be readily available. Using arctic sea-ice as a proxy for global warming is a bit disingenuous when the Northern Nations are busy keeping the sea lanes open. Just how successful are they?
Another nicely done update Steve. I think your freedom from traditionally sources of information is a great way to celebrate the 4th. Well done on your forecast for the trend line– it certainly looks good for the time being, and I think the actual sea ice may track your trend for a few days at least. I do however, feel the the actual extent will start to fall below your forecast later in the month, and then well below in August. Forecast SST’s and land temps in the Arctic region look to be running high for the rest of the summer:
http://iri.columbia.edu/forecast/sst/10/glbbld_JAS_jun2010.html
http://iridl.ldeo.columbia.edu/maproom/.Global/.Forecasts/.Temperature/
And these, more than a possible developing La Nina in the tropical Pacific, will help to dictate the pace of the melt, along with the seemingly persistent dipole “anomaly” in the Arctic, that looks to be very strong later this month and into August. (partially the reason why the SST’s in the Arctic area will be higher).
If the DA does persist:
http://www.agu.org/pubs/crossref/2009/2008GL036706.shtml
Later in July and into August, strong meridional winds will blow from both the N. American side and the Siberian side to cause the melt.
Be that as it may, no matter whose forecast is closer, mine or yours, we are all still well below what the bulk of AGW models were predicting for summer minimums just a few years ago:
http://www.wunderground.com/hurricane/2009/stroeve.png
And so, afterall, what we are really talking about here on these time scales is weather, which is interesting of course, but nothing that happens this summer will indicate in any way that the Arctic sea ice is recovering on a longer term basis– as you so eloquently pointed out in one of your previous posts.
July 3 – snow overnight on the top of the Adam’s Plateau (melted before noon, but still). It’s the first time I’ve seen it since moving to the Shuswap Lake area of the south central BC interior. It’s been very cool this spring and early summer. Normally the strawberry season in this area is nearing it’s end and this year it hasn’t even hit peak yet. Everything is late. Just too cool for good growing.
Mike
“Slower” warming is the opposite of cooling. That article had the standard climate science weasel words.
Hansen forecast near symmetrical warming at both poles.
http://pubs.giss.nasa.gov/docs/1988/1988_Hansen_etal.pdf
Plate 4
robert says:
July 4, 2010 at 11:45 am
Dont say that, Robert! I’m going on vacation shortly, and I plan to go by air.
Ash is not included in our plans.
R. Gates
The actual trend line is tracking slightly above mine. I am concerned that my forecast is too conservative, given the change in wind patterns.
Wade
Yea, people normally complain that I ignore Antarctica. The problem with Antarctica is that the ice just keeps growing. That is why some climate scientists mumble nonsense about ozone and “slower warming” and “collapsing ice shelves” and “collapsing WAIS.”
Since they have nothing intelligent to say about the consistent asymmetry between the two poles, they pull explanations and whacky theories out from where the sun never shines.
wayne
The video is of 2010.
R Gates,
During the winter of 2007-2008, most of the multi-year ice out into the Atlantic. Under any circumstances it would have required a few years for ice thickness to build back up.
So long-term model forecasts from prior to 2007 are based on the wrong boundary conditions.
wayne
I don’t modify any data. The PIPS videos are made by combining and animating maps taken off the PIPS web site.
R. Gates says:
July 4, 2010 at 12:28 pm
In this case, it works the other way. Nothing that happens up there in the summer detracts from the cooling globe.
Winter, and the persistence of that season, will decide.
The Swiss Cheese is not the Arctic Ice, but the whole bandwagon of AGW.
Robert E. Phelan says:
July 4, 2010 at 12:23 pm
Nice presentation, Steve. Every time I read one of these presentations, however, I keep asking myself what the contribution of ice-breakers is to the “melt”. I’m a lazy kind of guy and keep hoping someone else will take an interest in the topic and dig out the data, which does not seem to be readily available. Using arctic sea-ice as a proxy for global warming is a bit disingenuous when the Northern Nations are busy keeping the sea lanes open. Just how successful are they?
Last I read some of the ice breakers (U.S. I think) are actually iced into their harbors and will not even be able get out this season! (to some that’s just local weather since it includes no heat… ROTFL, it’s a holiday! 🙂 )
“On this July 4th, we celebrate the freedom provided by the Internet to propagate the accurate information which governments apparently don’t want us to know.”
AGW is the perfect topic in which to observe that the progressive agenda is intolerant to freedom, and the free, honest, rational exchange of ideas and opinions. God Bless America. May she always be free.