A couple of days ago I sent this email to Jeff Id of the Air vent, as he quite familiar with Antarctic surface temperature analysis, having outed the many problems with the Steig et al “Antarctica is Warming” paper, demonstrating poor statistical techniques used by Steig, with help from Michael Mann.
On Fri, Dec 11, 2009 at 3:11 PM, Anthony Watts wrote:
Subject: can you replicate this?
http://savecapitalism.wordpress.com/2009/12/11/ghcn-antarctica-careful-selection-of-data/
Best regards,Anthony Watts
Jeff replied yesterday with:
I can replicate it. The story behind this one is in the detail, which I’ve wasted a whole Saturday on.
Indeed the Devil is in the details, the details that few people, apparently including the scientists, bother to look at.
Jeff posted an excellent essay on the subject:
GHCN Antarctic, 8X Actual Trend – Uses Single Warmest Station
Excerpt:
The red circle is surrounding Rothera Point station.

So as we can see, of all the stations available in the antarctic, GHCN has chosen to use a single station on the Antarctic Peninsula to represent an entire continent of the earth for the past 17 years (red circle). But it’s not just any station, it’s a special one. Rothera Point has the single highest trend of any of the adjusted station data.
Notice that the station is on the Antarctic peninsula, I’ve always said that using stations here to represent trends on the main body of the Antarctic continent is plain wrong, becuase the peninsula is in a different climate zone. See my discussion here and Jeff Id’s proof of it here.
I’ve also said time and again that most manned stations in Antarctica would be “urban” compared to the surrounding area. There’s no small towns, farms, pastureland, woods, etc to compare to. Just millions of square miles of snow an ice. The research stations are the metropolises of Antarctica, each a warm pocket of humanity due to land use change and energy expended to keep warm.
For example, this picture on a postage stamp from Australia’s Mawson Station, celebrating the Australian Antarctic Territory in 1997, may help you visualize the issue. Note the Stevenson Screen near the “living pod” on the right.

Here is the larger photo of the first day of issue card, the Stevenson Screen is also just visible above the snowbank in the lower right. Rather close to human habitation I’d say. Looks like its near a small AHI (Antarctic Heat Island). More here

Click for larger image
I suspected similar problems might exist at Rothera, so I started looking around to understand what the measurement envirionment is like down there. First stop, Google Earth:

Looks cold, obviously taken in winter. But I also noticed something peculiar, that “tongue” that sticks out at the top of the photo. I showed my wife the photo without saying a word about it saying only “What does this look like to you?” Her one word answer: “airport”.
Yep and obviously not a naturally occurring one either. You can see that there has been infill between the point and Adelaide Island. I wondered what it looked like years ago? I found this photo in Google Earth’s Panoramio, circa 1976:

Looks rather sparse, few buildings, with no indication of a runway. Compare that to another Panoramio photo from a similar vantage point taken in 2007:

Obviously the photo above was taken in summer. Looks like there has been some growth and land use change since 1976, inlcuding adding the runway with locally available materials. Given the dark albedo, and the mostly volcanic history of the Antarctic peninsula, it seems likely that the “local materials” would be volcanic rock.
Here’s closer view of that rock, from “Claire of the Antarctic”

Here’s another photo from Panoramio, a large panorama, which shows the entire Rothera station and the full length of the runway from sometime in 2008 or early 2009, based on the upload date listed. I’ve corrected the extreme fisheye effect in the original image and cropped a closer view for better presentation here.

Here’s a link to the full sized lens corrected panoramic image. Warning quite large at 5463 × 709 and 0.6MB
So from the aerial and ground photos we can determine that:
- Rothera has seen land use change due to the infill for the runway and service areas.
- The albedo around the station has changed, due to the infill with that darker local materials.
- Rothera has seen growth in buildings, and presumably population since 1976.
- Rothera’s aviation fuel tanks seen above and here plus the new hanger indicate an increase in aviation traffic has likely been seen since 1976.
- There’s apparently pressure from the tourist trade also, enough that BAS has made the: Rothera Station_visitor_guidelines. How many ships and planes that now visit have anything to do with primary research? How much extra infrastructure was created to handle tourist traffic?
As an indication of an increasing tourist trade, there sure seems to be plenty of “tourist” type photos of Rothera Station on the web like this one:

According to a BBC reporter who visited Rothera Station, they even have a coffee house. Maybe a Starbucks even?

Here’s a DC-3 coming in for landing in January 2004. Research or tourists or both?
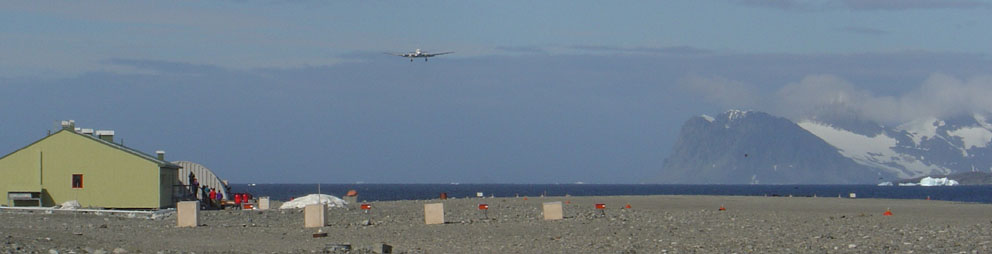

From the Wikipedia page where the improvements over time (and dates) to Rothera station have been listed) we find when the new runway was built:
With the commissioning of the gravel runway and hangar in 1991-92 air operations became more reliable and access to Rothera was greatly improved through a direct airlink from the Falkland Islands.
Just like airports wordwide, where many GHCN stations have been located, we see growth at the airport. Growth translates into UHI or in this case, AHI, since the next closest patch of humanity with a weather station is Base San Martin 75 kilometers away.
Here’s another take on the growth:
History: Built in 1975 on Adelaide Island, Rothera occupies a small rocky peninsula. A 3000′ (900m) crushed rock airstrip and hangar were added in 1990-91, making Rothera a peninsula region logistics center for British Antarctic Survey Operations.
Information: Rothera can accommodate 124 people and boasts one of the few aquariums in the Antarctic. The Bonner laboratory complex, completed in 1997, includes a recompression chamber, a wet lab and a terrestrial biology lab. A large new sleeping quarters building , which can house 88 people, is being constructed and should be completed by 2002.
So it is with little surprise, given the land use changes, the increased infrastructure, the new gravel runway, and an increased tourist trade that we see this sort of temperature plot from GISS:

Prior to 1985, it looks like recording temperature there wasn’t so important, as there is significant missing data. But with aviation growth comes a need for accurate weather information, and thus we don’t see any missing data since then.
Where do they actually measure the temperature at Rothera? That I don’t know yet, but given that the BAS puts hourly automated temperature reports on their website,and has a webcam it seems there is probably an automated weather station rather than a Stevenson Screen.

I’m guessing they have a readout for temperature in the comfort of the control tower:

For all I know the thermometer could be on the roof or side of the control tower. Not unheard of.
Regarding the GISS temperature plot. There’s a clear upwards trend. The question is: how much of it is caused by localized human influences and land use change?
Clearly, Rothera Station is no longer a “pristine” place to do science, it’s just another destination, a pocket of humanity with an airport, a coffee shop and the only heat for 75 kilometers.
Is Rothera a good place to measure a long term temperature trend to use for adjusting other Antarctic GHCN stations? Perhaps not.

haha, When I first saw the Steig recon and realized how many manned bases were in the easy to access peninsula, I called it a scientist detector.
The photo’s are great.
Why am I not surprised – disgusted yes, surprised no!
I wonder how many square kilometres that lonely thermometer has to cover?
Great job, well done.
These kind of publications make you laugh and cry at the same time.
This is blatant fraud, not science. There is no justification for this sort of shenanigans at all. Yet, this sort of story appears here all the time to the point I can not keep up or remember them all. Could we have a special collection of this sort of news?
Perhaps a tag “questionable” would do.
Oh, good grief! They’re measuring the Antarctic continent’s temperature trend from 67.6 deg S?
I would hardly call this single station representative to Antarrghctic climate from a geological point of view, it is an outlier to the mass and happens to be in a warm spot.
http://wattsupwiththat.files.wordpress.com/2008/01/antarctic_temps_avh1982-2004.jpg
Wish I could get on that runway and scrape the surface with my shoe to see if the top is the same color as what’s underneath. In Baker City, OR, there is a crushed rock access road which has significantly darkened since it was laid down. Picture in gallery.
I’m off to buy my ticket! Maybe buy a beach front time share.
One feature of airports in snowy areas is that they scrape the snow off the runways as much as they can. So not only does the dark surface collect heat, it is artificially kept in a state where is can do so.
These must be the new Vikings of Greenland, I wonder if same fate awaits them…
Since it’s an automated thermometer they can probably leave it buried all winter!
I keep waiting for some “world leader” to call BS on this entire subject of globull warming. I reckon I’ll have to wait till hell freezes over.
What is responsible for the rather pockmarked appearance of the snow field inland of the station? Could it be an indication of geothermal activity in the area?
Hide the decline!
GHCN has chosen to use a single station on the Antarctic Peninsula to represent an entire continent of the earth for the past 17 years
umm. this is supposed to be science, right? must be the ‘new science’ i’ve been hearing about from al gore
And don’t forget the post from WUWT on May 7, 2008
http://wattsupwiththat.com/2008/05/07/climate-models-fail-at-antarctic-warming-predictions/
Climate Models Fail at Antarctic Warming Predictions
Some nice NASA visualizations.
I would say the Rothera Station story is busted…
Eeeeehhhh….
I think you may be making a mountain out of a rockpile on this one. Those human settle pods you point out are designed to keep in as much heat as possible…I would wager that no significant heat is leaking from them. The only change, then, would be when the ground became visible and the gravel airstrip was in view of the sun. You might be talking about a heat island on the order of a few tenths of a degree and only in summer.
REPLY: Albedo on the runway is a big factor in summer, which when snowless raises the average monthly temp., raising the average yearly temp. And just where my good fellow, does that heat eventually go? It has to go somewhere. It does not vanish. -A
Is there a temperature data set that does not have serious problems that just happen to support AGW?
is this the “observer effect” i’ve heard about 🙂
“we” all know it’s true, but it’s not gonna change minds in copenhagen.
stick with your thread:
http://wattsupwiththat.com/2009/12/12/historical-video-perspective-our-current-unprecedented-global-warming-in-the-context-of-scale/#more-1403
if you want to enlighten people. imho
can’t wait till this is over so i can delve into your archives.
Hi Anthony,
The UHI, or AHI aspect of this story is hillllllarious. But the reason that GHCN uses only 1 research station in Antarctica is because of lattitude. You have to remember that GISS goes all the way to the poles but GHCN stops at 80 degrees or something because of the lack of historical data. So yes, there is only 1 station that represents all of Antarctica but it only represents the southern edges of the continent that reach below the limits of GHCN lattitude. If you look at the GISS temps for Antarctica they have several stations for the continent (and they even estimate for Antarctic temps when there were no stations bwaaaaaaaaaahahahahahha).
Fortunately, we have satellite readings above Antarctic:
http://www.climate4you.com/images/MSU%20RSS%20ArcticAndAntarctic%20MonthlyTempSince1979%20With37monthRunningAverage.gif
Antarctic stations used by CRU:
http://www.climate4you.com/images/70-90S%20MonthlyAnomaly%20Since1957.gif
Rothera Metadata History: http://www.antarctica.ac.uk/met/READER/metadata/Rothera.html
Rothera Metadata
Rothera Station, Rothera Point Adelaide Island, 67deg34’S,68deg08’W
Surface
1976 March
Data collection begins
Instruments in use – PAB, Barograph, Thermometers, Munro Mk4a anemometer, hair hygrograph and thermograph
PAB height 16.35m
12z and 00z manual obs 18z and 06z from autographic data
1977 July
PAB height 16.59m
1979
00z, 06z, 12z, 18z all manual obs
1980 May
Wind sensors moved to temporary tower,
1980
Wind sensors moved to new tower
1989
Thermometer screen moved to new site
1990
Munro replaced by Vector A100 anemo
1992
Both PAB and Setra pressure sensor used
1992
Both thermometers and PRTs used
1993
PRTs replace thermometers
1993
Setra pressure sensor replaces PAB
1996
Three hourly obs – all manual
1998
Vaisala PTU (height 31.5m) and Setra pressure sensor (height 16.6m) used
1998
PT100 PRTs used
1998
PRT aspirated
1999
Vaisala PTU (height 31.5m) replaces Setra presure sensor
1999
PRT placed in aspirated shield
Bah, Humbug and Merry Xmas.
Although it may be claimed that one Tree may not be enough to gamble the fate of the world upon, may I make a counter-argument?
To you pragmatic kill-joys who, utilising the ancient and now discredited folk-lore of logic, systematically attempt to discredit the Science of DendroCrackerChineseCookieOlogy, you’re out of order. It’s Totally Robust!
Everyone knows that Scientific logic will overcome superstitious nonsence every time so why is it that now the only other plausible explanation for Global Warming- Witchraft has been discredited ( jones et familiars) do denialists claim that CO2 is not a candidate for demonisation!
Guys, one Tree for this Xmas is normal but one Tree for all our Xmases to come?
“Those human settle pods you point out are designed to keep in as much heat as possible…I would wager that no significant heat is leaking from them”
Think about it – why is it not easy to live there if all you have to do is build some nice insulated buildings? Answer: because insulation only does so much.
The temperature differential in winter is upwards of 40°C between inside and outside. At that difference everything leaks.
Apparently penguins find that their body heat, despite their insulation, is sufficient in mass to be worth huddling together. A few degrees is significant.,
In summer it will be albedo effects rather than the huts.