UPDATE: 9/8/09
The University of Colorado made a serious mistake in the press release that I cited. This press release was issued well before the paper was available, and of course the paper itself was not made available to journalists. It was hidden behind the AAS paywall.
I wrote to the press officer at UC on Friday, he responded Saturday night, on a holiday weekend, to his credit, here is my exchange:
Re: question about press release
From: Gifford H. MillerSent: Saturday, September 05, 2009 8:02 PMTo: Anthony Watts – mobileSubject: Re: question about press releaseIndeed, this is a typo, Anthony. Not sure how it escaped my attention.The sentence should read: “The research team assembled high-resolution records of climate for the past 2,000 years and found that the cooling trend reversed in 20th Century.“I have passed the correction to our PR folks and it should be fixed soonThanks for catching thisGifford Miller
Hello,
I looked at the Kaufman paper press release on EurekAlert as well as here:http://www.colorado.edu/news/r/bff9b4f453f2f9e1aa1e5d1b699d8525.html
In the second paragraph there is this sentence:“The research team assembled high-resolution records of climate for the past 2,000 years and found that the cooling trend reversed in the mid-1990s.”Is this correct? Is this a typo and instead should it say “mid-1900’s ” ?
Thanks for your consideration. Anthony Watts
UC has updated their press release here on 9/7 and was able to persuade EurekAlert to fix it on their website also.
The last sentence of paragraph 2 now reads:
“The research team assembled high-resolution records of climate for the past 2,000 years and found that the cooling trend reversed in the 20th century.”
It was originally stated as:
The research team assembled high-resolution records of climate for the past 2,000 years and found that the cooling trend reversed in the mid-1990s.
I’ve received some criticism for using the press release and acting on it to look for such a change in the 1990’s per the press release. While that criticism would be valid if the press release and the paper were both made available to me at the same time, the fact is they were not.
This method of pushing a scientific paper via press release, ahead of the paper’s actual journal release, and then hiding it behind a paywall is unprofessional and stinks. If the science organization wants to be seen as credible, then they need to make both the press release AND the paper available to journalists at the same time.
This idiotic “press release but no sci paper” policy needs to be changed. I’ll have more on this soon. As it stands, I’ve going to avoid UC press releases until they change the policy and I encourage others to do the same.
– Anthony
==========================
There’s a lot of buzz about regarding the Kaufman et al paper published today in Science which claims a recent reversal on a long term Arctic cooling trend and “found that the cooling trend reversed in the mid-1990s.” In the NOAA internal newsletter I cited yesterday, NOAA claims that the “According to the most recent Arctic Report Card, the Arctic Ocean continues to warm”. OK fair enough, we’ll have a look.
NOAA based this on Hadley’s CRU dataset, which of course Hadley refuses to show any raw data for or methodology despite repeated FOI requests, making verification impossible. (read more here)
 |
| Figure A1. Arctic-wide annual averaged surface air temperature anomalies (60°–90°N) based on land stations north of 60°N relative to the 1961–90 mean. From the CRUTEM 3v dataset, (available online at www.cru.uea.ac.uk/cru/data/temperature/. Note this curve does not include ship observations. |
Note the trend from 1980 to present. Note also that there are few weather stations above 60N and even fewer on the Arctic Ice itself. The data is relatively sparse and interpolation/gridding/averaging is employed to come up with the coverage all the way to 90N. We’ll get back to this.
Let’s first get an understanding of the Kaufman paper. Here’s the abstract. We can’t get a look at the full paper or publish it here yet since it is behind the AAS paywall. If somebody has an external link to it, please advise.
Recent Warming Reverses Long-Term Arctic Cooling
Darrell S. Kaufman,1,* David P. Schneider,2 Nicholas P. McKay,3 Caspar M. Ammann,2 Raymond S. Bradley,4 Keith R. Briffa,5 Gifford H. Miller,6 Bette L. Otto-Bliesner,2 Jonathan T. Overpeck,3 Bo M. Vinther,7 Arctic Lakes 2k Project Members
The temperature history of the first millennium C.E. is sparsely documented, especially in the Arctic. We present a synthesis of decadally resolved proxy temperature records from poleward of 60°N covering the past 2000 years, which indicates that a pervasive cooling in progress 2000 years ago continued through the Middle Ages and into the Little Ice Age. A 2000-year transient climate simulation with the Community Climate System Model shows the same temperature sensitivity to changes in insolation as does our proxy reconstruction, supporting the inference that this long-term trend was caused by the steady orbitally driven reduction in summer insolation. The cooling trend was reversed during the 20th century, with four of the five warmest decades of our 2000-year-long reconstruction occurring between 1950 and 2000.
Here’s the press release from EurekAlert:
Long-term cooling trend in Arctic abruptly reverses, signaling potential for sea rise
 |
||||
A new study led by Northern Arizona University and involving the University of Colorado at Boulder indicates Arctic temperatures have reversed from a long-term cooling trend and are now the warmest they have been in at least 2,000 years, bad news for the world’s coastal cities facing rising seas in the coming decades.
High northern latitudes have experienced a long-term, slow cooling trend for several millennia, the result of a wobble in Earth’s rotation that has been increasing the distance between the sun and Earth and decreasing Arctic summer sunshine. The research team assembled high-resolution records of climate for the past 2,000 years and found that the cooling trend reversed in the mid-1990s.
The decade from 1999 to 2008 was the warmest in the last 200 decades and corresponds with a continuing buildup of human-generated greenhouse gases in Earth’s atmosphere, said lead author Darrell Kaufman of Northern Arizona University. “Scientists have known for a while that the current period of warming was preceded by a long-term cooling trend, said Kaufman. “But our reconstruction quantifies the cooling with greater certainty than ever before.”
Since the Earth is still moving away from the sun — it’s about 0.6 million miles further during the Northern Hemisphere summer solstice than it was in 1 B.C. — it appears greenhouse gases began “overriding” the natural cooling of Earth in the middle of the last century, said Professor Gifford Miller of CU-Boulder’s Institute for Arctic and Alpine Research, a study co-author. “We expect the Arctic will continue to warm in the coming decades, increasing land-based ice loss and triggering global increases in sea-level rise,” he said.
The study was published in the Sept. 4 issue of Science. Other institutions participating in the study included the National Center for Atmospheric Research in Boulder, the University of Arizona, the University of Massachusetts, the University of East Anglia in Norwich, England, and the University of Copenhagen in Denmark. The study was funded by the National Science Foundation.
The research team reconstructed past temperatures on a decade-by-decade basis during the past 2,000 years using information gleaned from ancient lake sediments, ice cores, tree rings and other samples. As part of the study, the decade-by-decade climate data reconstruction was compared with sophisticated climate model simulations run by NCAR researchers.
The NCAR climate simulations agreed closely with the ground-based Arctic data used in the study, said NCAR scientist David Schneider, a co-author on the study. “This result is particularly important because the Arctic, perhaps more than any other region on Earth, is facing dramatic impacts from climate change,” Schneider said. “This study provides us with a long-term record that reveals how greenhouse gases from human activities are overwhelming the Arctic’s natural climate system.”
The new Science study dovetails with a report published earlier this year by the U.S. Climate Change Science Program on changes in the Arctic and at high latitudes. The CCSP study’s five lead authors — including Miller and CU-Boulder INSTAAR Director Jim White — concluded climate warming in the Arctic and at high latitudes likely will continue at a rapid pace given human-caused changes in Earth’s atmosphere.
Arctic temperatures have reached their highest level in the past decade, averaging 2.5 degrees Fahrenheit higher than would have been expected if the 2,000-year cooling trend had continued through the latter part of the 20th century and into the 21st century, said Kaufman. Kaufman received his doctorate from CU-Boulder in 1991 while studying under Miller at INSTAAR.
Previous research has shown that Arctic temperatures increased three times faster during the 20th century than temperatures in the rest of the Northern Hemisphere — a phenomenon known as “Arctic amplification,” said Miller, also a professor of geological sciences at CU-Boulder. The amplification is caused by decreased Arctic sea ice and an increased absorption of the sun’s heat by exposed ocean as well as “darker” land areas caused by decreases of Arctic snow and ice, he said.
“With less sea ice in winter, the ocean returns the heat stored in summer to the atmosphere, resulting in warmer winters throughout the Arctic,” said Miller.
“Because we know that the processes responsible for past Arctic amplification are still operating, we can anticipate that it will continue into the next century,” said Miller. “The magnitude of change was surprising, and reinforces the conclusion that humans are significantly altering Earth’s climate.”
“As we are confronted with evidence of global warming, it is extremely helpful to be able to use paleoclimate data to provide context for today’s climate relative to the range and trajectory of recent climate regimes,” said Neil Swanberg, director of NSF’s Arctic System Science Program.
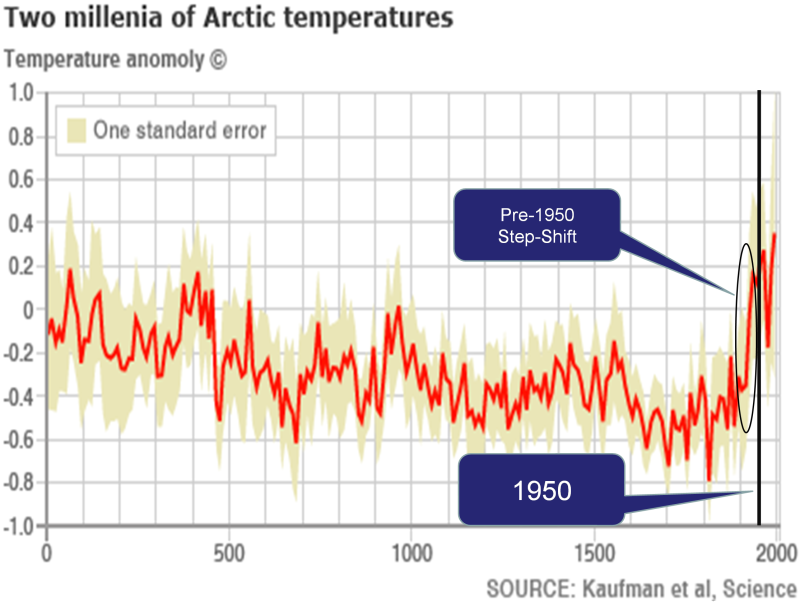
The BBC did a better job of reporting the story and included a graph from the paper. This paper supposedly ties all of the 20th century Arctic warming to greenhouse gas emissions… There’s one tiny problem with the paper’s claim…All of the anomalous warming occurred in one “step shift” before 1950; while most of the increase in atmospheric CO2 has occurred since 1950…
Kaufman et. al. w/ my annotations
And here is that graph Dave annotated:

OK that’s one problem. Here’s another. Both Kaufman et al and NOAA claim recent Arctic warming. In the case of the Kaufman paper, they specifically claim they “found that the cooling trend reversed in the mid-1990s.”
Since we can’t really look at the Hadley CRU data since it is held under lock and key despite the repeated FOI requests so that analysis and verification can be performed, we can’t really analyze it pertaining to NOAA’s claim of warming. Since NOAA and HadleyCRU use many of the same stations above 60N (they’d have to since there are so few) it seems reasonable to assume they share similar data in the Kaufman et al paper.
Fortunately there is another Arctic temperature data source available we can look at to compare against. And that is from the Danish Meteorological Institute (DMI). Like NOAA, they offer a dataset that shows temperature in the high latitudes.Here is what they say about that dataset and how it is obtained.
The daily mean temperature of the Arctic area north of the 80th northern parallel is estimated from the average of the 00z and 12z analysis for all model grid points inside that area. The ERA40 reanalysis data set from ECMWF, has been applied to calculate daily mean temperatures for the period from 1958 to 2002, from 2002 to 2006 data from the global NWP model T511 is used and from 2006 to present the T799 model data are used.
The ERA40 reanalysis data, has been applied to calculation of daily climate values that are plotted along with the daily analysis values in all plots. The data used to determine climate values is the full ERA40 data set, from 1958 to 2002.
Here is the most recent DMI graph of Arctic temperature:

Note that the blue line represents the “melting point” of ice in Kelvin or 0°C/32°F The green line represents the average climate from 1958 to 2002, i.e. the “baseline”
I don’t have time to get into a detailed analysis of the raw DMI data this morning as I have other duties, but I do have time to do a visual check that is just as telling.
Kaufman et al claims they “found that the cooling trend reversed in the mid-1990s.” That should easy to spot in the DMI graphs if it exists. So I animated the entire set of DMI graphs from 1958 to 2009. See if you can spot the temperature spikes or the “…cooling trend reversed in the mid-1990s.” signature.
click for full sized animation
Watch the top of the bell curve above the blue line. See any big changes? I don’t. Note that in the animation above, due to a slight change in DMI’s graphical presentation for 2008 and 2009, I had to graphically fit 2008 and 2009 to match the rest of the animation framework so that there would not be a distracting jump at the end. The data is unchanged in doing this.
One of the most common claims of alarmists is that the Arctic is “melting” and that implies a temperature cause in their statements. But as we see, during the critical melt window, the DMI data seems to hold right along the climatic normal.
One thing about DMI, if you go to their main web page, http://ocean.dmi.dk/english/index.php you don’t find any alarming pronouncements about Arctic melting or temperature reversal like you do at NOAA.
Others like NASA say the wind pattern changes is more of an issue, blowing the sea ice southward. Perhaps NOAA and Kaufman should look more closely at before making grand claims.
Further reading:
NASA Sees Arctic Ocean Circulation Do an About-Face
Arctic Sea ice loss – “it’s the wind” says NASA
Arctic Sea Ice Time Lapse from 1978 to 2009 using NSIDC data
Watching the 2007 historic low sea ice flow out of the Arctic Sea
McIntyre versus Jones: climate data row escalates
The new Science study dovetails with a report published earlier this year by the U.S. Climate Change Science Program on changes in the Arctic and at high latitudes. The CCSP study’s five lead authors — including Miller and CU-Boulder INSTAAR Director Jim White — concluded climate warming in the Arctic and at high latitudes likely will continue at a rapid pace given human-caused changes in Earth’s atmosphere.
—
Question is: Since the US Climate Change Science Program’s most recent (propaganda-ridden) paper has been proved false and is presenting false data, how can “Science” magazine justify using a paper with false conclusions to confirm the same group of authors’ “new” Arctic conclusions?
the BBC have been full swing on the arctic warming thing.
They say ice, sedemant and tree ring data was used to prove it!
Just a question: are there any trees old enough in the arctic circle to support this claim???
Sure I can imagine so in temperate climates, but I thought the rctic was only pines?
Am I wrong, or more BBC lies?
Previous research has shown that Arctic temperatures increased three times faster during the 20th century than temperatures in the rest of the Northern Hemisphere — a phenomenon known as “Arctic amplification,” said Miller, also a professor of geological sciences at CU-Boulder. The amplification is caused by decreased Arctic sea ice and an increased absorption of the sun’s heat by exposed ocean as well as “darker” land areas caused by decreases of Arctic snow and ice, he said.
“With less sea ice in winter, the ocean returns the heat stored in summer to the atmosphere, resulting in warmer winters throughout the Arctic,” said Miller.
—
Further, we know this favorite little “Arctic amplification” theory of the AGW theists is false because the low sea in 2007 was rapidly re-frozen in 2008 when ice extents actually and measureably increased during the entire year. If this theory was correct, there should have been no way that one summer’s exposed “black surfaces” could be re-frozen the next winter. And, once re-frozen over the next winter, there is no “left-over albedo” to warm (re-melt) the following summer. (True, the AGW extremists claim that “this doesn’t matter, it is second-year ice which is thinner and more likely to melt over the third summer.” Except that didn’t happen either in summer 2009. The Caitlin (sp ?) expedition in spring 2009 was a specific attempt to show this theory of first-year/second-year ice existed. It’s rescue attempt of their theory failed as well, and the expedition itself required rescue – leaving tons of oil on the ice surface.)
Then, (today) in spring 2009 AMSRE sea ice extents in April and May were the highest ever graphed since 2000. Now, at the lowest part of their annual melting season, 2009’s sea ice extent’s are 33% higher than in 2007.
Paraphrasing Einstein when he was attacked by his politically-driven critics. “One thousand theories can claim I am wrong, and it means nothing. But it will only take one measurement to prove me wrong.”
If the data cannot be reviewed independantly and the method is not clear and reproducible independantly it isn’t science. I don’t know what it is, but it is of zero value in terms of scientific method.
By eye in the region above the blue line, it looks like the annual red lines are higher by a smidge than the green line average for many of the 1990s years and below it by a similar smidge during the 2000s. Maybe one degree K. The number of days above the blue line suggests the same pattern, but not as strongly. This is the “melt” region due to temperature and needs the daily data for analysis to verify the visual impression. Of course, wind and current affect ice cover too so this doesn’t tell the whole story.
Typo check — “Since we can’t really look at the Hadley CRU data since it is held under local and key despite …” Don’t you mean “lock” and key?
“One thing about DMI, if you go to their main web page, http://ocean.dmi.dk/english/index.php you don’t find any alarming pronouncements about Arctic melting or temperature reversal like you do at NOAA.”
Don’t let yourself get fooled by DMI english pages. The danish pages are filled with alarmism and standard warmist myths.
/Mikkel
REPLY: While I can’t fully read Danish, it appears you are correct. I wonder why they don’t bother in English? – Anthony
I wonder if anyone in this study group looked at the AMO cycle which also went warm or positive in 1995 . MOC[ Meridional Overturning Circulation] and the Atlantic THC also changed . There is a natural long term warming since the Little Ice Age , but there is also natural cyclic change due to SST changes. This appears to be another doomsday type of study that will be found to be wanting when global cooling becomes more evident the real causes of climate change are better understood and accepted.
The bells in the video look almost identical from beginning to end. About the only thing I noticed was the 1998 bell seemed a little fatter near the top part of it.
Good summary of the Team Members waterboarding their data to get the results they want.
http://www.climate-skeptic.com/2009/09/more-proxy-hijinx.html
and here.
http://www.climate-skeptic.com/2009/04/numbers-divorced-from-reality.html
ClimateAudit is all over it as well
From the BBC Arctic ‘warmest in 2,000 years’
http://news.bbc.co.uk/1/hi/sci/tech/8236797.stm
If we do have a period of time matching the worst of the little ice age (or worse) the one thing that will make me feel better will be listening to those “scientists”, those in the media and the politicians explaining themselves.
Kaufman et al appears to be in conflict with the historical records of Scandinavian exploration of the Arctic North Atlantic around 1000 – 1400 AD and earlier
A few months ago we discussed a paper about a Siberian ice core reconstruction that correlated a solar proxy (10Be I believe) to an oxygen isotope temperature proxy.
The paper claimed that the solar proxy fit the temperature proxy up until the 20th century and then the two deviated and CO2 must have caused the 20th century warming. But that reconstruction had a similar early 20th century step-shift from about ~1890-1930…
Eichler Modified
I don’t know if these “step-shifts” are indicative of an early 20th century northern latitude climate shift or if the scalar relationship between temperature proxies and temperatures changed. Maybe the oxygen isotope proxies haven’t been correctly calibrated for precipitation changes?
This could be me, but eyeballing the gif you can see that up till the mid 90’s you see large spikes downwards (troughs?) when compared to the median. From then on you see mainly (very) large spikes upwards from day 0-150 and 250-end. I’ve asked Anthony several times what was causing these big spikes, especially the ones in recent years. I understood that when the sea is refreezing after summer melt (counterintuitively) a lot of warmth is released in the atmosphere. The big refreezes of the last few years could explain part of the temperature increase trend in the Arctic.
Gosh, you would think there was an important piece of climate legislation pending before Congress or maybe some “important” climate conference about to happen considering the full-court press we have seen in the media lately.
Wtf? HadCRUT data for 70-90N:
http://www.climate4you.com/images/MAAT%2070-90N%20HadCRUT3%20Since1900.gif
Satellite UAH MSU Arctic+Antarctic temperatures:
http://www.climate4you.com/images/MSU%20UAH%20ArcticAndAntarctic%20MonthlyTempSince1979%20With37monthRunningAverage.gif
Some Greenland/Iceland/Arctic stations with long records (from NASA GISS page):
http://data.giss.nasa.gov/cgi-bin/gistemp/gistemp_station.py?id=431043600000&data_set=1&num_neighbors=1
http://data.giss.nasa.gov/cgi-bin/gistemp/gistemp_station.py?id=634010010003&data_set=1&num_neighbors=1
http://data.giss.nasa.gov/cgi-bin/gistemp/gistemp_station.py?id=431042500000&data_set=1&num_neighbors=1
http://data.giss.nasa.gov/cgi-bin/gistemp/gistemp_station.py?id=620040630003&data_set=1&num_neighbors=1
http://data.giss.nasa.gov/cgi-bin/gistemp/gistemp_station.py?id=620040300000&data_set=1&num_neighbors=1
http://data.giss.nasa.gov/cgi-bin/gistemp/gistemp_station.py?id=634010250000&data_set=1&num_neighbors=1
http://data.giss.nasa.gov/cgi-bin/gistemp/gistemp_station.py?id=634010010003&data_set=1&num_neighbors=1
http://data.giss.nasa.gov/cgi-bin/gistemp/gistemp_station.py?id=638221130005&data_set=1&num_neighbors=1
http://data.giss.nasa.gov/cgi-bin/gistemp/gistemp_station.py?id=634011520003&data_set=1&num_neighbors=1
http://data.giss.nasa.gov/cgi-bin/gistemp/gistemp_station.py?id=614028360003&data_set=1&num_neighbors=1
http://data.giss.nasa.gov/cgi-bin/gistemp/gistemp_station.py?id=638221650004&data_set=1&num_neighbors=1
How on Earth they were able to produce such a hockey stick?
Less Ice In Arctic Ocean 6000-7000 Years Ago
Source: Copyright 2008, ScienceDaily
Date: October 19, 2008
Original URL
Recent mapping of a number of raised beach ridges on the north coast of Greenland suggests that the ice cover in the Arctic Ocean was greatly reduced some 6000-7000 years ago. The Arctic Ocean may have been periodically ice free.
see full story here http://www.ecoearth.info/shared/reader/welcome.aspx?linkid=108614
OT but Dr Roy Spencer has just published the UAH temperature anomoly for August – +0.23C
They are tough little cookies.
Every time the scientific facts cause their house of cards to crash, they immediately start rebuilding it.
Reports like this will be on the table of our Senate and the Copenhagen Summit in December.
We debunk them all over again but in th mean time, keep calling those Senators.
“I had to graphically fit 2008 and 2008”
That sounds easy.
REPLY: typo, 2009 fixed thanks – A
“Arctic temperatures have reached their highest level in the past decade, averaging 2.5 degrees Fahrenheit higher than would have been expected if the 2,000-year cooling trend had continued through the latter part of the 20th century and into the 21st century, said Kaufman.”
What 2000 year cooling trend? I also did a quick check using UAH “North Polar” data, and the curve looks nothing like their graph in Figure A1. UAH data shows roughly a 1 deg C temperature rise over the last three decades with essentially no increase in the past decade. I know the UAH satellite derived data only covers up to +85 latitude, but on the other hand, it’s not like there are a bunch of weather stations north of that point anyhow.
Mikkel (10:51:05) :
I went to the Danish version, clicked on one of their articles and used the Google Tranlator:
http://www.dmi.dk/dmi/se_antarktisk_is-bro_kollapse
But, the article does us a huge favor, it zooms in on a small area of the Wilkins Ice Sheet and even gives the dimensions via satellite. After all this catastrophic warming, they conclude with:
“Meanwhile, the total sea ice distribution around the continent has been relatively stable.”
“Ozone layer involved
Part of the reason for the central Antarctica has hitherto been almost untouched by global warming is another man-made phenomenon: the ozone hole over the South Pole.
Normally absorbed ultraviolet light by ozone in the stratosphere and this process releases heat. Since the 1980s, where the reduction of ozone over Antarctica took off because of human emissions of CFCs, have been absorbed less ultraviolet radiation and temperature in the stratosphere has decreased by up to 10 °.
This cooling of the stratosphere has increased circulation in the troposphere (the lower part of the atmosphere where we live) around Antarctica. It acts as an effective brake on the meteorological exchange of heat between the South Pole and surrounded air masses. While the central Antarctica is within the zone which has avoided heat so stick outside the Antarctic Peninsula.”
Now, I thought the big deal over the ozone was solved decades ago.
So, no mention of increased GCR’s eating up the ozone again. Just a big implied pat on the back over how they save Antarctica from Global Warming so far.
But back then, it wasn’t about Global Warming: It was about the Next Ice Age Threat.
I can hear the ice cracking in heads torn between two extremes. Can’t make up thier minds which way to go.
They need a new Mantra: Global Analysis Paralysis.
Dear Wondering,
Your concerns are so 20th Century.
Discover “Post Normal Science,” drink the Kool-aid, and feel the re-structuring of your mind-thoughts take place, pleasant as slipping into a Calgon bath. What “Post Normal Science” teaches us is that when something is really, really important and we don’t know all that much about it, we can start at the end, what we want the answer to be, and work back to the beginning where we choose appropriate data. This is a great way to nail a hypothesis and with proper coaching and encouragement you’ll find it easy to do and you will feel so much better too.
Just trying to help. If you think I’m kidding check out the work of Funtowicz and Ravetz. Well, work…..
Oh, oh, oh, we gotta demolish AGW on these little pesky temperature spiky things. More and more, it seems to me to come back to ultra-simple ultra-basics. Proper temperature records. Sea level records. Respect for the evidence of history and archaeology. Respect for the early Arctic records made by those whose lives may have depended on their accuracy.
Kaufman et al are nuts and dangerous IMHO. It’s time to get out the John Daly “Still Waiting for Greenhouse” pages What the Stations Say with his superb collection of good global records, many arctic records going back a long way. True, many now end at the millennium since Daly passed on; however, the evidence is already good enough by a good margin. I’m going to try and assemble his best records on a single page tonight; meanwhile however, look at Bodø Norway as a good example.
Ron de Haan (11:13:18) :
Global Whateverism.
Whatever can be fudge, faked or fiddled with to support Whenever faster than Previously on Lost is needed to find a problem by Whomever mounted the latest alarming Expedition to Wherever the weather isn’t being currently watched.
Got to keep one step ahead of the auditors or else the Promotional Production will plummet back to Terra Firma due to lack of proverbial hot air in the balloon.
Concerning the bell curve, let us not forget from WUWT post 8/24/09 :
“Arctic Temperature Headed Below Freezing”
“The buoy has drifted with the sea ice and is now near 84.1N, but started at 89.648N, so presumably, temperatures at the actual North Pole would be colder than what is being measured and seen now.”