That is a total of 365,000 high temperature records and 365,000 low temperature records. During the second year of operation, each day and each station has a 50/50 chance of breaking a high and/or low record on that date – so we would expect about 182,500 high temperature records and about 182,500 low temperature records during the year.
In the third year of the record, the odds drop to 1/3 and the number of expected records would be about 121,667 high and low temperature records.
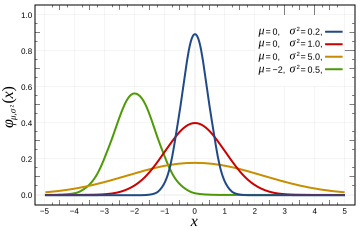
In a normal Gaussian distribution of 100 numbers (representing years in this case,) the odds of any given number being the highest are 1 out of 100, and the odds of that number being the lowest are also 1 out of 100. So by the 100th year of operation, the odds of breaking a record at any given station on any given day drop to 1/100. This mean we would expect approximately 1000 stations X 365 days / 100 years = 3,650 high and 3,650 low temperature records to be set during the year – or about ten record highs per day and ten record lows per day.
This provides the news media lots opportunity to get hysterical about global warming every single day – even in a completely stable temperature regime. The distribution of temperatures is Gaussian, so it won’t be exactly ten per day, but will average out to ten per day over the course of the year. In a warming climate, we would expect to see more than 10 record highs per day, and fewer than 10 record lows per day.
In a cooling climate, we would expect to see more than 10 record lows per day, and fewer than 10 record highs per day. The USHCN record consists of more than 1000 stations, so we should expect to see more than 10 record highs per day. Throw in the UHI effects that Anthony and team have documented, and we would expect to see many more than that. So no, record high temperatures are not unusual and should be expected to occur somewhere nearly every day of the year. They don’t prove global warming – rather they prove that the temperature record is inadequate.
No continents have set a record high temperature since 1974. This is not even remotely consistent with claims that current temperatures are unusually high. Quite the contrary.
| Continent | Temperature | Year |
| Africa | 136F | 1922 |
| North America | 134F | 1913 |
| Asia | 129F | 1942 |
| Australia | 128F | 1889 |
| Europe | 122F | 1881 |
| South America | 120F | 1905 |
| Antarctica | 59F | 1974 |
http://www.infoplease.com/ipa/A0001375.html
Here is the code discussed in comments:
// C++ Program for calculating high temperature record probabilities in a 100 year temperature record

// Compilation :  g++ -o gaussian gaussian.cc

// Usage : ./gaussian 100

#include <iostream>

main(int argc, char** argv)

{

int iterations = 10000;

int winners = 0;

int years = atoi(argv[1]);

for (int j = 0; j < iterations; j++)

{

int maximum = 0;

for (int i = 0; i < years; i++)

{

maximum = std::max( rand(), maximum );

}

int value = rand();

if (value > maximum)

{

winners++;

}

}

float probability = float(winners) / float(iterations);

std::cout << "Average probability = " << probability << std::endl;

}
It is the nature of records that they will always be broken.
Nor do these records show the supposed increase of “extreme events”. Thank you Steve, another snappy fact for our arsenal.
Global warming doesn’t act by increasing high temperatures. It works, as I understand it, by increasing LOW temperatures. What I would expect to see in a greenhouse warming climate would be a lot of record warm low temperatures.
Recently I read that Prague just broke the temperature record from 19th century in early April. Its cool that we have just surpassed Little Ice Age record today 😉
Yeah, more high lows and less low lows, but certainly more high highs and less low highs!!!
Nature is the norm. The abnormality is in the “surprise” at the “unexpected” during the observation of natural events, especially when those natural events do not correspond to the outputs of computer models.
Here is a completely subjectif observation based on perception…
Can you recall the intensity of the warmth of the sun on your face? I always enjoyed feeling the warmth of the sun on my face, more in the Spring when we get out of winter. However, I do remember a feeling of scorching on my face from about 2005 to 2007. I remember driving and trying to cover my face on my left side because it was not warmth but burning feeling. Last year I did not feel this. I wonder how the summer sun will feel this year, but I certainly don’t think that it will be scorching hot.
No, it would not cause higher high temps because CO2 would also block inbound IR from the Sun during daytime. It would act to moderate daytime high temps but it would act to prevent radiative cooling. As a result, the atmosphere should heat up in the mid troposphere. It would get heated from the sun in the daytime and from surface radiation at night … but that isn’t happening according to the observations so we can just can the whole silly notion.
Given UHI – we can expect more high records than low records. I was expecting to see what we actually did get these past few years at the end of the article – not a continent summary.
surfacestations.org shows that we’re not measuring just the air temp in some random location. We’re measuring some sort of human activity mixed in with the air temp. Human activity doesn’t strike me as random – so I wonder how that affects the Gaussian distribution.
“in a cooling climate” – not really – in a colder than average climate – you’d get more low records. You can be warming up, but colder than average, and still see more record lows. That’s always the big issue with the warmist since we’re currently coming down from a high point – we probably still set more high records than low records – which doesn’t show that we’re still warming.
Thank you, Ray, for clearing that up.
Steve,
Conversely you should have added that record low temperatures have been set after 1974
http://www.infoplease.com/ipa/A0001377.html
From the anti science department
http://voices.kansascity.com/node/4387
What is a Gaussian given Hansen at the controls.
Records are made to be broken.
“WE’RE ALL GONNA DIE IN A FIREBALL IN FIVE YEARS!!!!” sounds like a broken record to me.
Very helpfull description of probability for highs and lows, I like the list of continental highs, have you got one for lows with the years. ?
Imagine it’s April, in California. Why, within the same month, one may set two records:
1) Earliest grrrrrrrrrreat heat everrrrrrrrr!
2) *whispered (most heating degree days ever in the month of April)
RE: crosspatch (15:55:54)
Then your thoughts on the large number of record low numbers would be?
With all due respect to the poster, things are not as simple as presented. This sort of thing hurts my brain since my last foray into statistics was 1/4th of a mean life time ago! The problem gets compounded by the fact that we measure temperature in rounded off degrees, be they N.1 or N.001 degrees. That means that a new record temperature must not only be higher than the old record but must exceed it by some discrete amount, 0.1 or 0.001 degrees in my example above. That lowers the odds of any new record occurring. The odds go down fast the cruder the thermometer used. The poster’s point is still correct in that in a stable and unchanging climate there will still be new records over the time scale we have be taking measurements. It would be fun for some poor math major to plot us a series of probability curves for new records calculated parametrically with varying standard deviations, sample size and bin size. Nice post. SL
re: crosspatch (16:12:01) :
“No, it would not cause higher high temps because CO2 would also block inbound IR from the Sun during daytime.”
Not much inbound IR from the sun.
crosspatch,
Do you think warm low temperatures might have something to do with the proliferation of cities, asphalt, lawns, and irrigated fields? I keep a thermometer on my bicycle and sometimes see 3-5C difference between neighborhoods and adjacent open spaces on summer nights. Dew condensing on grass releases large amounts of heat.
Has anyone factored in all the badly sited weather stations and tried to make an adjustment for the UHI effect on those sites?
Such a map would probably be far different than those preferred by the warming alarmists.
Steven, you might have referred to this in preparing this post:
http://www.numberwatch.co.uk/record.htm
A couple years ago I looked at the distribution of high and low temperature records in the Kansas City area. It’s not a perfect weather station, having moved at least twice in the past 120 years, if not more. Fully one third of the high temperature records (year around) were set in the 1930s. Fully one third of the low temperature records have been set since 1980. The all time low temperature record in KC was set in 1989; it was -23 degrees on December 22 or 23 that year.
In a perfectly even climate, that is not the right distribution.
At least we know the high temperatures aren’t getting hotter.
Also it looks like we won’t die in a fireball here in the US yet according to the climate forecast system, looks like a slow cooling trend anomoly-wise for the rest of the year for the US and most of Canada.
http://www.capecodweather.net/cfs-archive/771-cfs-outlook-april-1st-2009
I noticed that despite all the warming going on in Antarctica, it’s last high-temp record was set in 1974. 1978 for the south pole itself.
However, the record low was set in Vostok in 1983.
I wonder if Steig would comment.
It kinda makes you wonder doesn’t it.
Steven Goddard…
Interesting and very useful article! From your article:
So no, record high temperatures are not unusual and should be expected to occur somewhere nearly every day of the year. They don’t prove global warming – rather they prove that the temperature record is inadequate.
I have insisted since 2005 that the very small fluctuation of temperature observed in the last decade fits within the normal fluctuations of temperature which can occur during the Holocene. The bounds for the oscillation, incorrectly called “anomaly”, are from -3 °C to 3 °C, which give a total fluctuation of 6 °C.
I think these guys (AGWers) are skilled businessmen who are taking advantage of this cyclical momentum to catch money. (Sorry, Anthony… I cannot resist saying it)