By Christopher Monckton of Brenchley
The cold weather on both sides of the Atlantic last month seems to have had its effect on temperature, which fell sharply compared with November, lengthening the New Pause to 8 years 4 months, as measured by the satellites designed, built and operated by Dr Roy Spencer and Dr John Christy at the University of Alabama in Huntsville:

The graph shows the least-squares linear-regression trend on the monthly global mean lower-troposphere anomalies. The least-squares method was recommended by Professor Jones of the University of East Anglia as a reasonable method of showing the trend on stochastic temperature data.
Recall that the Pause graph does not constitute a prediction: it simply reports the longest period, working back from the present, during which the temperature trend is not positive.
As always, here is the full 45-year UAH dataset from December 1978 to December 2022, showing a far from dramatic global warming trend equivalent to just 0.134 C/decade:

One of the virtues of the long Pauses that have characterized the global-temperature anomaly record even in recent decades is that they provide a simple and instantly comprehensible demonstration that the global-warming rate is proving to be less than half the original midrange prediction in IPCC (1990), which presented four emissions scenarios, of which the business-as-usual scenario A has proven closest to reality. For instance, Scenario B was based on the assumption that emissions would remain constant at the 1990 annual level until 2025. That didn’t happen. Emissions have risen by enough to increase the anthropogenic forcing by more than 1 W m–2 since 1990.
Though emissions have thus proven close to scenario A, that scenario’s 0.3 K/decade midrange medium-term prediction was more than twice outturn: observed warming since 1990 has been only 0.13 K/decade. Since scenario A predicted 3 K ECS, the corrected ECS based on outturn since 1990 is thus just 1.3 K: a beautifully simple argument.
A similar result is obtainable by another simple method: energy-budget analysis. In a recent column I demonstrated that analysis, prompting some commenters to ask for an explanation of the energy-budget equation. So here goes.

The energy-budget equation says that equilibrium doubled-CO2-equivalent sensitivity (ECS), the standard metric, is the product of the anthropogenic fraction M of observed industrial-era warming ΔTobs and the ratio of the doubled-CO2 forcing ΔQ1 to the difference between observed industrial-era forcing ΔQobs and the satellite-observed radiative imbalance ΔNobs.
At a thermal equilibrium (such as the period from 1850-1930 when the trend in global mean surface temperature was zero) the solar radiative energy absorbed in the Earth’s atmosphere and the thermal infrared radiation emitted from Earth to space are about equal.
The positive energy imbalance ΔNobs that has since been measured, however, indicates that the Earth-atmosphere system is gaining energy, which is why it is warming.
The denominator ΔQobs – ΔNobs in the equation is the component in period forcing ΔQobs realized to date in period observed warming ΔTobs. The ratio of doubled-CO2 forcing to that realized component in period forcing converts the anthropogenic fraction of ΔTobs to ECS.
In the equation, if one increases the estimate of any of the four terms shown in red one increases ECS. If, however, one increases the estimate of observed period forcing ΔQobs, shown in green, one reduces ECS.
In short, the energy-budget equation is an excellent way to see what is going on under the hood. One can watch as the usual suspects wrench and torture the data so as to shore up the high-ECS narrative on which the tottering, shoddy edifice of international wreck-the-hated-West policy is unsoundly founded.
Take the anthropogenic fraction Mof industrial-era warming.One may deduce from Table 2 of Wu et al. (2019), giving anthropogenic and natural components in warming over eight periods covering 114 years to 2013 that about 74% of warming to date was anthropogenic. Yet climatology tends to push Mup to 100%, and extremists will try to maintain that Mis about 110%- i.e., the Earth would be cooling were it not for our influence on the climate.
Observed industrial-era temperature ΔTobs is also being pushed upward. HadCRUT4 said warming to early 2022 was 0.93 K – call that 0.95 K to date. But HadCRUT5 pushes that up to about 1.05 K, and IPCC (2021) jumps it up startlingly to 1.27 K.
It is the same sad story with the doubled-CO2 forcing ΔQ1. As far back as the 1980s, we were told that the uncertainty in ΔQ1 was ±10%. However, though the CMIP5 models (Andrews 2012) gave ΔQ1 as a mean 3.45 W m–2, and CMIP6 gave 3.52 W m–2 (Zelinka et al. 2020), IPCC (2021) hikes it by 14% to 3.93 W m–2.
Likewise, the official narrative has for decades tried to minimize the value of observed industrial-era forcing ΔQobs so as to maximize ECS. As Professor Lindzen has long pointed out, a number of dodges are used, not the least of which is the notion that our particulate emissions had caused a large negative aerosol forcing, which the Professor bluntly describes as a “fudge-factor”. The actual aerosol forcing is likely to be vanishingly different from zero. NOAA shows 3.2 W m–2 forcing from anthropogenic greenhouse-gas emission alone, before allowing for ozone forcing of another 0.4 W m–2. However, IPCC (2021), afer deploying the aerosol fudge-factor, gives just 2.8 W m–2 all in.
Hitherto, though, the net radiative imbalace ΔNobs had been left alone. It was generally given as around 0.79 W m–2. However, the increasingly desperate revisionists have been at that one, too, suggesting last year that ΔNobs is more like 1.1 W m–2.
Sure enough, if one plugs all these altered but allegedly “midrange” estimates into the energy-budget equation ECS comes out at 3.2 K, in line with the long-running official narrative. Now you know how the trick is done: change all five variables so as to maximize midrange ECS and thereby purport to justify the otherwise obviously excessive official figure.
Taking the more reasonable and more mainstream values shown in my earlier piece on the energy-budget method gives 1.3 K midrange ECS, in line with the observationally-derived 1.3 K described earlier herein.
Another virtue of the energy-budget method is that it requires absolutely no knowledge of the amplitudes of temperature feedbacks. Which is just as well, because IPCC’s current estimate that ECS is between 2 K and 5 K implies a total absolute feedback strength of between 0.22 and 0.27 W m–2 K–1. The breadth of that interval, just 0.05 W m–2 K–1, is so narrow that any attempt to derive ECS by feedback analysis, whether directly or via diagnosis of feedback strengths from models’ outputs, is, statistically speaking, no better than guesswork. The uncertainties in feedback strength are far too great to give any credence to any prediction from any general-circulation model, since the feedbacks diagnosed from those models exceed the absolute feedback strength by an order of magnitude.
How long will the current Pause last? The UN, getting desperate now that this second Pause is beginning to look rather serious, is saying – probably rightly – that the next el Niño will bring the Pause to an end, just as the last big one ended the previous 19-year Pause. But the fact of these frequent and prolonged Pauses provides a striking visual demonstration of the fact that the world is simply not warming at anything like the originally-predicted 0.3 K/decade.
The profiteers of doom, of course, are presenting the Pause in a quite different light. They say that the eight years of the current Pause showed the warmest temperatures on record. Except that it was a whole lot warmer in the medieval, Roman, Minoan and Egyptian Old Kingdom warm periods, which somehow never get mentioned as part of the record.
Some commenters here have speculated that the Sun can be expected to go through 60 quiet years, leading gradually to global cooling. However, it is not yet clear that reliable long-term forecasts of solar activity can be made. A striking example of the difficulties is the current sunspot record:

The predicted sunspot number is the red curve. Actual data is the black spline curve, with the six-month running mean in blue. The departure from the prediction – on the high side – is worth keeping an eye on. It may be that the Sun’s quiet period is already over. Who can say?
What we can say is this. Even if the whole of the West actually attained net zero emissions by 2050, the world would be just one-seventeenth of a degree cooler than if the current and continuing uptrend in global emissions were to continue. And each $1 billion we spend on destroying the Western economies would prevent between one four-millionth and one thirty-millionth of a degree of future warming. And we can’t even achieve that much, because the necessary techno-metals to attain net zero are just not available.
As I was saying …
https://www.drroyspencer.com/2023/01/uah-global-temperature-update-2022-was-the-7th-warmest-of-44-year-satellite-record/#comment-1422287
It did turn out that 2022 was warmer than many people expected. The reason was twofold. First, Antarctic sea ice remained low until mid November. The rebound is why November-December saw a big drop. Second, the Tonga eruption increased upper atmosphere water vapor increasing its greenhouse effect. This effect will continue to lessen over time.
Why is it alarmists always want to ignore natural variations?
Because they are not natural.
Nobody is ignoring variation. In fact, Bellman and I have both been trying to convince the WUWT community that there is a lot of natural variation in the monthly UAH TLT anomalies with the sd being about 0.25 C and the sd on the 1m deltas of about 0.125 C and 2m deltas of about 0.145 C.
A Oct-to-Nov drop from 0.32 C to 0.17 C is only 0.15 C. That makes the drop a 1.2σ event with a 11.5% chance of happening in any given month. The expected recurrence interval of such an event is 1-in-9 months; hardly noteworthy. BTW…there have been 61 out of 527 occurrences of a drop of 0.15 C or more in the UAH record. That is a 11.6% and nearly spot on with the expectation. A similar analysis can be done for the Nov-to-Dec drop.
A Oct-to-Dec drop from 0.32 C to 0.05 C is only 0.27 C. That makes the drop a 1.9σ event with a 3.1% chance of happening in any given month. The expected recurrence interval of such an event is 1-in-32 months; hardly noteworthy. BTW…there have 18 out of 526 occurrences of a 2m drop of 0.27 C or more in the UAH record. That is a 3.4% and nearly spot with the expectation.
All of this seems to fall on deaf hears though.
And yet you ascribe meaning to tiny 10-20 mK changes in the UAH average of averages.
You can’t have it both ways.
Pro tip, Bdgwx –
there’s this function in Excel where you can decrease the number of decimal points showing for the number in a cell with just a click.
Saves cluttering up reports with meaningless “0.05“ type nonsense.
Just make it “0”.
Much more meaningful and applicable to the real world we actually inhabit.
(No need to thank me – the folks at Microsoft worked this out decades ago 🙂 )
You think 0 is the same thing as 0.05?
If a person consumes 0.05 grams of fentanyl you think it is equivalent to consuming 0 grams and would advise no ill effects?
Is this really the argument you want to be making?
Are you really this clueless?
Was that a rhetorical question?
The context is Temperature, not fentanyl.
Is this really the argument you want to be making?
Obviously if 0.05 grams of fentanyl will kill you, so will 0.05 grams of iron.
What is it about alarmists and their complete inability to understand basic analogies?
MarkW said: “Obviously if 0.05 grams of fentanyl will kill you, so will 0.05 grams of iron.”
That’s your strawman. You and you alone own it.
A more realistic example to demonstrate the absurdity of arbitrarily reducing the number of significant figures to 0 is the following.
0.05 grams of iron is the equivalent of 4.4 MJ of energy.
However, employing the Mr. “trick” above of just arbitrarily pretending like it is 0 grams because it looks small would cause you calculate 0 J of energy.
That’s a huge difference. 4.4 MJ is infinitely larger than 0 J. Nevermind that 0.05 G is infinitely larger than 0 G.
The very NIST TN1900 you brought up reduced significant digits from four to three with decimal digits going from 2 to 1.
Funny how that works.
You are the one trying to claim that all minute quantities are equally significant.
Now you are going even further afield to escape from your earlier stupidity.
I did no such thing. The topic of significance was never mentioned until now. That’s your goal post move; not mine.
My position on this matter has been and continues to be that arbitrarily changing data because it isn’t big enough is inappropriate; so much so that doing so could lead to the death of a person.
And since you mentioned significance let’s discuss that now. I’ll add to my position that significance whatever it may be still does not justify arbitrarily changing data.
The fact remains that UAH reported 0.05 C for 2022/12. I’m not going to arbitrarily change that or any other months value to 0 because you and a few other commenters don’t like what UAH reported. If you think UAH should round all of the values to the nearest integer then take it up with Spencer and Christy.
Or handle a little bit of piss taken out of them, it seems.
🤔😂🤣🙄
I stand by statement. No reasonable person would take a figure with 1, 2 or whatever number of significant digits and transform it into figure with 0 significant digits with the sole purpose of reducing clutter and making things more meaningful. If Dr. Spencer and Dr. Christy had done what Mr. is suggesting then you would see a graph with nothing but a straight line at 0 C the whole time. So yes, I am making the argument that arbitrarily reducing figures to 0 significant digits is preposterous.
Yes its true, you really are this clueless…
“MarkW said: “Obviously if 0.05 grams of fentanyl will kill you, so will 0.05 grams of iron.”
That’s your strawman. You and you alone own it.”
The context was temperature.
Is 0.05 grams of fentanyl YOUR “strawman?
Like most alarmists, bdgwx’s only skill is changing the subject.
And never explaining how CO2 can be the temperature control thermostat when it continues to rise at every datapoint but temperature doesnt.
doonman said: “And never explaining how CO2 can be the temperature control thermostat when it continues to rise at every datapoint but temperature doesnt.”
I have no interest in trying to explain something that I feel is not supported by the consilience of evidence.
MarkW said: “Like most alarmists, bdgwx’s only skill is changing the subject.”
I’m not the one that suggested that I round UAH TLT anomalies to the nearest integer before using them in a thread discussing the variation of those values. That was Mr. above that did that.
BTW…is there a similar rule for changing the subject that you have for pinning lies on other people? I’m just trying to figure out how your mind works.
It doesn’t matter what the context is. Arbitrarily changing data whether it is temperatures of TLT, mass of fentanyl, or whatever because of your feelings is unethical at best and life altering at worst. The fentanyl example should have been obvious.
Another irony alert from the dedicated temperature data adjustor-mannipulator.
the context was indeed temperature.
the planet is about 300 degrees hotter than 0.
so about 300.05 is meaningless.
the trick is that by using tiny deltas, you lose sight of the absolute.
as for presumably invoking einstein to say 0.05g of iron is whatever energy…………..
+100!
1) UAH TLT is about 263 K.
2) An increase of 0.05 K in the atmosphere represents an input of 0.2e21 joules of energy. That is the equivalent of over 3,000,000 Hiroshima bombs. That is hardly what I’d call meaningless.
3) Do you really think Dr. Spencer and Dr. Christy should have rounded all of the values in this file to the nearest interger?
4) Are you going to call Monckton out for using the 0.05 C 2022/12 value as is?
To be consistent, bdgwx, shouldn’t you be presenting the Hiroshima bombs value as –
2,999,999.006 Hiroshima bombs?
You are clueless! Every practice I have seen say true value should be rounded to the largest uncertainty value. Like it or not, the NWS/NOAA uncertainty values are the values that should be used for calculations. Prior to 1980, and even after that date for MMTS, these agencies specify ±1 degree.
Anyone that thinks the LLN or CLT justifies increasing the resolution of an average has no idea what these theories about nor what they are used for. The CLT for sure only deals with sampling and only defines that the DISTRIBUTION of the sample means will be approximately normal.
Well Jim from the well of empathy my old heart possesses for Clueless Climate Cultists, I did try to point Bdgwx to the simple Excel function that renders his hundredths of a decimal point of 1 degree C to realistic whole numbers.
Alas! It seems my charitable efforts were in vain 🙁
Yes it was definitely in vain with me. There’s no way you’re ever going to convince me to arbitrarily change UAH data like that. You are free to petition Dr. Spencer and Dr. Christy to report all of the figures to the nearest integer but I strongly suspect your effort will be in vain there too.
Mate it’s a wind-up, a piss-take.
I didn’t mean for you to go the whole “Rainman”.
Definitely!
The data being discussed is the UAH TLT, which are calculated from microwave emissions by O2, they quote the data to the nearest 0.01º. The NOAA uncertainties are irrelevant to these measurements.
UAH does NOT report the uncertainties of temperatures derived from microwave radiation.
bdgwx,
Selection of measured numbers and converting them to zero is quite common in climate research by the trendiest of the moment.
Drs Spencer and Christy gained international applause for their derivation of air temperatures from microwave emissions from oxygen as measured by instruments on satellites. This was excellent, ground breaking work for the advancement of science. Their work has stood the test of time since the 1970s. Nobody has demonstrated that the work violates any scientific principles.
Here in Australia we have “scientific” bodies like the Australian Academy of Sciences, the CSIRO and the BOM (plus other acronyms being paid to be wise about temperatures.) The first 3 of these have released reports in the last year or two that they use to influence the direction of political policy.
Not one mention of UAH (or RSS) is in any of these long reports on the state of Australian climate.
The pseudo-scientific bodies have taken a collection of valid numbers produced by UAH and then disappeared them from where they ought to be discussed.
They have credos that favour an idea of a warming world. Science that throws doubt on their credos is disappeared by them in a way that can be described as immature, juvenile, anti-science, ignorant or maybe kindergarden-level stamping of petulant feet.
It is just so, so wrong and sorrowful.
Here is my graph of what they fear to discuss from UAH:
http://www.geoffstuff.com/uahjan2023.jpg
GS said: “Selection of measured numbers and converting them to zero is quite common in climate research by the trendiest of the moment.”
Really Geoff? You too?
You really think I should have rounded all of the UAH TLT anomalies to the nearest integer like what Mr. is suggesting before analyzing them.
Something like this…
That would certainly change the results I originally posted above.
bdgwx,
Please read what I wrote.
If you comment back to me, please ensure that we are on the same topic.
Geoff S
You said “Selection of measured numbers and converting them to zero is quite common in climate research”
The context and topic we are discussing and what Mr. told me I should have done was round all of the UAH anomalies to the nearest integer before I did the analysis in this post [1][2]. As you can see a lot of people support that position.
I’ll ask you again…You really think I should have rounded all of the UAH TLT anomalies to the nearest integer like what Mr. is suggesting before analyzing them?
Your statement sure makes it sound like you are defending Mr.’s position. If you aren’t then perhaps you should address Mr. and the others who support his position.
The standard deviations you are quoting are computed how? What is the frequency distribution you are using.
I hope you aren’t using anomalies to compute a standard deviation because those should carry the variance of the underlying real temperatures, and not the variance of the smaller anomaly values. In fact, when subtracting random variables, which is how anomalies are calculated, the variances add.
bdgwx,
Have you received permission from Mother Nature to use the non-natural concept of a man-made month to guess at temperatures over chosen areas to invoke the mumbo-jumbo of mathematical forecasting and probabilities?
Nature has a history of unpredictability that nobody has solved for how Earth behaves.
Let’s look at how Nature has differed from your mental exercises after (say) 10 more orbits of Earth around the Sun.
No I didn’t. Frankly I didn’t realize I needed Mother Nature’s permission to analyze it or that anthropomorphizing it was even a legitimate thing.
BTW…these conversation sure do have way of going south quickly. In this post I’m being told I should round all UAH TLT anomalies to the nearest integer before using them. In a recent post I was told that science doesn’t make predictions, superstition is a viable alternative to science for making predictions. And now it is being insinuated that we natures permission to analyze and predict it.
Does the madness ever end?
The madness is your inability to read for meaning. For instance, *science* doesn’t make predictions based on curve fitting to past data, it develops theories that can be used to calculate future observations and then compares them to the future observations in order to correct the theory. That is *NOT* the same as saying science doesn’t make predictions – but that is how *you* read it.
How many of the climate models predicted the last pause? How many predicted the current pause? At some point real science would change their theories to account for reality.
All they can do is post-dict…
Bdgwx-san:
it’s not UAH6’s natural variance of global temperature anomalies that’s being debated, it’s the gigantic disparity between the disconfirmed CMIP6 computer model projections (upon which government hacks are justifying wasting $100’s of trillion) and UAH’s 44-year empirical data.
The laughable CMIP6 computer models predicted the global warming trend should be 0.37C/decade by now (and increasing in the future), while UAH6 shows it’s actually only 0.13C/decade over the past 44 years!
The invalidated CMIP6 model projections are complete rubbish and are utterly devoid from reality.
The only place the CAGW hoax exists is in invalidated climate model outputs, and governments are using inValidated CMIP6 data to justify unnecessary CAGW programs that are needlessly: starving people, destroying economies, keeping billions of people in poverty, killing people, causing energy shortages, blackouts and brownouts, destroying peoples’ jobs, destroying entire industries and contributing to humongous debts for absolutely no reason whatsoever!
That is the issue….
SAMURAI said: “The laughable CMIP6 computer models predicted the global warming trend should be 0.37C/decade by now (and increasing in the future)”
No it didn’t.
SAMURAI said: “The invalidated CMIP6 model projections are complete rubbish and are utterly devoid from reality.”
And yet that “complete rubbish” and “utterly devoid from reality” 1700+ month projection was significantly better than your 6 month projection.
“Why is it alarmists always want to ignore natural variations?”
You will have to ask Monckton. He’s the one who keeps talking about a pause whilst ignoring the obvious natural causes. As I said, I consider these short term cherry picked trends nearly meaningless.
You consider them meaningless, I bow down before your awesomeness. In the meantime we rational thinking people will ignore your meaningless remarks
Do you think the 2011/01 to 2022/12 trend of +0.31 C/decade is meaningful?
I agree the pause is meaningless, in the sense that it is a short time period that could quickly be cancelled out by a rise in temperatures that occurs in the next decade. That sort of variation happens all the time.
I think one of Monckton’s points is that we are frequently told that GHGs are the driver of temperature increases, and that as more goes into the atmosphere, the warmer the earth will get. For the past 8 (or however many) years they have gone up, but temperatures have not. That suggests that there are other, probably many, variables at play, and that we don’t have any reason to believe that GHGs alone are a control knob.
If alarmists are prepared to concede that the issue is complicated, and can’t be simply reduced to greenhouse gases as the sole driver for climate change, there would be room for fruitful discussion. But to make that concession would take the fear factor out of the discussion, which is really what drives the global warming movement. Without that recourse to fear, people will lose interest and move on to the next crisis du jour.
Monckton is presenting evidence of a lack of connection between GHGs and temperature. That is what is meaningful.
Dave Yaussy said: “I think one of Monckton’s points is that we are frequently told that GHGs are the driver of temperature increases”
No, you are frequently told by science that GHGs are A driver of temperature increase on monthly, yearly, and decadal scales. It is the contrarians here that are telling you that it is THE driver. They do this to create a strawman that they can tear down and claim victory every time they see a drop in the UAH TLT anomaly from month-to-month.
Dave Yaussy said: “For the past 8 (or however many) years they have gone up, but temperatures have not. That suggests that there are other, probably many, variables at play, and that we don’t have any reason to believe that GHGs alone are a control knob.”
Which is what science has been saying all along.
Dave Yaussy said: “Monckton is presenting evidence of a lack of connection between GHGs and temperature. That is what is meaningful.”
The Monckton Pause isn’t evidence against a connection between GHGs and temperature. The Monckton Pause is consistent with it.
I’ve posted this before but the individual CMIP models show lots of extended pauses embedded in the secular warming trend.
And here is an example of a trivial model that shows how the steady increase in CO2 is not inconsistent with the highly variable monthly UAH TLT anomalies and extended pauses.
Then what exactly is the percentage contribution of anthropogenic GHGs? Why isn’t it up on monthly and yearly scales?
CS said: “Then what exactly is the percentage contribution of anthropogenic GHGs?”
IPCC AR6 assigns 3.84 W/m2 of GHG ERF. The total ERF is 2.84 W/m2. That makes the percent of GHG forcing relative to the whole of 3.84 W/m2 / 2.84 W/m2 = 135%.
Note that non-GHG and natural forcings net to -1.00 W/m2 which is -1.00 W/m2 / 2.84 W/m2 = -35% of the whole.
Also note that CO2 alone is 2.16 W/m2 which makes it only 2.16 W/m2 / 3.84 W/m2 = 56% of the GHG forcing and 2.16 W/m2 / 2.84 W/m2 = 76% of the total forcing.
CS said: “Why isn’t it up on monthly and yearly scales?”
Sorry. I don’t think I understand the question. My point is that on these time scales there are many agents that drive the UAH TLT anomalies.
What is wrong with this picture?
Monckton has demonstrated that at least for the last 8.3 years there has been no correlation between increasing atmospheric CO2 and global temperatures. I have demonstrated that during 2020 there is no correlation between declines in anthro’ CO2 and atmospheric CO2, ergo no correlation with temperatures at a monthly scale:
https://wattsupwiththat.com/2022/03/22/anthropogenic-co2-and-the-expected-results-from-eliminating-it/
There is nothing wrong with the picture. The fact that the net GHG forcing is different than the total net forcing necessarily means that GHGs are not the only factor. The only configuration of ERF that would support a claim like that is if erf(GHG) = erf(sum(Ai)) and all other candidate agents Ai had an abs(erf(Ai)) = 0 W/m2.
Don’t conflate a percentage of 135%, which occurs because some agents have negative ERF values, with a statement that GHGs are the only factor.
More unintelligible word salad.
Speaking of creating a strawman! We are told that we must transition away from fossil fuels because the CO2 is responsible for runaway, ultimately catastrophic warming. That is, it is the dominant driver! Words like “Tipping Point” are used frequently, albeit inappropriately. Most “lukewarmers” acknowledge some warming from so-called GHGs, but dismiss the claim that it will be net detrimental. There are several, such as Monckton, that make a case for the climate sensitivity being near the lower-bound of the most commonly accepted value (3.0 deg C +/-1.5).
Yes. Here is a graph I see regularly on Twitter that shows CO2 is the only driver of CAGW and that is why we must wreck all western economies and reduce the population by several billion people!
bdgwx says:”… told by science that GHGs are A driver of temperature increase on monthly, yearly, and decadal scales.”
If science says GHG’s (re CO2) are only one driver of temperature then why is it the only one that is being controlled out of existence? Why does 350.org exist? Why are we told constantly to lower our carbon footprint?
By the way please name the other drivers of temperature increase.
mkelley said: “why is it the only one that is being controlled out of existence? Why does 350.org exist? Why are we told constantly to lower our carbon footprint?”
I don’t know. You’ll need to ask the relevant parties involved. I cannot speak for them. These are also policy focused questions. I do not engage in policy based discussions.
mkelley said: “By the way please name the other drivers of temperature increase.”
You have solar, volcanic activity, biological activity, geological activity, ocean currents, albedo, dust, aerosols, continental drift, GHGs, clouds, ENSO, AMO, PDO, NAO, tropical cyclone activity, winds, and many others.
Each agent has its own ebb and flow profile with cycles ranging from hours to millions of years. That rates at which these agents modulate the flows of energy into and out of the atmosphere vary significantly.
LOL, you can probably find a cited peer-reviewed study from the ‘cultista’ somewhere that links CO2 as the cause of “solar, volcanic activity, biological activity, geological activity, ocean currents, albedo, dust, aerosols, continental drift, GHGs, clouds, ENSO, AMO, PDO, NAO, tropical cyclone activity, winds, and many others.”
Don’t forget to include postage rates in the U.S. versus time!
Huge effect!
I’m not sure that I can for some of those. Nor would I try. Hypothesizing that CO2 effects continental drift would not follow even the minimal requirements first principal reasoning.
bdgwx: “I do not engage in policy based discussions.”
Leftist policy developed by Western governments, goaded by activist NGOs and a rabid media, dictate the CliSciFi official science and mathematical outputs. You are deeply involved in policy based discussions, the import of which are disguised by pseudo-science.
The only climate-related discussion worth adult consideration is the undeniable fact that the UN IPCC climate models are not sufficient to fundamentally alter our society, economy and energy systems. All CliSciFi output is meant to obfuscate that fact in furtherance of various ideological and monetary goals.
Anyway, Nut Zero is imploding and the only question is how much it will cost the average person before its impossibility is finally recognized by voters.
I think you have me confused with someone else. I’m not a leftist. I hate politics with a passion. And I think policy discussions distract from the more interesting discussions regarding science.
I think we are on common ground now bdgwx.
EXCEPT –
You ignore the indisputable fact that the establishment climate scientists enabled, not even tacitly, their discipline to be suborned as unalloyed, rank politics.
This cabal (as outed in the Climategate emails) became, and has largely remained, “the loudest voice in the room”.
It is the self-imposed omerta being practiced by the vast majority of climate researchers in academia that have condoned this pre-Enlightenment type situation.
Do you ever use your undoubted knowledge about climate research to call out the academics who should be telling their activist “colleagues” to stay in their lane?
”ocean currents, winds, ENSO”
Please tell us by which mechanism ocean currents winds and ENSO can increase global temperatures.
Thanks.
(Hint…An El Nino spike is not an increase in global temperature, it’s an anomaly)
The politicians who are funding the alarmists are always making such claims.
Not once has any of your alleged scientists spoken up to correct these lies.
Therefore they own the lies, even if they never personally stated them.
Particularly where the MSM embellish and misrepresent research findings and the ‘scientista’ stay dead quiet. You’re right, Mark, if they don’t correct the misrepresentations they own it 100%.
Let me make sure I have this straight. Your position is that when someone lies you have the right to pin that lie on someone else? Is that really your position?
An example to consider –
Biden, Trudeau etc and most health ministers repeatedly publicly asserting that the Pfizer, Moderna etc al COVID mRNA vaccines were “safe and effective”, and “will stop transmission and contraction of COVID”.
Now, it has been revealed in the FDA records that approved the vaccines for emergency rollout to the public that both Pfizer and Moderna disavowed on recird the capability of their products to contain transmission & contraction of COVID.
Fauci knew this, because he was instrumental and involved in the official FDA approval.
Yet he publicly continued the lie about halting transmission & contraction.
But then he let all the politicians and health ministers as well continue to assert that “getting vaccinated will stop you getting COVID and passing it on”.
But the health ministers et al, being in positions of “trust the science” responsibility to the public, never questioned, investigated or called out Fauci to table the record where the efficacy of these vaccines was demonstrated.
This was/is the most critical and essential obligation to the public for officials such as health ministers.
So yes it is entirely rational and reasonable in this example to also pin Fauci’s lie on the health ministers and politicians, who present themselves as the voice of the “experts” / ” the science” in the field.
Is this not the same situation with climate “scientists” who choose to set their expertise to “mute” when they know or should know or at least investigate/ question dubious claims (lies) put out by “the loudest voice in room” such as Mann and his fellow travelers?
That sure spiraled out of control and escalated quickly.
You’re actually seeing this through and indicting me other people’s lies and misdeeds? Seriously?
And just this week it has been revealed that the U.S. federal government extorted Twitter and FaceBook into banning users who dared to post anything outside of the official storyline.
As a result of the extortion, until the recent hostile takeover, Twitter had scores of ex-FBI, CIA, DOJ, etc. agents working on the inside as a de facto Ministry of Truth; this suppression went way beyond just SARS-2 information.
Twitter was an arm of the U.S. Government, think about this.
Folks, the main ammo dump of the whole AGW invasion against civilization has just been pinpoint targeted and hit!
The likes of Mann etc etc have been orchestrating a false-flag operation with climate studies since the get-go.
BS, we only ever hear the breathless chant that anthropogenic CO2 is causing runaway warming. 0.03% of 0.04% is doing bugger all.
Streetcred: “BS, we only ever hear the breathless chant that anthropogenic CO2 is causing runaway warming.”
Runaway warming is not possible on Earth. See Goldblatt and Watson 2012 for more information. So no, you are most certainly not hearing that from reputable scientific works. I suspect you are hearing from it mainly from contrarians who don’t know about the radiation limits and who are mainly interested in created a strawman argument.
Poor gbw, the boogie man “contrarians” are abusing him again.
“I suspect you are hearing from it mainly from contrarians”
This is demonstrably false:
https://www.un.org/sg/en/content/sg/statement/2018-09-10/secretary-generals-remarks-climate-change-delivered
“If we do not change course by 2020, we risk missing the point where we can avoid runaway climate change”
Is the UN contrarian?
https://www.nbcnews.com/sciencemain/runaway-greenhouse-easier-trigger-earth-thought-study-says-6c10761164
Headline is “‘Runaway greenhouse’ easier to trigger on Earth than thought, study says”
Is NBC News contrarian? (note that they cite the same study as you to suggest it’s possible in their headline)
““If we burn all reserves of oil, gas, and coal, there’s a substantial chance that we will initiate the runaway greenhouse.” – James Hansen, quoted at https://www.technologyreview.com/2012/01/13/256801/how-likely-is-a-runaway-greenhouse-effect-on-earth/
Are MIT or Hansen contrarian?
Studies in the 1980s and ‘90s suggested the present-day Earth was safe against a runaway, but a paper published this week in Nature Geoscience argues that “the runaway greenhouse may be much easier to initiate than previously thought.” Indeed, the study suggests that without the cooling effects of certain types of clouds, modern Earth would already be well on its way to broiling like Venus.
The referenced paper: https://www.nature.com/articles/ngeo1892.epdf – I note that this is the same authors as the paper you cite, published after your cited study.
Is Nature Geoscience a credible source? Is it or Scientific American contrarian?
I could cite more – it only took me 2-3 minutes to find these. Yes, perhaps the reporting is hyped (when is it not?), but no, it’s not coming from contrarians.
It is my understanding that Hansen has backed off his belief that a runaway greenhouse is possible on Earth.
The Goldblatt et al. 2022 publication says that a runaway greenhouse is not possible on Earth inline with their conclusion from 2012. What is different is their estimate of the radiation limit at about 282 W/m2 as opposed to 310 W/m2. Earth only absorbs 240 W/m2. Sure, that’s closer to 282 W/m2 than 310 W/m2 but it’s still close to the threshold.
And I stand by what I said. Seeing that I hear about a runaway greenhouse frequently in the blogosphere I think Streetcred is mainly hearing it from contrarians and not science.
Again
Is the UN contrarian?
Is NBC News contrarian?
Is Scientific American contrarian?
You also ignore the 2013 paper that was linked.
I have given you solid evidence with links that NON-CONTRARIAN sources are talking about runaway warming, yet “I stand by what I said”.
What is the evidence for your contention that “Streetcred is mainly hearing it from contrarians” – because you FEEL that way?
(Note that my point was specifically against this contention of yours that “you are hearing from it mainly from contrarians who … are mainly interested in created a strawman argument.”, not about “the science” – so let’s stick to that)
As I have observed in the past and someone else observed in this conversation, you are quite eager to call out people here, yet you never hold these people and publications (i.e. those I cited) to the same standard. This is hypocritical at best, if not dishonest.
I don’t know what the UN, NBC News, and Scientific American’s positions are. I don’t follow their work.
Typo…when I said Goldblatt et al. 2022 I was actually discussing Goldblatt et al. 2013. I didn’t ignore the paper. Note that it too says a runaway greenhouse is not possible. The NBC News article which interviewed Goldblatt says the same thing so I don’t know what you’re trying to get at here.
My evidence is the consilience of evidence. The evidence does not support the hypothesis that a runaway greenhouse is possible on Earth. I simply don’t see a lot of talk of a runaway greenhouse as a viable possibility in academic literature. And I read a lot of peer reviewed climate literature. I see a lot more talk about in the blogosphere where it is used as a strawman.
I have called Hansen out numerous times. I’ll do so again now. His earlier opinion just simply is not supported by the evidence.
“I don’t know what the UN, NBC News, and Scientific American’s positions are.”
Are you seriously suggesting that they could be “contrarian” sources?
As stated twice, now a third time:
Note that my point was specifically against this contention of yours that “you are hearing from it mainly from contrarians who … are mainly interested in created a strawman argument.”, not about “the science” – so let’s stick to that
Your contention, quoted above, is proven wrong but you still refuse to admit it, and you changed the argument to something that I specifically excluded from the conversation.
You are not engaging in honest discussion.
eta:
Also, with regard to the papers, it was the 2012 paper that you initially referenced. The 2013 paper is where this came from: “the runaway greenhouse may be much easier to initiate than previously thought.” That seems to be just a bit different than “not possible” and refers to the conclusions of the 2013 paper.
If you can show me where the 2013 paper states “not possible” I will retract the above statement.
I still don’t know what the UN, NBC, and Scientific American’s positions are. I’m not saying the are or aren’t contrarians source. I’m not saying anything about that.
You pointed out one scientist, Hansen, who, as I understand, no longer believes a runaway greenhouse is possible. That’s hardly what I would consider a prevailing thought that it is possible.
Being much closer is not the same thing as being likely or even possible. The paper literally says “an anthropogenic runaway greenhouse is unlikely”. The authors do say that 3,000 ppm despite being extreme is “possible”. They estimate the threshold at 10x that amount or 30,000 ppm which Goldblatt says “really seems quite unlikely”.
You tell me…is 30,000 ppm of CO2 possible?
Last time:
“you are hearing from it mainly from contrarians who … are mainly interested in created a strawman argument.”
My entire point is about what you said, which you are “standing behind” yet also backing down from. Instead of simply acknowledging that your contention has no basis in fact, you have employed convoluted rhetoric to avoid addressing my point.
You tell me…is 30,000 ppm of CO2 possible?
I don’t know, but that is also not what I asked:
“If you can show me where the 2013 paper states “not possible” I will retract the above statement.”
You did not provide what I requested:
“which Goldblatt says “really seems quite unlikely”” is not saying “not possible”
I will conclude with:
You claimed that the talk about runaway warming was coming from “contrarian” sources. While Streetcred may have exaggerated by saying “all we hear”, the simple fact, as I demonstrated with direct links, is that it is coming from the AGW crowd and reporters on the “believer” side of the issue. At no point did I attempt to address any scientific basis for such claims, as my entire point was to address your claim of the source of such talk.
Since you continue to change the subject and refuse to engage with what I am actually saying, there is no point in continuing this discussion. I leave it to the readers to reach their own conclusions.
I stand by what I said 100%. That is 1) Runaway warming is not possible on Earth and 2) I suspect you are hearing from it mainly from contrarians.
I never said Goldblatt et al. 2013 contained the phrase “not possible”. Just because that publication doesn’t use that exact phrase does not in any way change the consilience of evidence which says that it is not possible. And the publication is consistent with the consilience of evidence. It specifically states that 30,000 ppm is required. That is 10x higher than even the highest estimates I’ve seen. If you know of estimates even exceeding 3,000 ppm let me know. Otherwise, I am going to stick with the consilience of evidence and tell people it isn’t possible.
I am not going to be bullied into stating that a runway greenhouse is possible because you want me to say it. The only thing that will make change my position is a change in the consilience of evidence.
Understatement of the Week…
”Dave Yaussy said: “I think one of Monckton’s points is that we are frequently told that GHGs are the driver of temperature increases”
No, you are frequently told by science that GHGs are A driver of temperature increase on monthly, yearly, and decadal scales. It is the contrarians here that are telling you that it is THE driver. They do this to create a strawman that they can tear down and claim victory every time they see a drop in the UAH TLT anomaly from month-to-month.”
” NASA’s Dr Gavin Schmidt has pointed out, the IPCC’s implied best guess was that humans were responsible for around 110% of observed warming (ranging from 72% to 146%), with natural factors in isolation leading to a slight cooling over the past 50 years.
Similarly, the recent US fourth national climate assessment found that between 93% to 123% of observed 1951-2010 warming was due to human activities.”
What else you got?
Mike said: “What else you got?”
135% falls in the range of 72% to 146% so I’m not sure what the big deal is here.
Lacis, A.A., et al. (2010) Atmospheric CO2: Principal control knob governing Earth’s temperature. Science, 330, 356-359. doi:10.1126/science.1190653
You stand corrected.
jtom said: “You stand corrected.”
I stand by what I said.
That Lacis et al. 2010 publication is about why Earth’s temperature is approximately 15 C as opposed -18 C and why the difference between UWIR and DWIR is +155 W/m2.
We are not discussing why the GHE is +155 W/m2 or +33 C. We are discussing why atmospheric temperatures get nudged up or down from the +33 C broad state on monthly timescales. I even took great care to specifically call out the timescale because I knew from past experience that when there’s an opportunity to create a strawman some on WUWT will jump it.
BTW…I have that Lacis et al. 2010 publication in my archive. I’ve read it several times.
bdgwx,
Did you write a critique of Lacis expressing strength or weakness, then publish or post it on a blog?
WUWT readers are consistently pointing out weaknesses and errors in the science expressed by others. Christopher Monckton has already discussed Lacis in detail.
One of the sad hallmarks of Establishment researchers is their silence about weaknesses and errors of science reported by colleagues. Science does not advance from enforced silence; it advances by contesting the current wisdom.
Many of us are disgusted by this reluctance to criticise colleagues and to debate those with contrasting views. There is no happiness from excuses after the event that “We had to follow orders”. Nuremberg needs no duplication. Geoff S
No. And I don’t have to post a critique of Lacis et al. 2010 to know that CO2 is not THE one and only control knob that modulates UAH TLT temperatures.
You don’t even know that it is A knob!
never forget that it has been pre-determined that regulation of trace gases is the goal. The science must always be viewed from that perspective, first and foremost. Recognition of the full system is of secondary importance.
It is rank pseudoscience using circular reasoning.
it must be understood that it is a social engineering endeavor (political science). Straight from wiki:
The undergraduate course work is no longer in ‘climatology’ it is in ‘global climate change’. Here is the textbook for EESC 2300 Global Climate Change at U Penn. designed to teach students about “joining the debate over the best way to combat global warming.” https://www.amazon.com/Dire-Predictions-Visual-Guide-Findings/dp/1465433643#:~:text=Dire%20Predictions%20shows%20the%20evidence,and%20climate%20change%20and%20in
This is how students in a science field are first introduced to the subject of climate. Students pay money for this.
This is occurring in the Earth and Environmental Science (EESC) department.
I am not especially old but my undergraduate course work in climatology didn’t mention climate change once. From microclimates to synoptic climates, we were taught the governing principles without mention anything of global warming. How times have changed. I suspect psychological tactics of debating politics and social manipulation was covered in the arts buildings.
The language in the science department textbook linked above explicitly lays the groundwork to idolize ‘experts’ as authority, and to differentiate scientists from skeptics. never before in history has such overt manipulation ever occurred to science students.
“by Michael E. Mann (Author)”
Says everything…when I took Physical Geography eons ago, I don’t recall CO2 even being mentioned. It was considered an arts & humanities course, but it certainly wasn’t a political indoctrination camp.
This is all sick stuff, these people can’t think their way out of a wet paper bag.
it’s so f***ked up I can’t even articulate it. The 1 star reviews on amazon offer some consolation…
No amount of reason will make an iota of difference. Once the institutions of science are corrupted it’s game over for quite some time.
It will take bankruptcies cause by people no longer giving them tuition $$$s.
The 1LOT says it has to be.
IPCC AR5 WG1 Chapter 8 page 667
“Therefore, although CO2 is the main anthropogenic control knob on climate, water vapour
is a strong and fast feedback that amplifies any initial forcing by a typical factor between two and three. Water
vapour is not a significant initial forcing, but is nevertheless a fundamental agent of climate change.”
Describing CO2 as a control knob suggests theyare saying it is the main driver of temperature change.
I know. Which is what I said above. CO2 accounts for 76% of the total net forcing. By any reasonable definition that makes it the main anthropogenic control knob.
“I know. Which is what I said above. CO2 accounts for 76% of the total net forcing. By any reasonable definition that makes it the main anthropogenic control knob.”
You have no idea what you are talking about, bdwax, as usual. No human on this planet knows the exact climate effect of manmade CO2 emissions. That knowledge would require knowing the exact effect of perhaps ten other climate change variables, including unknown causes of climate change, unknown feedbacks, and temperature measurement errors
Sorry bdgwx. I am a little bit confused.
Do you think the IPCC is a reliable source of scientific information about climate change?
If they say that CO2 is a control knob, you can be confidant it is not.
Just to be clear. the IPCC is a political organisation.
The members of the Intergovernmental Panel are governments. The politically appointed representatives of those governments are professional negotiators, mostly with law degrees. Admittedly, some of them probably studied science until they were fifteen years old.
The IPCC is the antithesis of science.
You might not be aware but the rate of atmospheric CO2 growth rises when the temperature rises and falls when it falls. Temperature is the independent variable. CO2 growth is the dependent variable. Temperatures have been relatively stable recently, what with the pause and all, and so the rate of CO2 increase has been quite stable.
However, this is a big problem for the global warming people because it is well established now that an increase in temperature causes an increase in CO2 growth. And the IPCC thinks that an increase in CO2 causes an increase in temperature.
Fortunately the IPCC are wrong or we would have a positive feedback like putting the microphone too close to the speaker.
John in NZ said: “Do you think the IPCC is a reliable source of scientific information about climate change?”
Yes. Though keep in mind that the IPCC isn’t itself a source. They just collate the sources that are already available.
John in NZ said: “f they say that CO2 is a control knob, you can be confidant it is not.”
They also say that the Sun, volcanos, natural cycles (like ENSO), etc. are control knobs as well. Do you think we should eliminate those as control knobs as well since the IPCC mentions them?
John in NZ said: “You might not be aware but the rate of atmospheric CO2 growth rises when the temperature rises and falls when it falls.”
Yes. I am aware of that. Takahashi et al. 1993 is a good source for the rate at which this happens. It turns out that a change of 1 C results in a change of about 17 ppm.
John in NZ said: “Temperatures have been relatively stable recently, what with the pause and all, and so the rate of CO2 increase has been quite stable.”
Yep, about 8 years and 4 months. In that time the concentration has risen about 20 ppm.
John in NZ said: “However, this is a big problem for the global warming people because it is well established now that an increase in temperature causes an increase in CO2 growth.”
No. It is a problem with the contrarians who reject the law of conservation of mass. As I said above a 1 C change in temperature yields a 17 ppm change in atmospheric CO2 concentration. Yet the concentration has actually increased about 140 ppm to 420 ppm through 2022. Without the 1 C increase temperature it would have only been 403 ppm. Furthermore, humans have pumped about 310 ppm of CO2 into the atmosphere. That means with the temperature outgassing effect (+17 ppm) and biosphere/hydrosphere uptake processes (-170 ppm) nature removed about 153 ppm of CO2 from the atmosphere for us. The -153 ppm net natural sink is a lot different than +310 ppm net anthropogenic source.
A tacit admission of your pseudoscience.
We don’t have to know the exact effect to know that CO2 is A control knob. We know this because CO2, like all polyatomic gas species, impedes the transmission of energy and because no one has yet been able to show that the 1LOT does not apply to the climate system. And dare I say that given the countless NDIR and CRDS instruments which people trust their lives with deployed proving CO2 impedes energy transmission and given that no one in the history of science in general has found a violation of the 1LOT we can conclude that no one will ever be able to falsify the hypothesis that CO2 is A control knob.
You really don’t have a clue do you? Impede is sticking your finger onto a hole on a dike. At best CO2 DELAYS the transmission of energy at a small wavelength for a brief moment in time. When excited
CO2 will either collide or give up absorbed energy by emission.
Sooner or later when insolation begins to wain after Zenith, collision energy will go the other way and will be emitted on to space.
You had better hope that energy is delayed by collision or the earth will get a whole lot colder.
The one with the “11” setting?
In response to the interesting quote from AR5 by John in NZ, let us do the math following that quote. IPCC says direct forcing by CO2 is 3.93 Watts per square meter. In that event, the feedback forcing would be, say, 1.5 x 3.93, or 5.9 Watts per square meter per Kelvin of the 1.2 K reference sensitivity to doubled CO2. But that feedback forcing must be applied not just to the CO2 reference sensitivity but also to the entire reference temperature.
In reality, therefore, the feedback forcing is tiny – somewhere between 0.22 and 0.27 Watts per square meter per Kelvin of the entire reference temperature: and there is no way the IPCC or anyone else knows to a sufficient precision what so small a feedback forcing is or how much (or, rather, how little) it will change with temperature. All existing model-derived feedback strengths and consequently global-warming predictions are thus no better than mere guesswork.
And now bgwx is admitting that he thinks the IPCC is a credible source of science!
“No, you are frequently told by science that GHGs are A driver of temperature increase on monthly, yearly, and decadal scales.”
No, you are told frequently by science that GHGs are THE driver of temperature increases on monthly, yearly, and decadal scales.
There fixed it for you!
Why are we always told that the last year was hotter than the previous year because of CO2?
Why the push for wind mills and solar panels if CO2 isn’t considered THE cause for global warming?
Why are we continually told we must change our lifestyles because of CO2 increases in the atmosphere?
He won’t answer any of these questions, all he does is shill for the IPCC with pseudoscientific disinformation.
So I’m reading this, and bdgwx makes the best, most compelling post, and there are two ways that I know this. The first (and somewhat time consuming) way is to read it. The second (and much faster) way is to look at the score (-47). That score can only mean a brilliant post that nails it!
Or it can extend when the temps drop just as likely. the alarmist leave no room for dropping temps or even flat trends over 10 years. CO2 AGW is a failed theory.
+100!
+0.31C/decade equals 31C/millennium!!!!!
Oceans will boil!!!!
So you agree, it’s meaningless.
The clue ran right over your head without penetration…
I’ll take that as a “yes”.
Believe what you will, your stock-in-trade is peddling lots of pseudoscientific nonsense.
Still not hearing a “no”.
You would.
I did.
(Is there some well paid communist plot to disrupt all these comment sections with meaningless one liners?)
Some cheese with your whine today, monsieur?
Keep up the good work Comrade. I hope you are being as handsomely paid as I am.
“Comrade” hehehehehehe
bellcurveman digs deep and pulls out a PeeWee Herman.
OK, let’s try – the furtively pseudonymous karlomonte is handsomely paid by climate communists to disrupt all of these comment sections.
poor bellcurveman, can’t even generate his own insults, has to resort to plagiarism instead.
A sad day, really…
You would know more about that than I do.
Haven’t seen musher … is he commenting again ?
mosh did a drive-by for Kip’s last article, he mentions it above here.
I didn’t see that. I’m still waiting for him to show up and explain why arithmetic means are expectations.
Oops, my bad, it was in the Uncertainty III article:
Bellman
As does Lord M, he never says it has meaning he just finds it of interest and it annoys dopes like you when he posts it, so double fun.
Three long “pauses” 1980-1997, 2001-2015, now this last one.
Only warming has come at NATURAL El Nino steps ,
totally unrelated to atmospheric CO2.
Do the natural La Nina steps no cause cooling?
Complete baloney
Climate change is the net result of all climate change variables, and is NOT caused by an imaginary CO2 climate control knob.
So meaningless he has to alert the readers nearly every month about it. Often with complaints that it isn’t being reported in the press.
Bellman, you left out that annoys you and people like you.
Doesn’t annoy me that much, just gives me the opportunity to see how gullible people can be.
Since you spend all your time spewing nonsense I believe you.
The meaning of these long Pauses is that the long-run warming rate is a good deal less than had originally been predicted, and a good deal less than is currently predicted.
And as I’ve said before, if that’s the message you wanted to get across you could make the long-run warming trend the headline. “UAH warming at 1.3°C / century, a lot slower than predicted in 1990.”
The problem is that looking at the longest possible flat trend, as a proxy of the rate of warming, is at best very vague. If UAH had been warming at 0.2°C / decade the pause would be starting March 2015. If the rate of warming was 0.3°C / decade, the pause starts August 2015. Would you still be running headlines that there had been no warming for over 7 years, and claiming this meant the warming rate was a lot less than predicted?
The issue is, whether you intend it or not, that people run away with the impression that the real meaning of the pause is that there has been no warming for 100 months, that therefore global warming has stopped, that this proves there can be no correlation between rising CO2 and warming, etc.
Take another spin on the bellcurveman hamster wheel, more fun than a barrel of monkeys.
I’d guess you would know.
Yet he updates WUWT monthly about the duration of <= 0 C/decade trend without every mentioning that the duration of the > 0 C/decade keeps increasing as well which is now at 529 months vs the 100 months of the current pause.
What you say would be true even if Earth were cooling strongly. That is, until such time (>>529 months) as the anomaly reaches what it was before 1978. Your remark is really a non sequitur.
CS said: “What you say would be true even if Earth were cooling strongly. “
That’s one of Bellman and my points. Just like the > 0 C/decade trend could extend during a shorter period of cooling so too could the <= 0 C/decade trend extend within a longer period of warming. But what people get out of Monckton’s posts is that the long warming stopped and the top is.
Word salad hand-waving.
I see that you consider yourself a mind reader.
Pseudoscience at its finest.
No need to read minds. We see posts proclaiming or at least insinuating or implied that the top is in on a fairly regular basis.
What people get out of Monckton’s posts is that the current Pause, like its predecessor, is getting longer and longer, and that, as a result, the long-run trend in global warming is a good deal less than had originally been predicted.
bdgwx,
I do a monthly update of the Monckton method for Australia each month now. The negative linear trend is 10 years 7 months to end 2022.
I display it because it is close to zero trend.
Zero trend is one expectation that precedes a coming decrease after a time of increase. A turning point possibly commencing, if you will.
That is useful for those who fear signs of increase. Geoff S
And what happens when you round all of the UAH TLT values to the nearest integer prior to analyzing and computing linear trends like what I was told I should have done?
Something like this…
As are all your comments.
I agree that any claims regarding CO2 and climate are meaningless.
No, it will take 3000 years to rise the temperature from 7 to 100C
Crab boil in about 3000 years.
Mmmmm—crab cakes!
Maybe not more meaninful than -0.27C/2 months
It’s just a continuation of a trend that has been continuing for over 150 years. Long before CO2 could have played a role.
Which trend? The 0.13 C/decade trend from 1979, the 0.31 C/decade trend since 2011, the 0 C/decade trend from 2014, or the -16.2 C/decade since 2022/10 that esalil mentioned above?
I told you the trend. Why do you disregard the 90% of the data that doesn’t support your fantasy du jour?
Maybe you did. There are a lot of posts in this sub thread so it is possible I missed it. The only trends qualified that I saw were the 4 I mentioned above. That’s why I’m asking.
In response to MarkW, the recovery following the Little Ice Age began in 1694. The Central England Temperature Record, the world’s oldest regional record, shows a trend equivalent to 4.33/century during the 40 years 1694-1733. There has been no such large warming trend in any 40-year period since.
The CET record is not regarded as reliable before 1772.
Keep up the propaganda. You are talking about going from 15°C to 15.3°C in a decade.
Why do you think that is anything but natural warming fcrom the Little Ice Age.
Are you also telling us that you have a such a sensitive system that you can tell the difference between 15 and 15.3°C?
The propaganda is trumpeting that an anomaly growth from 0 to +0.3 is a 300% growth. When in reality 0.3/15=> 2% per DECADE.
And in absolute T, it is 0.3/287 it is 0.1% per DECADE!
To be pedantic it would be going from about -10.0 C to -9.7 C. Remember, UAH TLT temperatures are ~263 K.
“cherry picked”
Heheheheheheheh—the same old bellcurveman stuck on his hamster wheel.
The AGW scammers are the ones desperately ignoring natural factors.
Still trying to pretend that the slight but highly beneficial warming since the LIA is human cause.. Its hilarious.
Funny how every heat wave is proof of global warming, however 8+ years without any warming is just natural variation.
Antarctic sea ice has been low all year, it hit a record minimum last March and has remained low all year and in all likelihood set a new record low this March.
Global sea ice extent and area are at record lows for this date as well and will likely break the all time (in at least the satellite era) record low in the next month or so. The previous record goes all the way back to 2022.
Decreased sea ice allows the heat from the oceans to escape and warm the atmosphere. From there it quickly escapes to space.
It also allows heat from the Sun to penetrate into the ocean instead of getting reflected back to space. At any rate, heat escaping from the ocean goes into the atmosphere first where it causes the temperature there to be higher than it would be otherwise. The higher atmospheric temperature causes more energy to escape to space. Remember, more terrestrial energy escapes to space when the planet is warmer.
Except the amount of sunlight reflected from ice is about the same as the amount reflected from water at those angles of incidence.
I agree that heat from the oceans going into the atmosphere and then escaping to space is a huge increase in the ability of the earth to shed heat.
One of the strongest negative feedbacks in the climate system.
I think that you are being disingenuous. While the current Arctic sea ice extent is slightly below the 2012 level, it is the time of the year when there is little variance.
https://nsidc.org/arcticseaicenews/charctic-interactive-sea-ice-graph/
The Antarctic sea ice coverage is a little below 2022, but again there isn’t a lot of variance, percentage wise, in Antarctica, especially in East Antarctica.
No. I don’t think I’m being disingenuous here. Less sea ice means more albedo warning potential.
https://cryospherecomputing.com/awp.html
The link you provided doesn’t explicitly state how they arrived at their conclusions and the ‘pretty pictures.’ Since they are using the term “albedo” I’m assuming that they are only using retroreflection for their calculations. Open water has negligible retroreflection. However, that doesn’t mean that all the incident insolation is being adsorbed. Just the opposite! Above 60 deg latitude, the forward reflection (specular reflection) rises rapidly, reaching a maximum of 100% at glancing angles. Their model appears to be overly simplistic and the “warming potential” overestimated.
https://wattsupwiththat.com/2016/09/12/why-albedo-is-the-wrong-measure-of-reflectivity-for-modeling-climate/
The information I have shows that water has a broad spectrum albedo of about 0.3 or less all the way up to 80 degrees of incident angle for naturally polarized sunlight on a smooth surface. Note that in June the average noon incident angle at 90N is less than 80 degrees and that sea ice extends all the way down to 50N where the noon incident angle is less than 30 degrees resulting in albedos less than 0.1. Nevermind that for higher incident angles (like in the high latitudes) surface roughness decreases these albedo estimates. The ocean is not a smooth surface. Sea ice, on the other hand, has a large albedo range depending on several variables including whether it is clean/dirty, melt ponded, slushy, snow covered, etc., but a rough estimate for the average albedo of sea ice in the Arctic region is about 0.7 with generally higher albedos as you get closer to the Central Arctic Basin and lower as you get closer to Siberia or the Hudson Bay. The point is that regardless of whether the surface is open water or ice covered it all gets the same incident angle and the albedo is lower for open water than ice covered for the incident angles these surfaces are commonly exposed to and that albedo decreases as sea ice decreases. This has been known since at least the 1960s.
It is inappropriate to take a snapshot for other than at the Equinox. The highest reflectivity moves away from the sun between the Equinox and Solstice. During the June Solstice, the sun doesn’t set above the Arctic Circle. That means, there is always a region (the Terminator) where the sun’s rays are glancing. If it is open water, the reflectivity approaches 100%. The higher the angle of incidence, the smoother the surface appears and the more the reflectance spectrum approaches that of the incident rays, which means more IR is reflected.
To do it properly, the reflectivity (not “albedo”) of the water has to be integrated across the Arctic and then conflated with the albedo of the snow, which has a bi-directional reflectance distribution function with a strong forward lobe. Snow changes albedo with time, fresh snow being generally brighter; less so with angle of incidence. Water primarily changes reflectance with high angles of incidence, with a minor, constant component of albedo from suspended particles.
This is all undergraduate calculus, but nobody seems to have taken the time to do it. Instead, what we get is hand-waving about average ‘albedo’ at a point in time.
1960? Physicists have known about Fresnel’s formula since 1866, but climatologists apparently haven’t heard of it.
Incidentally, an ‘albedo’ of 0.3 (actually 35% reflectance at 80 deg) is at least 4X greater than what is usually assumed for water. That is, one not only has to be concerned about the difference between water and snow, but also the difference between the assumed ‘albedo’ of water used for absorption calculations, and the actual specular reflectance of the water. Any way you cut it, the forecasts predict more absorption of energy than actually happens.
Do you have a formula for the albedo given the angle of sunlight that you want me to test? I’ll do the full integration and combine that with the land albedo and we’ll see if it comes out to about 0.3.
theoretically albedo is about 1 – sin 45 degrees for the blue planet observed from space. lots of weird geometry going on. net radiation at the surface = 2 x OLR = total convection. weird stuff. it has all been presented to the CERES team. they know.
fixed constraints:
https://ceres.larc.nasa.gov/documents/STM/2022-10/Zagoni.pdf?fbclid=IwAR0TneuYir7x_foaYuXZdI-vjscp9r6qAXtmm-SWrHMA-OCjjBpTR5ApiJE
https://d197for5662m48.cloudfront.net/documents/publicationstatus/95732/preprint_pdf/081238254a3c3c71cc4fc5ca7f8fee59.pdf
From the voice:
Einstein to Trenberth and Beyond: Earth’s Global Mean Energy Budget as the Solution of Four Radiative Transfer Constraint Equations
https://ams.confex.com/ams/102ANNUAL/meetingapp.cgi/Paper/387827
relegated to 5:00-630pm at AMSU January 2022 when nobody was listening.
I’m not sure what 1 – sin(45) has to do with albedo. The links you provide are just discussions of the energy budget which all generally agree that 240 W/m2 out of the possible 340 W/m2 gets absorbed. That results in a global average albedo of 1 – (240 / 340) = 0.3. Thus my request for Clyde’s formula for the ocean albedo. If I have the formula I can do the integration spatially and temporally and check to see how closely it matches 0.3. It would be a rough “sniff” test to see if Clyde’s hypothesis is viable.
BTW…the geometry you speak of is spherical. It’s been a couple of years ago, but below is 3 different ways you can compute spherical energy inputs including 2 different (but equivalent) integrations and the canonical s/4 shortcut method of the solar insolation around a sphere with radius r expose to a solar constant s that I entered into desmos.com related to the conversations regarding Joe Postma’s rants. You can see that Earth receives about 5.5e24 joules of energy in one orbital cycle. That is the 340 W/m2 TOA figure you often see in energy budget diagrams. Anyway, if I have Clyde’s formula I can plug that term into one of the full integrations and make sure the output yields 240 W/m2 as a simple test of viability.
the links are discussing some ideas about fundamental constraints on the radiative-convective dynamics and relationships. some neat coincidences. it’s interesting stuff. your ad hoc observations such that they are matter of fact is of the opposite perspective.
Water’s albedo vs incident angle curve is not mine and it’s not ad-hoc. The hypothesis that sea ice has a higher albedo than water dates back to the 1800’s. In fact, the first quantification of the magnitude of the ice-albedo feedback was in the late 1800’s. So it’s not like this is a huge epiphany that scientists just learned.
we’re operating on different wavelengths. don’t worry about it.
Wow, look, bgwxyz found more equations to plug into.
Impressive.
correction: OLR / 2
Perhaps you should check this out:
Polarization-dependent-reflectivity-of-a-flat-water-surface-with-index-of-refraction.png
Yeah. That’s consistent with the information I’ve been using. Note that sunlight is between the s and p polarizations in that graph and would be about 30% at an 80 degree angle. And as I mentioned above the North Pole which has the highest incident angle at around 70 degrees (with a min of 66.5) in June. So realistically a smooth ocean in June would have an albedo around 0.15. The ocean isn’t smooth and with the incident angle so sharp the roughness actually acts to reduce the albedo further. We are far away from solid sea ice having the same albedo as the open ocean even right at the North Pole during the month when the Arctic receives the most solar energy.
I think people don’t realize just how much energy the Arctic receives from the Sun in the month of June. As I said above 70N receives more energy in June than does my hometown of St. Louis at 40N.
The sea ice has been low which reduces reflected solar energy leading to higher energy accumulation. This is really only important for the periods of SH high ice levels from mid Fall through Spring when the ice extends far to the north. In the SH summer most of the ice melts anyway.
The sea ice did return close to normal while there was still some effects in the Spring of 2022. Won’t have much of an effect again until late mid Fall.
Last March was a record low for Antarctic seaice area, just over 1million km^2, all the indications are that it will be below that this March, the only significant region being in the Weddell sea. Current area is lowest for the date by about 0.5million km^2, given about 24hrs of sunlight in the regions where the ice has gone that would lead to further warming of the sea.
index.php
Unfortunately until the trend drops significantly they will never give up the ghost. This really is a simple demonstration of why the CO2 AGW theory is a fail.
You are exactly right. The only evidence is the recent temperature trend. And even that is suspiciously small.
No anthropogenic greenhouse forcing theory exists, it is an unproven hypothesis. The validation is straightforward in principle, to compare the global mean greenhouse effect to the predicted one. i.e. the ratio of surface flux and OLR. They already know this has failed.
Many aspects of the hypothesis have failed validation. Typically this would lead to a rethink. But, sciences which exist at the interface with politics do not necessarily adhere to generally accepted common sense principles.
The idea now is to connect increasing solar absorbed radiation ASR to gas forcing as a quasi feedback response.
The objective view would be to explore the increase of solar absorbed in an unbiased manner, but to date there is a requirement to connect delta ASR to gas forcing. This is due to the political nature of the funding agencies, and the indoctrination of several generations of researchers. It is somehow inconceivable to climate science that there has been an error. Group-think has been a mistake in methodology.
It is entirely possible the mechanisms have been completely misdiagnosed. Due to the confounding collinearities of various human influences, far beyond gas emission & industrial aerosols, in addition to natural factors, untangling it all is a tall task. To date the system is underdetermined, with very little knowledge of the magnitude of various suspected factors (+ the ones not yet considered).
So Bellman does not recognize Bell curves, interesting.
Tell that to karlo.
Keep going! Please!
Hehehehehehehehehe
OK, if you insist.
A meaningless comment.. massive defensive action as you try desperately to keep your AGW agenda alive.
7th warmest means it’s cooling
Thanks for that confirmation
We’re still warming out of the Little Ice Age.
The warming started nearly 100 years before the large rises in CO2 began.
The warming has not accelerated since the large rises in CO2 began.
We still have about half a degree of warming to go before the world gets back to the levels enjoyed during the Medieval Warm Period and even more to get back to the levels mentioned during the warm periods mentioned in the article.
Total BS
Warming accelerated after 1975
The point of the article was no warming in he past 8+ years.
That could be a change of the long term trend, but probably is not.
There have always been natural warming and cooling cycles long before manmade CO2 emissions.
Local climate proxies are not accurate enough to prove any period had a global average temperature warmer than in the past decade, for the past 5000 years. For 5000 to 9000 years ago, the global average climate was probably slightly warmer than the past decade, during the Holocene Climate Optimum. That’s only an estimate, not a measurement.
“We’re still warming out of the Little Ice Age.”
While that may or may not be true, it is not a cause for todays warming. So then the next question is…. why are we warming now? The drivers present coming out of the LIA are not in play now. So sorry “Make it up Mark” you will have to do better than that.
“The warming has not accelerated since the large rises in CO2 began.” Not true…
chrome-extension://oemmndcbldboiebfnladdacbdfmadadm/http://static.berkeleyearth.org/pdf/annual-with-forcing.pdf
“We still have about half a degree of warming to go before the world gets back to the levels enjoyed during the Medieval Warm Period ”
You must have a long nose….
https://en.wikipedia.org/wiki/Temperature_record_of_the_last_2,000_years#/media/File:2000+_year_global_temperature_including_Medieval_Warm_Period_and_Little_Ice_Age_-_Ed_Hawkins.svg
I do love it when you make stuff up. So much fun shooting your nonsense down.
serial dolt
Monckton of Brenchley, thank you for this update. No quibble with your approach to take what is widely claimed (high ECS based on exaggerated feedback) and address it on its own terms. It fails the test of reason and good sense, as you so consistently point out.
I would also like to point out that from a different perspective, an attribution of even the recent modest warming to human GHG emissions is a “vanishingly” (I like that word!) thin proposition. In the UAH TLT record for the globe, the trend is 0.13C per decade, or 0.013C per year. In the GFS/CFSR reanalysis values presented here* for the 2-meter surface air temperature, the global value rises and falls ~3.8C each year. We accept this annual cycle as of entirely natural origin. The recent warming trend value vanishes in what is happening naturally, so isolating it for attribution to GHGs, as though to have contributed 0.013C to the warming phase or to have inhibited 0.013C of the cooling phase, just seems too much of a stretch.
*link https://climatereanalyzer.org/clim/t2_daily/
Something to think about. It seems to me that cause and effect cannot be isolated reliably to GHGs by any means we presently have available to us.
“ the 2-meter surface air temperature, the global value rises and falls ~3.8C each year. “
Regular seasonal variations within every year are irrelevant for year to year global average temperature comparions
Mr Greene has, as always, missed the point. The fact that the long-run trend is so very much less than the seasonal variability shows how insigificant the long-run trend is. This point has often been made by Professor Lindzen in his talks.
“Regular seasonal variations within every year are irrelevant for year to year global average temperature comparions”
You keep missing the relevant observation, that the surface of the planet, on average, does indeed gain and lose enough energy on an annual cycle to produce the reanalysis-estimated value of ~3.8C warming and cooling. It’s not the “seasonal variations” I am pointing out. It is the annual cycle of overall energy gain and loss as expressed in the global average, in which the tiny trend vanishes. The validity of an assumed or computed attribution of the trend to GHGs is the issue.
I sometimes raised criticism on your articles in the past, let me be the first to applaud you for this one!
Seriously, while the scientific merit calculating the precise length of the actual pause might be questionable, the fact that it is there and lengthens certainly is interesting.
The trend analysisis important to evaluate past models and the detailed explanation of choices for the values of the parameters in that ECS equation is convincing.
The color coding is a really nice touch!
You cannot argue mathematics, but I invite any alarmist to try 🙂
Salute!
As with previous whines by this old fart, I trust graphs using absolute values a lot more versus anomalies using some arbitrary time interval. It is easy to show trends for any period as overlays on the “big picture” graph or chart.
Gums whines…
You’re such a prat.
The time interval is not arbitrary, it is the total time of satellite measurements.
In response to Gums, he confusingly – and perhaps confusedly – conflates two questions: first, whether temperature scales should be displayed using absolute values, in which event the long-run global-warming trend would be virtually undetectable, and whether it is permissible to show part of a time-series rather than the whole time-series, in which event the head posting overcomes the apparent difficulty by showing both.
Salute!
Thanks Sir Monckton, I agree completely about the small temperature variation being hard to detect using Kelvin, not that ,it sn’t there, just not the end of the the world as we know it. I just have trouble finding the interval and baseline value being used for the anomalies many folks present, especially the warmists.
Secondly I didn’t read the fine print on the main author’s chart defining the the baseline value used for the anomaly value just the trend line.I had focused upon the first one showing only a few years and not the total satellite data.chart that still not define whatever baseline is being used. It could be a trend chart. And just an eyeball suggests the baseline is not a simple average or mean temperature for 45 years. My main complaint with the anomaly charts is an anomaly from what. Seems that UAH uses a 30 year period from 19xx to 20xx.
How come the whole climate comunity can’t pick the “ideal temperature” and then show the anomalies from that number. Otherwise, present the data as UAH did from 1978 or so and then a defined interval of that data.
For the “standard” I personally liked most of the 50’s when growing up, and then the 70’s, or 90’s. Otherwise use the values that are computed by many aerodynamic equations for the planes and spacecraft flying about. Ditto for chemical reactions….and do we use anomalies to design our HVAC’s?
For 20 years as a pilot and then 15 years as an engineer in the same business I never had to adjust my calculations for air density and temperature at certain altitudes accoring to some anomaly…used same tables and slide rules and computer equations the whole time. Go to the tables for “standard atmosphere” values. See if they adjusted the values since over 100 years ago. Think Langley or Goddard or Wrights or the major aerospace companies did?
Gums sends…
To me the significance of the pause is that it exists at all
This claimed forcing is actually zero and will always be zero. The logic is pretty simple. If there’s no reduction in outgoing LWIR then how do you have an increase in downwelling LWIR? In fact, this would violate conservation of energy. You would be creating energy out of nothing.
What this really represents is just changes in local energy movement. It is not a flux and therefore cannot cause any warming.
Unfortunately, there are still skeptics that buy into the claim that doubling CO2 will reduce outgoing LWIR. This would violate Kirchhoff’s Law of Radiation. It simply is not true.
It is true that doubling CO2 would increase the absorptivity across the atmosphere. However, this would also increase emissivity as Kirchhoff’s Law demands. The two changes taken together cancel out and the net outgoing LWIR stays the same.
Actively funded public academics in the climate sphere have failed to recognize they are agents for the promotion of commercial products and ideology. Science is secondary. They demonstrate this like a relentless chorus without shame, so my guess is they are completely blind to their subjugation. They are as fallible as anyone else, perhaps even more-so than the average joe. Institutions reward those who adhere to a bureaucratic hierarchy, and public academics take great comfort in this structure. They are agents of the political class, not independent nor disinterested.
Richard M is not right that there is no such thing as a radiative forcing, such as that from CO2. The reason is that, though the incoming and outgoing radiation at the characteristic-emission level high in the atmosphere will balance by definition, the altitude of that level increases with temperature. Since the gradient of temperature with altitude is very close to invariant in the industrial era, the result is warmer temperature at the surface.
You need a cause for the temperature to get warmer. More solar energy is one example. Oceans releasing energy during El Nino is another. Just changing the amount of CO2 in the atmosphere produces no additional warming after the saturation point is reached.
When you do produce more energy at the surface the total LWIR radiated to space will increase as well. It will increase throughout the atmosphere. The average emission height will remain unchanged as it is based on the mass of the atmosphere and the gravitational force.
Richard M persists in his error. Increasing the burden of CO2 in the air causes less radiation to pass out to space, causing a radiative forcing. As previously explained, the radiative forcing causes the characteristic-emission altitude to rise. Since the temperature lapse-rate with altitude remains broadly constant, the result is warming at the surface. Sorry, but this is meteorology 101, and it long predates the climate scam.
You’re missing a big part of the process. While increasing CO2 does cause each individual photon to take longer to pass out to space, you also get an increase in the total number of photons by the same log factor. The two changes applied together cancel each other out. The emission height remains constant.
The reason you think CO2 causes “less radiation to pass out to space. is you must be limiting the energy involved to only surface energy. You don’t see the increase that’s really happening when you include all the energy in the atmosphere.
I am correct about the radiative forcing being zero and the emission height being fixed for any amount of incoming solar energy. Since the solar energy varies little that means the emissions height is essentially constant as well. Here’s the detail behind it.
How did climate science get this wrong? To get the right answer a person needs to understand the difference between surface energy and atmospheric energy. You get the wrong answer about emission height when you use surface energy to calculate energy flow. You get the right answer when you use atmospheric energy.
Please take the time to understand the difference. Once understood you will start to realize my point about there being no radiative forcing.
The contribution to atmospheric energy flow by CO2 is driven by spontaneous emissions of a CO2 molecule when energized via kinetic energy collisions with other atmospheric molecules. After gaining energy from the collision, the CO2 molecule emits that energy in a random direction. The energy is then reabsorbed by another molecule which completes this cycle by transferring the energy back into the atmosphere via another kinetic energy collision.
Note that there’s no surface energy involved here. Surface energy is absorbed similarly to the reabsorbed atmospheric energy and very low in the atmosphere. From that time on the surface energy is indistinguishable from any other atmospheric energy that could have arrived from many different causes and cross a larger time period. All of the atmospheric energy needs to be used to compute changes in emission height.
It should be obvious that the total atmospheric energy is always much greater than the daily input of surface energy. This is the bucket which generates the upward flow of energy to space. When CO2 is doubled the number of spontaneous emission – reabsorption events increases logarithmically. The average distance travelled is reduced since there are more CO2 molecules present. This reduction is also a log function.
The net change in overall upward flow of energy sees the average distance decrease and the total energy flow increase, both changes are log functions. Hence, the net energy flow remains unchanged and the emission height stays the same.
Note that if you just look at surface energy in this computation it will not increase while the average distance is decreased. This will compute to a reduction in energy flow and force the emission height to increase. I believe this is the most likely source of the erroneous claims of changes in the emission height.
It is simply no good trying to pretend there is no radiative forcing. Consider the position in 1850. If there were no radiative forcing from greenhouse gases, then the temperature would be equal to the emission temperature of 259.6 K, when in fact the temperature is 287.5 K. The 27.9 K difference is the natural greenhouse effect. The clue is in the name. 20 K of the 27.9 K is feedback response, and 7.9 K is directly-forced warming by preindustrial noncondensing greenhouse gases.
It is pointless to try to pretend that the 27.9 K difference between the 259.6 K emission temperature and the 287.5 K observed global mean equilibrium surface temperature in 1850 did not exist.
No one is pretending. It’s irrelevant. You may be 100% correct but it has nothing to do with why more CO2 doesn’t cause warming. The surface radiation is already absorbed very low in the atmosphere.
http://www.john-daly.com/artifact.htm
When you use the full atmospheric energy to compute the emission height you will find out it doesn’t move with increases in CO2. It is only when you limit yourself to looking at surface energy that you see an increase in the emission height.
The Ramathan style greenhouse effect is real, i.e. surface flux – OLR = greenhouse effect.
The effective radiating height contributing to OLR is the combination of ground, cloud, and other full spectrum emitters. It doesn’t exist in the way depicted in 1D radiative models.
The proportion and spatial distribution (vertically and horizontally) of these emitters sending LW IR to space appears to vary. This influences solar absorbed and window flux.
by definition, net radiation at the surface = latent + sensible heat. This non-radiative flux of heat transfer away from the surface is delivered into the atmosphere; I call it total convection.
That is, Net SW + Net LW = H + LE (total convection). This works out to a fixed 1/2 OLR in clear sky where we’re concerned with a perturbation. Such that, a perturbation does not appear to exist over the full CERES period. But annually minor deviations can occur.
The existence of the atmosphere provides a medium in which to receive this sensible H and latent heat LE. Without an atmosphere to receive this non radiative flux, the surface energy would all simply be radiated instantaneously to space at the speed of light.
A greater proportion of LE delivers heat higher in the atmosphere as a whole. Comparatively, a greater proportion of H delivers heat lower in the atmosphere. The ratio of H and LE is the bowen ratio, and this varies.
This is the bulk of the effect that is called the greenhouse effect. The existence of the atmosphere to receive non radiative flux. This heat is dissipated at a rate far below the speed of light. At 1/2 OLR the magnitude is about 120-125 W m-2, or so.
Uncertainty in the surface budgets, including window losses and H + LE is about 20 watts per square metre. This is about 1 order of magnitude larger than the LW radiative forcing perturbation hypothesis. This 20 W m-2 is not resolved.
Changing proportions of H + LE, and the spatial distribution (horizontally and vertically where LE is condensed), influences the fluid dynamics, pressure gradients, cloud formation, atmospheric windows, solar absorbed and what have you.
In the end, surface available energy works about to about 1.5 units of solar absorbed, minus surface windows. remarkable. This is a testament to the freedom of fluid dynamics to maintain atmospheric equilibrium to solar available. The EEI relates to a greater or lesser proportion absorbed into ocean.
In the ocean it is uncontroversial that heat is circulated in fluid dynamics. However, in the fluid atmosphere we switch to a pure radiation mode which is obviously nonsense.
Our current conceptualizations are a consequence of our instrumentation and subsequent 1D models of radiation transfer. If we could stick out a wand and measure total convection the story might be different.
Yes, the greenhouse effect is real to a point. I am limiting myself to the well mixed GHGs because they have relatively small absorption bands where saturation of surface emitted energy has already occurred. This is also the area where human influence is critical.
You are going way beyond that point.
fair enough. but the trick to keeping up appearance for a colossal misrepresentation is to have people arguing about the nuances and scuttling around the edges. might as well cut to the chase i figure. this is opposite to Monckton’s methods. what ever is happening with narrow radiative absorption bands is just being burped out elsewhere in the spectrum.
100 months has a familiar ring. Is it that we have saved the world (again) from “climate change disaster” (https://www.dailymail.co.uk/news/article-1160319/Prince-Charles-We-100-months-stop-climate-change-disaster.html), or should we simply state that there has been no apparent global warming for the last Carodisastrian interval.
Lord M., thanks for the update. The total satellite trend sure looks like stepwise upturns from the 1998 and 2016 El Niño events. Makes one wonder if the El Niño causes the upturn or only distributes heat energy accumulated some where? Anyway, the La Niña and El Niño cycles sure appear to be players in the overall climate state.
It could just be coincidence. The AMO went into its warm phase from 1995-97 and the PDO moved from its cool phase to its warm phase in 2014. These both occurred shortly before the El Nino events.
I like to keep in mind the following NOAA statement:
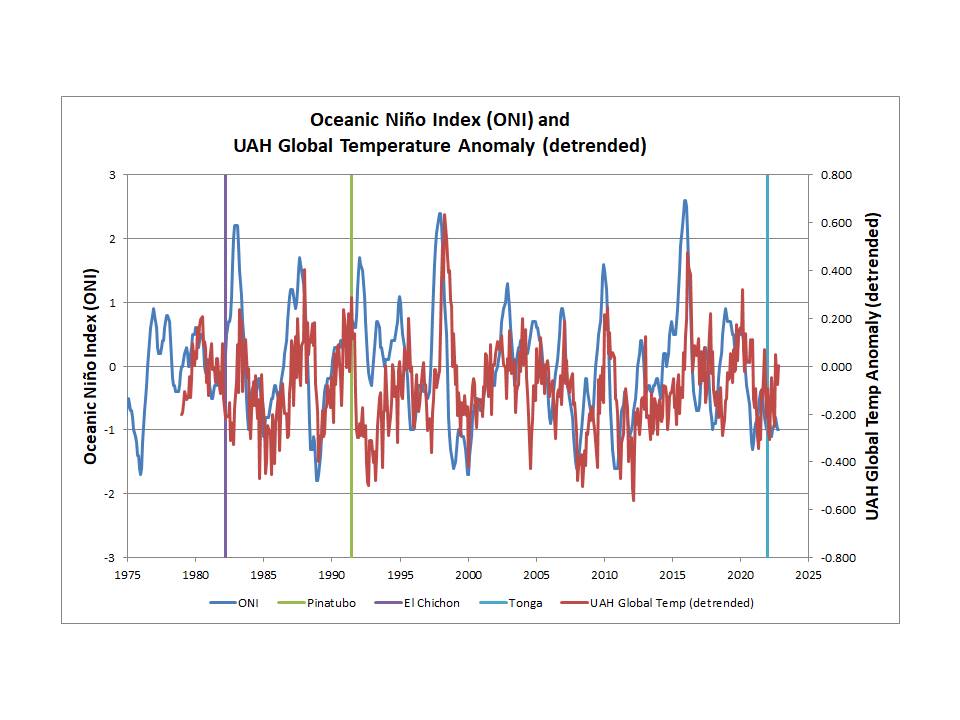
“The El Niño / La Niña climate pattern that alternately warms and cools the eastern tropical Pacific is the 800-pound gorilla of Earth’s climate system. On a global scale, no other single phenomenon has a greater influence on whether a year will be warmer, cooler, wetter, or drier than average.”
https://www.climate.gov/news-features/featured-images/slow-slosh-warm-water-across-pacific-hints-el-ni%C3%B1o-brewing
(h/t Bob Tisdale for the link)
Below is a plot which shows the link between ENSO events, as characterised by the Oceanic Niño Index (ONI), and UAH Global Temperatures. ONI anomalies are based solely on sea surface temperatures in the Niño 3.4 region (three month rolling average):
https://origin.cpc.ncep.noaa.gov/products/analysis_monitoring/ensostuff/ONI_v5.php
I have de-trended the UAH data in order to match ONI which is, by definition, de-trended. ONI peaks correspond to El Niño events and the troughs correspond to La Niña events. Global temperatures generally track these very closely, both up and down, with a delay of about 4 months. Three exceptions are evident on the plot: two relate to major volcanic eruptions (El Chichón, 1982, and Pinatubo, 1991), where global cooling was significant enough to mask the effect of the El Niño events near the time of the eruptions, and the third one is just a ‘blip’ around mid-2004, for which I have not seen any explanation. The Hunga Tonga–Hunga Haʻapai eruption (Dec 2021-Jan 2022) does not appear to have had any noticeable effect on global temperatures, possibly because the eruption was sub-sea surface, which may have limited the amount of sunlight-blocking volcanic dust and aerosols reaching the stratosphere (just speculation on my part):
A key aspect of the link between ENSO, global temperatures and CO2 is that the effect is to change the RATE of growth of CO2. Strong El Niño events show up (with a delay of a few months) as ‘sudden’ increases in atmospheric CO2 growth rate (above the general trend) and strong La Niña events show as decreases in growth rate below the general trend. In addition, the major Pinatubo eruption leads to lower atmospheric CO2 growth rates.
Here is the effect of the 1997-1998 El Niño on atmospheric CO2 growth rate:
https://www.woodfortrees.org/plot/esrl-co2/from:1995/to:2001
And here is the 2015-2016 El Niño:
Note that the 13C/12C ratio of the incremental atmospheric CO2 is significantly different between major El Niño (lower ratio than average) and La Niña (higher ratio than average) events, and yet is constant at a value that is between the ENSO low and high extremes when averaged over longer periods. I have not seen anyone else discuss or publish about what I feel is a very important observation. This average δ13C content (at -13 per mil) has not changed since the start of the industrial revolution if you accept the Law Dome ice core data.
Using only ONI I get an RMSE of 0.15 C on the detrended UAH TLT anomalies. You can improve the skill slightly by incorporating the AMO and volcanic aerosol optical depths from Sekiya 2016 and Pitari et al. 2016.
Hi Jim,
ENSO is a heat pump that distributes solar energy accumulated at the sea subsurface towards the atmosphere during El Niño events and keeps it at the sea during La Niña events. It does not alter the energy content of the climate system significantly, but after an El Niño the atmospheric heat tends to get out of the planet as outgoing longwave radiation more efficiently, cooling the planet.
What matters in your graph is the trend that you subtract, which is the warming trend of the planet.
The effect of ENSO on CO2 is known to be a biological response to ENSO since the 1970s from some of Bacastow’s papers, a collaborator of Charles Keeling. The flux of CO2 between the atmosphere and the biosphere is huge, and also explains the 13C/12C ratio changes, as biological organisms prefer 12C over 13C, so they tend to draw and release proportionally more 12C than 13C.
Javier,
Thank you for your comments. I agree that Charles Keeling, Bacastow and others did great work in the 70s despite the data limitations. In his 1976 paper Bacastow postulated that “The connection [to the Southern Oscillation], if present, indicates that a principal cause of the variation may be a change in the rate of removal of CO2 by the oceans”. However, at that time routine measurements of 13C/12C in CO2 (usually expressed as δ13C) were not available; they did not start until 1977 at the South Pole (with many data gaps early on) or 1980 at Mauna Loa.
Now we have a lot more data so we should be able to achieve a much better understanding of the processes involved, especially as 13C is, like 12C, a stable isotope and therefore must also satisfy mass balance principles. Rather than getting into the technical detail of “Keeling plots” for now (not to be confused with the Keeling curve), I’ll provide quotes from two relatively recent papers:
The first paper (van der Velde et al (2013)) looked at the inter-annual variations of atmospheric δ13C and concluded: “Our new terrestrial bottom-up results cannot confirm the suggestion of a closed δ13C budget that allows low prescribed ocean net exchange variability. Because our model calculates low interannual variability in terrestrial disequilibrium flux, it suggests that other terms in the mass balance must accommodate the unaccounted variability.”
I think that differences between the δ13C of the incremental atmospheric CO2 during El Niño events versus the δ13C during La Niña events could be a key factor here but, as far as I know, there are no recent models that are able to match the observed inter-annual variations.
Second, Keeling et al (2017) commented on the above-referenced paper by stating that: “A further difficulty is that the global δ13C budget does not balance convincingly.” They then go on to conclude that: “Using updated records, we show that no plausible combination of sources and sinks of CO2 from fossil fuel, land, and oceans can explain the observed 13C-Suess effect unless an increase has occurred in the 13C/12C isotopic discrimination of land photosynthesis.”
The problem in this case was that they could not match the rate of decline of atmospheric δ13C with their initial model. Simply assuming that the net δ13C of incremental atmospheric CO2 remains at -13 per mil actually fits their updated observations just fine (much better than their initial model). Instead they introduce yet another variable to ‘fix’ the lack of a match of their model to observations. Why the net δ13C of incremental atmospheric CO2 remains constant at circa -13 per mil over the longer term is the real question.
More settled science!
Thank you for the information, Jim.
It is certainly non-settled science. The problem is even more fundamental. Carbon fluxes between stores are huge compared to net fluxes. As a result of that and our inability to properly measure them the error in the calculation is as large as the net flux for all the carbon fluxes between stores except for human emissions for which we have better measurements.
With such large error bars, there is no hope to close any carbon budget.
The increased discrimination of land plants proposed by Keeling et al. is possible, but I am skeptical. I would rather look toward the decrease in the CO2 airborne fraction that indicates plants and algae are having a feast.
Javier,
Thanks again for your response. Your comment about error bars is particularly relevant and I will respond further tomorrow. In the meantime, if you have the time, I recommend looking at table S5 in the appendix to the Keeling et al paper.
The mass balance of total CO2 is frequently mentioned here on WUWT, but rarely has there been any significant discussion about the mass balance of 13CO2. Also, I don’t recall seeing any examples of Keeling plots other than ones that I have previously posted. Anyway, I think it may be of interest to look at the isotopic mass balance published by Keeling et al (2017) in their Table S5. This is in the supplemental information to the paper referenced above and can be linked from the paper itself or you can access it directly here:
https://www.pnas.org/action/downloadSupplement?doi=10.1073%2Fpnas.1619240114&file=pnas.1619240114.sapp.pdf.
Usually, the views expressed here at WUWT regarding the declining atmospheric δ13C don’t go much beyond proclaiming that the additional CO2 must have a net δ13C that is, on average, lower than the current atmosphere at about -8.6 per mil (obviously true) and that fossil fuel burning satisfies that requirement. The problem is that the observed decline reflects an average net δ13C of -13 per mil for the incremental CO2 and fossil fuel burning is estimated to have a δ13C of around -28 per mil. This is a huge mis-match and is well illustrated by reference to Table S5. The following isotopic mass balance estimates from Table S5 are all in Pg per mil/year, but focus should be on the relative contributions.
First, the impact of burning fossil fuels is given as -138.4, while the atmospheric change is only -18.0 (less than one-seventh). So, we need to find an awful lot of 13C to achieve mass balance! Some can be found in the assumed uptake of CO2 from fossil fuels by the terrestrial biosphere (19.9) and ocean net sink (4.4). Apparently, the remaining 96.1 (69% of the ‘correction’) is due to disequilibrium fluxes which do not impact total CO2. These reflect a combination of the huge CO2 fluxes between atmosphere and terrestrial biosphere, and between atmosphere and ocean, and very small differences between the ‘in’ and ‘out’ δ13C values of the fluxes. NOAA estimates these differences in δ13C as 0.3 per mil between atmosphere and terrestrial biosphere and 0.5 per mil between atmosphere and ocean. Of course, these very small differences (one significant figure!) are greatly amplified by the size of the fluxes, which apparently do not affect the CO2 mass balance at all.
Finally, to the point you (Javier) made about errors in estimating the size of these large fluxes, I completely agree. It is interesting to compare the errors quoted for the two sets of estimates shown in Table S5. In isotopic mass balance terms, land disequilibrium changed from 25.4 ± 1.5 to 35.4 ± 6.1 and ocean disequilibrium changed from 48.7 ± 1.5 to 60.7 ± 5.7. So, in both cases there is no overlap at 1σ. Oh dear. This is why I don’t give much credence to model-based uncertainty estimates.
Ultimately, however, the key question from a CO2 mass balance perspective is why does the net δ13C of incremental atmospheric CO2 remain constant at circa -13 per mil over the longer term?
How hard is it to continuously measure the atmospheric C12/C13 ratio over time? Seems like it might be a difficult problem.
Interesting question. I cannot comment on how “hard” it is, but the 13C/12C ratio has been routinely measured and reported as δ13C for samples taken at many different locations across the globe since the late 1970s. Put simply, the δ13C of a CO2 sample is the difference between the measured 13C/12C ratio and the 13C/12C ratio of a fixed standard, expressed in per mil terms. Thus, a negative δ13C means that the sample has a lower 13C/12C ratio than the standard. The units of ‘per mil’ mean per thousand, so exactly the same as if expressed as a percentage (per hundred) but multiplied by 10. So, for example, a δ13C of -13 per mil means that the sample has a 13C/12C ratio that is 1.3% lower than the 13C/12C ratio of the standard. This is very neat mathematically, because it can be treated just like the actual ratio, provided any equations are consistent in its application and is widely used in the literature in this way. 13CO2 is about 1.1% of total CO2 so it is not miniscule.
 .
.
I have confidence in using the published data to the extent that both longer term trends and, more importantly, trend changes are evident between observatories. As with total CO2, seasonal variations are largest in the far north (e.g. Point Barrow, Alaska) and almost absent in the Southern Hemisphere. From an analysis perspective, the most important point is that 13C is, like 12C, a stable isotope (unlike 14C of course) and hence must satisfy mass balance considerations. Here is an example of trends, and trend changes, from Point Barrow, Mauna Loa and the South Pole. Values are provided by the Scripps CO2 program, which have had the seasonal cycle removed (by Scripps) and show the longer term variations.
There is some noise in the data, particularly for Point Barrow (largest adjustment for the seasonal cycle), but the continuity of trends and trend changes is pretty good in my view. I hope this helps to answer your question, but feel free to ask further questions.
Thanks, this is interesting. It also is evidence that CO2 qualifies as uniformly mixed gas, even with the seasonal changes.
(There is a symbol for per thousand, it looks like a percent symbol but with an extra zero: 0/00; hard to use if you don’t know how to dig it out of a typeface.)
Yes, atmospheric CO2 is well mixed, but some people seem to think that means the same concentration everywhere at any time, which is obviously not the case. It looks to me that the northern hemisphere seasonal cycle is largely driven by the higher latitude changes (probably driven by the Boreal Forests) whereas the lower latitudes, e.g. at Mauna Loa, are actually a response to the atmospheric change further north (not entirely, however, as the changes seen each year in the Jan-Mar period are, I believe, due to something else).
Thanks for the input on ‘per mil’. I am aware of the symbol for it, but I have generally avoided using it because many commenters here seem to be unfamiliar with it. Obviously you are not among them, so thanks for reminding me.
I have seen anecdotal data derived from direct solar spectral irradiance measurements that the day-to-day CO2 concentration can be highly variable, but doubt its veracity because the signal is quite low and difficult to separate from the much stronger water vapor bands.
Locally measured (not derived) near surface day-to-day CO2 concentration is highly variable – mostly lower during the day and higher during the night. More tomorrow.
On reflection, I realize that I do not sufficiently understand your comment to provide any meaningful input. Sorry.
I was a bit terse, sorry.
Estimating CO2 from solar spectral irradiance is only possible when the sun is out (of course), no clouds, and the direct irradiance is higher than about 800 W/m2. What I saw was the CO2 changing rapidly between spectral measurements (about every ten minutes), on the order of about 400±70 ppm. It was highly noisy so I never spent anytime tracking the numbers.
No problem, I didn’t see it as terse at all. I can seem to be a bit blunt sometimes, unintentionally of course.
Not sure I can provide any useful input, however. For day-to-day monitoring of local (near surface) atmospheric CO2 and its δ13C, as well as many other parameters including solar irradiance and wind strength/direction, hourly data are reported for the Weybourne Atmospheric Observatory on a daily and a weekly basis here. For longer term trends and analysis, the PhD thesis by Philip Wilson, October 2012, is available on-line and provides some good information from Weybourne (https://ueaeprints.uea.ac.uk/id/eprint/42961/), e.g. Figure 3.3.
A very interesting exchange, Jim.
We only know of two processes that discriminate 13C. One is our fossil fuel emissions (including non-fossil biomass) because they are depleted in 13C as they have a plant and algae origin.
The other is the respiration of plants and algae that draw and release more 12C relative to 13C as they grow and die. Biological discrimination of C isotopes is the basis for the changing ratio unless we miss some other discriminating process.
We know the first rather well. We measure the 13C/12C ratio of our fossil fuels and we know how much we burn.
So any problem should come from the second process, which is what Keeling Jr. says. But there are also two possibilities (or a mix of both). Keeling defends a change in biological discrimination. I would think this is the least likely of the two possibilities. The other possibility is a change in the total flux. As there is more 13C than it should be in the atmosphere, i.e., the Suess effect is smaller than it should, it would imply that plants and algae are drawing much more 12C than they did in the past. This is consistent with the greening detected. The study of carbon sinks has a long tradition of scientists misunderstanding it.
Javier,
I won’t be able to comment further today, but I really appreciate your continuing interest and contributions. I will try to respond tomorrow. I know you have a much better understanding than I do about the ‘bigger picture’, but may I ask if you are familiar with Keeling plots (where δ13C is plotted against 1/CO2), which are based on the mass balance of 13C. Such plots are key to my conclusion that δ13C of incremental CO2 since the beginning of the industrial revolution has been essentially constant at -13 per mil, other than short term fluctuations due to significant ENSO events and major volcanic eruptions.
Javier,
I have just seen your excellent new guest post at WUWT so I expect you will be very busy reviewing and responding to comments there for some time. I will add one final comment here for your information (and anyone else still here), not expecting any feedback for now, but which can perhaps serve as a basis for possible future discussions on the interpretation of atmospheric δ13C.
First, here is a fairly good reference on Keeling plots including the relevant mass balance equations: Kőhler et al (2006). The basic concept is that a linear relationship between 1/CO2 and δ13C indicates a constant value for the δ13C of the incremental CO2 and this value is given by the intercept of the plot. Figure 1B shows the data for the Law Dome ice core going back to 1750 and provides an intercept δ13C of -13.1‰ with an R squared of 0.96. (Note that I do not agree with their analysis of the Point Barrow data shown on this plot.)
The following two Keeling plots are based on direct atmospheric observations at Mauna Loa downloaded from the Scripps CO2 program keeping in mind that given a linear relationship, the intercept of the linear fit is indicative of the average net δ13C of incremental atmospheric CO2.
This plot shows both the seasonal cycle and long term trend. We are clearly dealing with (at least) two distinct trends. As such, we should not attempt to fit a linear relationship to the underlying data points. We can, however, highlight the approximate value of the two major trends. The red and green lines drawn over the data are not curve fits, but they are indicative of the true value, which indicates that the annual cycle reflects a δ13C ratio of about -26‰, consistent with it primarily reflecting the terrestrial biosphere, whereas the longer term trend reflects a δ13C of incremental CO2 of about -13‰.
The second plot is without the seasonal cycle (removed by Scripps). This provides a strong linear relationship reflecting the long term growth in atmospheric CO2 with an intercept of -13.4‰ and an R squared of 0.98.
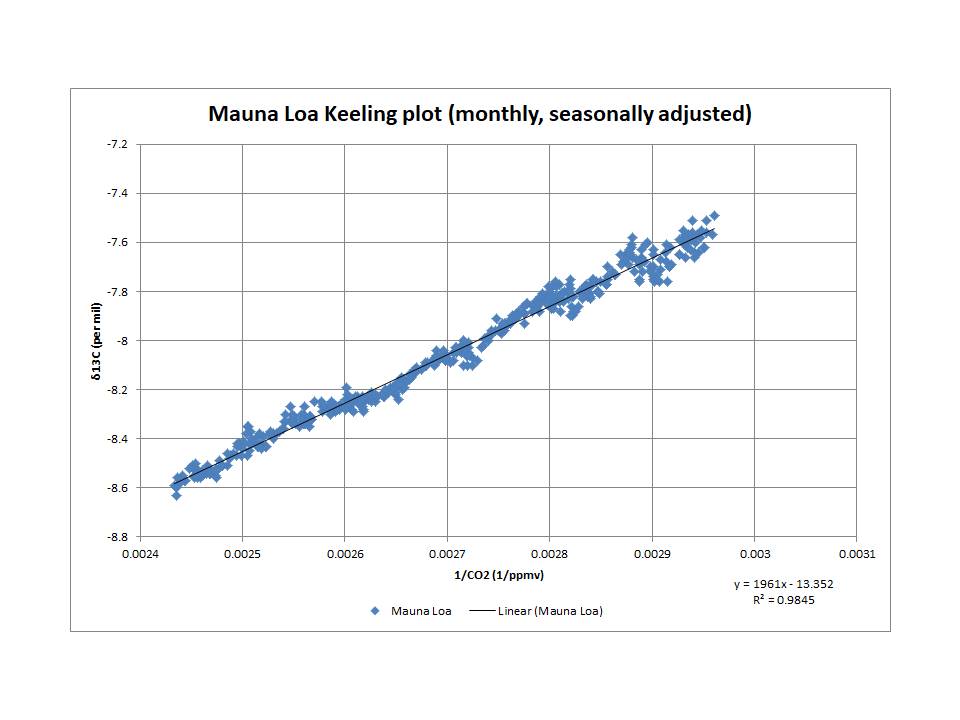
According to my analyses, the equivalent values for two other observatories are:
Point Barrow: -13.2‰ and an R squared of 0.96.
South Pole: -13.0‰ and an R squared of 0.99.
Hi Jim,
Thanks again for the information. It is clear that the recent δ13C changes are simultaneous and opposite to the CO2 changes. I suppose everybody agrees that they are the result of human activities and the response of the carbon cycle to human activities.
I am not too familiar with this subject, but I remember Ferdinand Engelbeen was. He has a simple section on this:
http://www.ferdinand-engelbeen.be/klimaat/co2_origin.html#The_13C12C_ratio
So the problem is the decrease in δ13C cannot be fully explained by our emissions. Then it must be the response by other carbon compartments to our emissions.
There are several possibilities. One is Keeling proposal that the greening of the Earth is accompanied by lower discrimination against 13C. Or the oceans could be taking more 13C. Or the mixture of fossil fuels we burn, as it changes over time toward more gas and less oil and coal, could be poorer in 13C. I don’t think it can be answered without the data. The good thing is that unless we have all this completely wrong the number of possible explanations is low.
Sorry for the delayed response; I have been off-line for a couple of days.
“It is clear that the recent δ13C changes are simultaneous and opposite to the CO2 changes.”
No, that is incorrect. The seasonal cycle follows this pattern because it is dominated by adding/subtracting CO2 with a δ13C of approx. -26‰, which is much less that the current atmosphere. This pattern is widely accepted as reflecting the terrestrial biosphere and is probably dominated by the boreal forests (hence the larger annual variation at higher latitudes in the northern hemisphere, e.g. at Point Barrow). CO2 from fossil fuels is (at most) only a small part (2.5 ppmv) of the seasonal cycle at Mauna Loa.
What is of more interest are the longer term variations in CO2 and δ13C, and here we see that even though atmospheric CO2 is always increasing over recent times, δ13C is generally, but not always decreasing (as is clearly demonstrated by Ferdinand’s plot titled “d13C trends” at the link you mentioned). So we know that δ13C of incremental CO2 is on average less than the atmosphere (which we know is true because it has a net value of -13‰), it also occasionally increases or is at least ‘flat’ (i.e. it is the same as, or higher than, the current atmosphere) at times when CO2 is increasing.
I have a lot of time for Ferdinand and have discussed this issue with him, but eventually he took the position that my conclusion (that the long term average net δ13C of incremental CO2 was a constant) must be coincidental. In my view this was a cop-out, especially when the analysis is based solely on mass balance principles. Leaving aside a physical explanation for my conclusion, my initial desire was merely to get acceptance of it; only then would it be possible to discuss physical cause(s), as well as possible reasons for the experts being unable to explain the inter-annual variations in δ13C.
I don’t want to waste your time over this, but I would like to demonstrate how simple it is to confirm my analysis using the results of Keeling et al (2017) and would specifically refer you to Figure 1A in their paper which highlights how their “standard model run” from 1765 failed to match both the starting value and the rate of change of the observations.
My assertion is that the additional atmospheric CO2 since 1765 (where their model runs were initiated) has had, on average, a consistent net value of -13 per mil. Mathematically, this relationship is very simple to demonstrate by using the mass balance equation for 13C. Keeling et al adopt 278 ppm and -6.4 per mil in 1765 for atmospheric CO2 and δ13C respectively. Referring to their Table S3 (supporting information) they show that observed δ13C in January 1980 was -7.51 per mil and had declined to -8.37 per mil by December 2013 (note: they average the Mauna Loa and South Pole data, not something that I would recommend). On the other hand, their model had predicted values of around -7.75 per mil and -8.75 per mil respectively (based on Figure 1A in the paper). Atmospheric CO2 levels at these two times were, based on the Scripps CO2 program, 337 ppm and 396 ppm respectively.
The calculation is based on CO2 level multiplied by 13C/12C ratio to give (approximately) the 13C amount. The use of δ13C as a proxy for 13C/12C has no impact at all since all values are referenced to a single standard and the use of 13C/12C instead of 13C/(13C+12C) leads to a negligible error due to 12C being 99% of 13C+12C. These two points are easily confirmed, plus Keeling et al use the latter approximation themselves.
My predicted δ13C value in January 1980 (based on constant δ13C since 1765):
((-6.4*278) + (-13*(337-278)))/337 = -7.56 per mil.
This compares with observed -7.51 per mil and the unadjusted Keeling et al prediction of -7.75 per mil.
My predicted δ13C value in December 2013 (based on constant δ13C since 1765):
((-6.4*278) + (-13*(396-278)))/396 = -8.37 per mil.
This compares with observed -8.37 per mil and the unadjusted Keeling et al prediction of -8.75 per mil.
Just to check how well my “model” was still behaving when I did this analysis, the most recent δ13C values at Scripps were for October 2019 and were -8.52 with CO2 at 410 ppm.
My prediction (based on constant δ13C since 1765):
((-6.4*278) + (-13*(410-278)))/410 = -8.52 per mil.
Of course, knowing that all of the CO2 that has been added to the atmosphere since 1765 has had the same 13C/12C ratio (on average and obviously a net effect) and is not a coincidence (as proven by the Keeling plots), does not tell us exactly which sink/source model may be correct, but it certainly provides a major constraint on the possible explanations. Plus, such explanations must also include the observed inter-annual variations, which the model of Keeling et al (2017) does not.
ENSO is definitely a driver of atmospheric temperatures. It is not a driver, however, of the total heat retention in the climate system. That makes it an internal variation; not an external force on the climate system as a whole. It is as you hinted; a mechanism for moving energy to/from the various heat reservoirs of the climate system.
Unless moving energy around alters the energy balance of the system. The winter polar atmosphere has a very weak greenhouse effect due to its extremely low water vapor content. Moving more energy there is like reducing the average GHE of the planet per unit of energy, leading to a greater energy loss.
This planet is in an ice age because it has two gigantic cooling radiators at the poles where a lot of the energy is lost (not the other way around). Arctic winter warming and winter sea-ice loss are negative feedbacks to warming that if continued will result in the inability of the planet to warm further.
Let me make sure I have this right. It is your position that less sea ice and and thus a lower planetary albedo inhibits warming? Is that your position?
The problem is that less sea ice does not cause an increase in the amount of light absorbed by the planet.
Let me make sure I have this right. It is your position that the exposed ocean in the absence of sea ice has the same or higher albedo as the sea ice itself? Is that your position?
bdgwx, as usual, has not bothered to do the math. Because the poles are at high latitude, variations in ice extent there have a negligible influence on global albedo.
Help me out. Post a peer reviewed publication with the math and resulting albedo change for the Arctic region that says albedo stays the same or increases in this region as sea ice declines.
Doh, less winter sea ice does not affect albedo, as there is no Sun in the Arctic in winter to produce albedo.
All heat in the Arctic in winter is the result of energy transport from lower latitudes. If the Arctic is warming in winter is because more energy is being transported every winter. And that energy has only one place to go. Out of the planet, radiated as OLR. It is a cooling feedback. No wonder the pause coincided with the Arctic warming. Moving energy to the poles is the main climate change mechanism, as it clearly has more effect than changes in CO2.
The Arctic has a summer and the Sun shines there too. In fact, 70N receives more solar insolation in June than my hometown at 40N.
It does shine in summer, but there is not much summer Arctic warming:
https://ocean.dmi.dk/arctic/meant80n_anomaly.uk.php
And the Arctic Ocean is cooling, not warming
So albedo changes are clearly not a factor. Evidence is that predictions of Arctic ice demise due to decreasing albedo have turned incorrect.
In the first graph there’s not much warming in the summer because of the clamp at 0 C.
The second graph shows the temperature change from 2004 to 2020 between 55N and 65N. That is not the Arctic ocean. And only about 5% of that ring even has sea ice and that is only in the winter months. It also happens to be the ring impacted by the AMOC resulting in the observed (and predicted) cooling in the North Atlantic region in and around Greenland which likely explains at least part of the graph.
Those graphs do not address albedo change at all.
I guess then you answered your question yourself. No summer warming, no winter albedo, and no change in summer sea ice extension.
It is clear that changes in Arctic albedo are not driving Arctic climate changes, unlike what “experts” believed.
I didn’t ask a question. And you can’t make statements about albedo from the summer sea ice minimum alone.
The CAGW hypothesis has, for all intents and purposes, been disconfirmed.
After 44 years of satellite records, the global temperature anomaly is at 0.05C at the end of 2022 with a 44-year warming trend of just 0.13C/decade which most certainly is not “an existential threat to all life on planet earth”…
According to CMIP6 climate model projections, the global temperature anomaly should be 1.46C at the end of 2022, with a 30-year warming trend of 0.37C/decade which is almost three times observations, which is laughable.
Moreover, the PDO is already in its 30-year cool cycle and the AMO will likely start it 30-year cool cycle around 2025, which may bring 30+ years of flat/falling global temperature trends as occurred from 1880~1913 and 1945~1980 during previous PDO/AMO cool cycles.
Leftist global governments wasting $100’s of trillions trying to impossibly replace fossil fuels with wind and solar grids is starving people of energy, food and economic development, and must be stopped.
Unfortunately, it will likely require a number of severe winter cold event causing cascading blackouts and thousands of deaths before political hacks realize wind and solar grids are completely incapable of providing stable, cheap and reliable energy.
Thank you for your post Lord Monckton-san, I wish you all the best for a prosperous and enjoyable New Year!
If we compare activity in 2022 to 2011 (exactly 11 years difference) solar activity is lower than in the previous cycle and is developing by leaps and bounds. I predict a shorter and weaker cycle 25 than cycle 24.
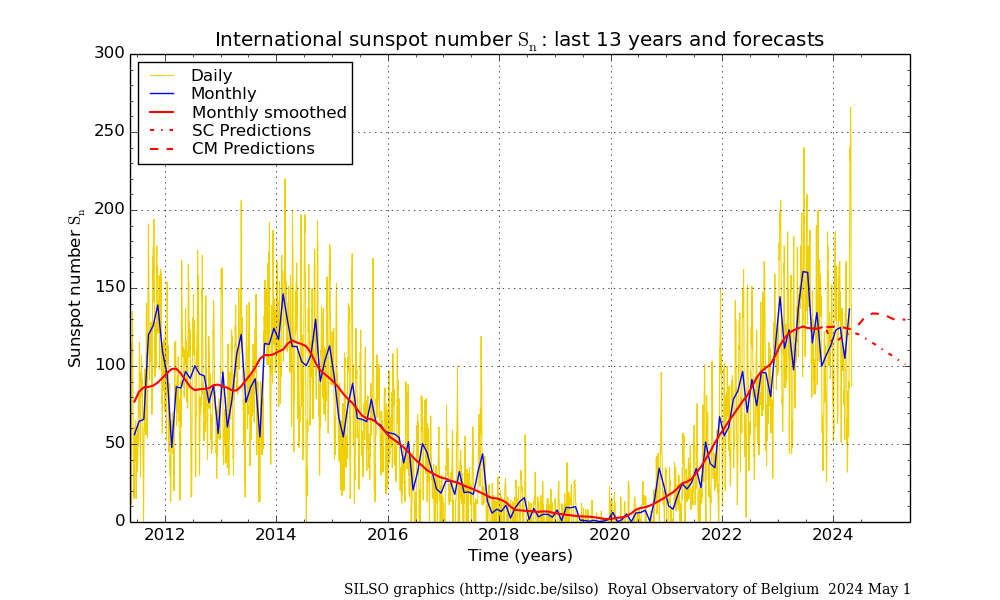
Since the end of December, we have seen another decrease in activity, which is affecting the ripple of jet streams in the tropopause.
SC25 is so far indistinguishable from SC24
https://www.solen.info/solar/
Your comparison is incorrect and your prediction is baseless.
Why are you still counting sunspots?
Don’t you know there are NASA satellite measurements of top of the atmosphere solar energy? We have MEASUREMENTS ! Use them.
Not just sunspots.
Thermosphere Climate Index
today: 14.95×10¹⁰ W Neutral
Max: 49.4×10¹⁰ W Hot (10/1957)
Min: 2.05×10¹⁰ W Cold (02/2009)
explanation | more data: gfx, txt
Updated 04 Jan 2023
Not just sunspots.

Unless solar and wind are built with solar and wind we are actually going to raise emissions in trying to reduce them.
In its 25 year lifetime a solar panel or windmill produces enough energy to pay for itself and 2 siblings.
That means any attempt to more than double green energy every 25 years will require increased energy from non green sources.
The notion that we can reduce emissions by producing a parallel green grid is simply an illusion.
Solar panels and bird and bat shredders will not last 25 years — 15 to 20 years at the most.
La Niña works perfectly in the western equatorial Pacific. The SOI remains in high positive territory and is bringing downpours to eastern and northern Australia.

https://www.longpaddock.qld.gov.au/soi/
Latest (2023/01/03) 1-day area-weighted 2m temperature anomalies calculated from the NCEP Climate Forecast System (CFS) and CFS Reanalysis (CFSR). The anomaly values fluctuate day-to-day and week-to-week depending on prevailing weather patterns. For context, daily temperatures for the domains below are available via interactive charts for the entire CFS/CFSR 1979–present record. Anomalies are based on 1979–2000 climatology for the specific day of the year.
Tropics Southern Hemisphere Antarctic
+ 0.08 °C – 0.01 °C + 0.01 °C
Thanks, Christopher, for the update on the current/recent pause…not to be confused with the pause following the 1997/98 El Nino.
Regards,
Bob
Why not, for a change, look at this from a human flourishing point of view? Thanks to current natural variations – despite the best efforts of the UN and national governments to make heating unaffordable – we haven’t had to fall back on heating quite so much this year. Yes, we did have a nasty cold snap from a warming(?) Arctic, but unusual warm winds from Africa have saved us a fortune.
And that, to the elites, is the real catastrophe.
“How long will the current Pause last?”
If only their models had the remotest chance of an answer. They haven’t a clue. But then, neither have I.
Let’s look at temperature anomalies in the Southern Hemisphere.

They display a nice wave-5 pattern, with five warm areas in the Eastern Pacific, Atlantic, Western Indian, Eastern Australia, and New Zealand, and cool areas between them extending equatorward. This is the result of atmospheric planetary wave activity affecting the southern tropical jet.
Forecasts say that La Niña will quickly end with the rise of El Niño. I disagree with neither the first nor the second thesis. La Niña will not end quickly and El Niño will not develop.


For how long do you reckon?
I predict at least until April.
Thank you.
An El Niño this coming summer-autumn is a safe bet. A fourth La Niña is unheard of, and solar activity is too high for a neutral year.
What would it’s intensity be? Will it top 2014/2016 or will it be quieter staying inline with the 2016 pause?
I don’t know of any way to predict the intensity of ENSO, but based on frequency it is unlikely that it would be a very strong Niño, as they are infrequent.
Meanwhile, the global sea surface temperature anomaly fell to 0.1 C degrees.

“extremists will try to maintain that Mis about 110%- i.e., the Earth would be cooling were it not for our influence on the climate.”
And… errr… but, the earth is cooling. How far is it from linking up with “The 19yr Dreaded Pause” and making it a quarter of a century ‘pause’?
Too bad you are banned from the COP World Climate Fun meetings in which you thrilled the participants at Doah advising of the first big pause!
Just to clarify, John Christy and I did not design, build, or operate the satellites.
Salute!
Good read about a actual correlation of fossil fuel use by humans and carbon dioxide using real observations without lottsa models.
https://notalotofpeopleknowthat.wordpress.com/2023/01/04/nature-controls-co2-not-man-op-ed/
Gums sends..
You slackers. /s
You did launch them, though, right…? 😎
And I was thinking you might even fly on board the satellites yourselves.
My bad!
Much was extrapolated about atmospheric cooling due to SO2 aerosol cooling due to Pinatubo and El Chicon eruptions. But for the giant Hunga Tonga eruption of a year ago….all we seem to get is analyses of why it didn’t do anything to climate. This possibly mean the divergence between models that use SO2 aerosol corrections developed from Pinatubo and El Chicon are even farther from actual readings. In other words, the models would calculate an even higher ECS than what they presently calculate, showing even more inaccuracy. Supposedly water vapour warming outweighed the SO2 cooling….sounds contrived….
It was an underwater volcano. Most of the SO2 got dissolved into the ocean. The ratio of H2O to SO2 that got injected into the atmosphere is significantly different than Pinatubo, El Chichon, Agung, and others. And it clearly had an impact on the atmosphere. The temperature at the 30mb level in the stratosphere in the 25-65S band had been in a perpetual record low state from July of 2022 until January of 2023. The water vapor cooled the atmosphere inline with expectations from a GHG effect.
That must be an extremely fast rate of reaction. The saltwater stripping the gases from the ejected material in just how many nanoseconds?
The gas cloud, (even if it didn’t move all the water up and out of the way), would have been in contact with the water for such a short period that you could safely ignore it’s potential for gas exchange.
Guess again.
I don’t know how many nanoseconds it was. The end result was only about 0.5 Tg of SO2 getting lofted into the atmosphere. Pinatubo was about 20 Tg of SO2 or 40x the amount of Hunga Tonga.
The ocean didn’t strip the SO2 from the gases. It probably wasn’t there is a better match to the data, (as measured).
Some say the stratospheric polar vortex is strong. It is strong, but not over North America.

I’ll take this as a principal component….
NOAA SST-NorthAtlantic GlobalMonthlyTempSince1979 With37monthRunningAverage.gif (880×481) (wp.com)
What happens when the changes that erased the previous pause are undone/removed?
Now we can see the effects of the collapse of the polar vortex over North America. Despite La Niña, heavy rainfall will end the drought in California. Meanwhile, La Niña is at work in the Southern Hemisphere.

“IPCC (1990), which presented four emissions scenarios, of which the business-as-usual scenario A has proven closest to reality. For instance, Scenario B was based on the assumption that emissions would remain constant at the 1990 annual level until 2025.”
Based on the 1990 report that was not the assumption for Scenario B, current CO2 emission levels are between A and B. It was projected that Scenario B would “result in an equivalent doubling of pre-industrial carbon dioxide by about 2040″.
“Phil.” is, as usual, wrong. The graphs of the predicted evolution of anthropogenic forcing from 1990-2025 under Scenario B and separately under the assumption of no annual emissions growth compared with the 1990 annual emissions are very, very close to coincident.
As usual Monckton refuses to admit to his misstatements “Scenario B was based on the assumption that emissions would remain constant at the 1990 annual level until 2025” Is not true.
There are two separate graphs in IPCC (1990) to which I referred in my answer to “Phil.”. The first showed the evolution of anthropogenic forcing under Scenario B; the second showed the evolution of anthropogenic forcing under the assumption that annual emissions were held fixed at the 1990 level. The two curves are near-coincident from 1990-2025.
However, emissions have in fact continued to increase compared with the annual emissions in 1990. For this and other reasons, Scenario A is closest to reality (indeed, the CO2 forcing has proven exactly as predicted therein).
Again, here is the graph of the scenarios representing the atmospheric states from which the temperature predictions are based.
And here is the temperature predictions for each scenario.
Care to give the link to the graphs you refer to? The similarity between the two graphs does not address your incorrect statement regarding the basis for Scenario B.
The actual basis was: “In Scenario B the energy supply mix shifts towards lower carbon fuels, notably natural gas Large efliciency increases are achieved Caibon monoxide controls are stringent, deforestation is reversed and the Montreal Protocol implemented with full participation”
The blockage of the polar vortex by ozone accumulation over the Bering Sea is causing strong ripples in the jet stream over North America and an influx of Arctic air masses to the southern US.


Is there any natural process apart from, 45-year UAH dataset from December 1978 to December 2022, that shows a straight line trend which obviously isn’t linear. Definitely increasing but not linearly.
Not growing. During the Southern Hemisphere winter, the temperature was below the multi-year average. During La Niña, global temperature does not rise. If the current La Niña had been strong heat accumulation in the ocean would have been greater and there would have been a greater decrease in the temperature in the troposphere. However, the Nino index of 3.4 oscillated around 1 C, which is the La Niña average.
Of course, around -1 C.

In response to Ben Vorlich, the least-squares linear-regression trend on a dataset is by definition linear, even though the underlying data are stochastic.